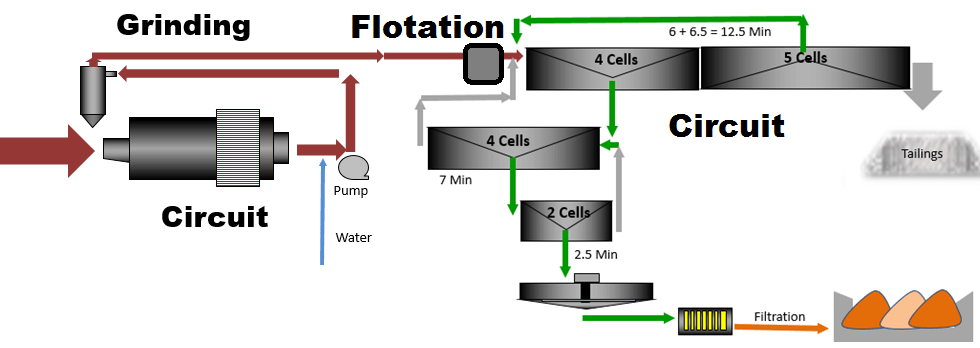
Every mill operator, metallurgist or not, needs to understand the Flotation Kinetics and Flotation Rates taking place within his plant’s circuit. A simple case study of a very basic process flowsheet (ball mill grinding to conditioning, followed by rougher/scavenger and 2 stage froth flotation cleaning).
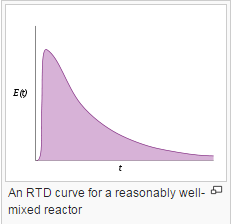
This very basic and practical study of Froth Flotation Kinetics starts with in-plant physical measurement of each circuits (flotation) retention time as well as the determination of each residence time distribution RTD profile. An RTD test is done using a tracer (commonly lithium or a dye). The RTD test curve will tell you how good your reactor, the flotation bank, is (when compared to a perfect plug-flow reactor) as well as what the average retention time of your machine is to study its Flotation Kinetics.
 |
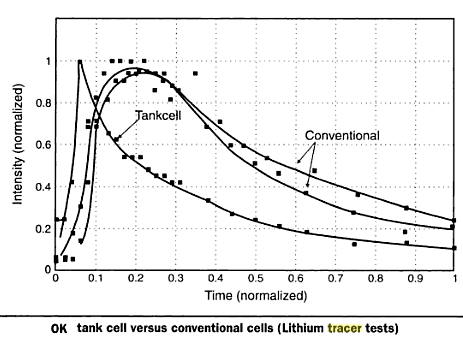 |
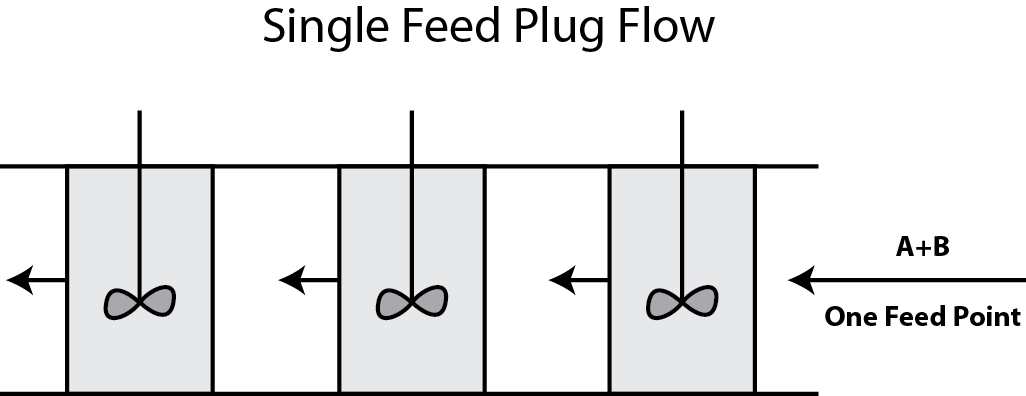
Remember that each flotation cell feeds each other to form a bank. The more cells in the bank the closer to plug flow your circuit will be.
 The RTD tracer test does not provide Flotation Kinetic/Rates data; it only measures the time available for flotation.
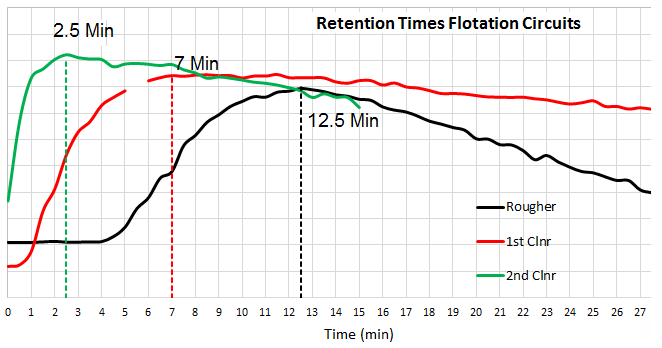
OK now, I ran a separate in-plant RTD test on each circuit for which here below I display the resulting curves.
Flotation Kinetics Summary
- The 2nd cleaner offers 2.5 Minutes of Measured flotation time
- The 1st cleaner offers 7 Minutes of Measured flotation time
- The Rougher/Scavenger bank offers 12.5 Minutes of retention time.** One might argue that because the Scavenger Conc must be refloated in the Rougher cells, the circuit provides only 7 minutes (5 cells/9 cells X 12.5) of true rougher flotation time.
Laboratory Tests
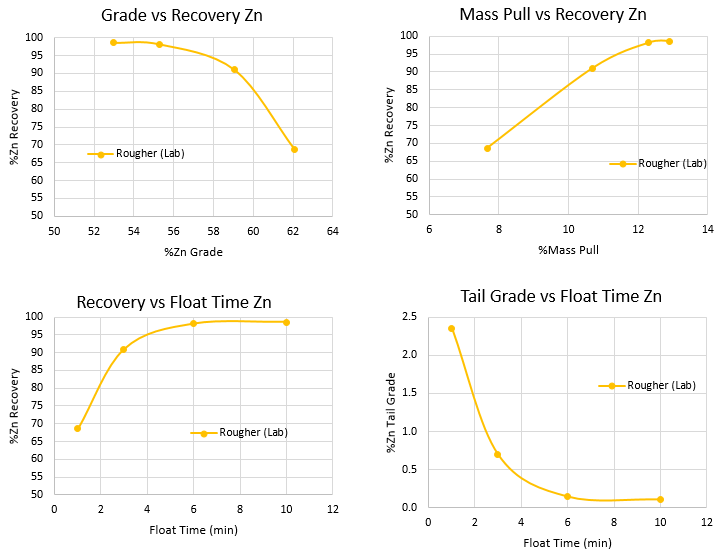
Simple benchmarking flotation kinetics tests show the following results and outcomes:
- In all Laboratory tests, 95% Zn recovery is obtained after 4 minutes of rougher flotation and it takes another 2 more minutes to obtain 3 more points of recovery and the last 4 minutes serves no purpose.
- Effectively, sulphide flotation is complete after 6 minutes of laboratory rougher time.
- In all Laboratory tests, the concentrate from the 1st minute of rougher is floated at >61% Zn at greater than 65% recovery.
Laboratory VS Plant
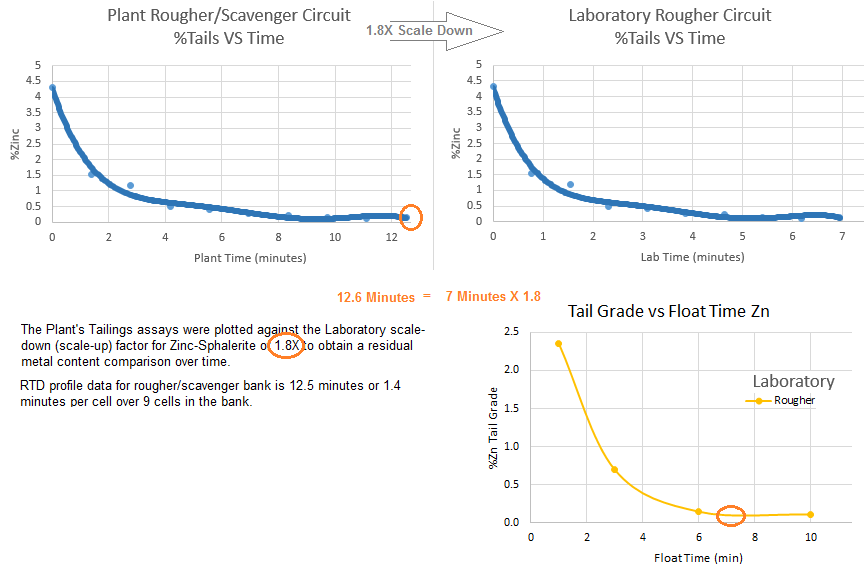
The Plant’s Tailings assays were plotted against the Laboratory/Plant scale-down (scale-up) factor for Zinc-Sphalerite of 1.8X to obtain a residual metal content comparison over time. RTD profile data for rougher/scavenger bank is 12.5 minutes or 1.4 minutes per cell over 9 cells in the bank.
The above data points to the rougher/scavenger retention time and flotation kinetics being a match and a circuit made of flotation machines correctly sized/designed.
Note that the Zinc rougher circuit only has 6-7 minutes of true rougher flotation time. The “rougher bank” is composed of ½ rougher and ½ scavenger which concentrates needs refloating in the rougher and effectively consumes ½ the flotation capacity.
Below is the same data set but includes some cleaner circuit sampling and presented. “Pulp” samples mean the cell’s pulp/slurry and therefore tailings rejects.
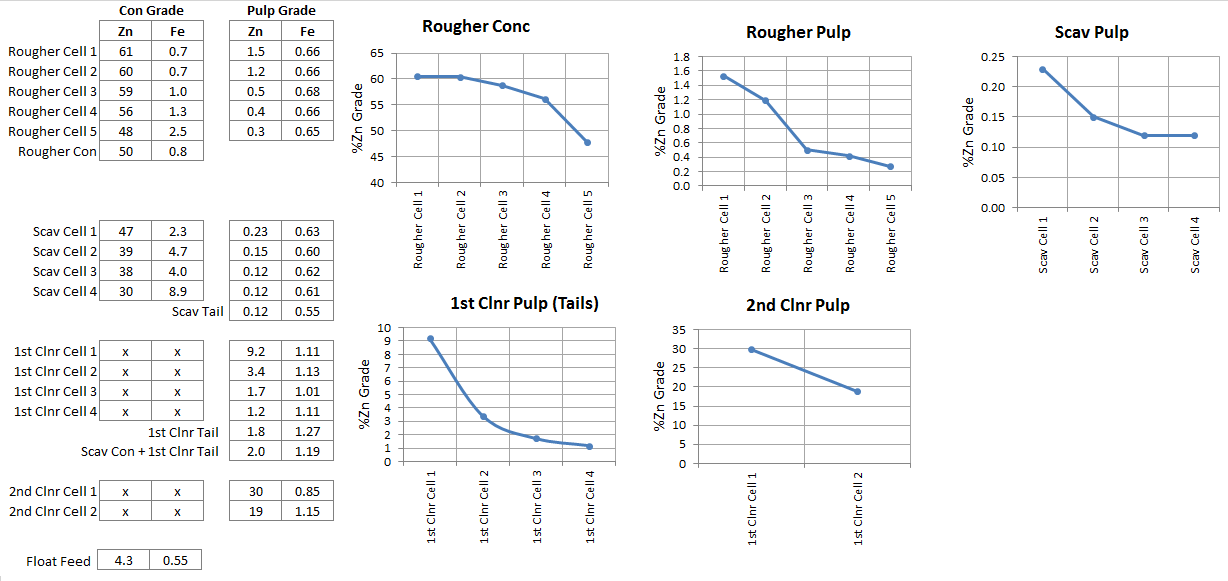 The 1st cleaner bank comprise of 4 cells while the 2nd and final cleaner is made of 2 cells. All cells (rougher/scavengers/cleaners) are Denver 300 flotation machines.
As you can see, this ore has an extremely fast kinetic of flotation. The rougher circuit appears correctly sized.
I need to perform laboratory cleaner tests to verify the rest.
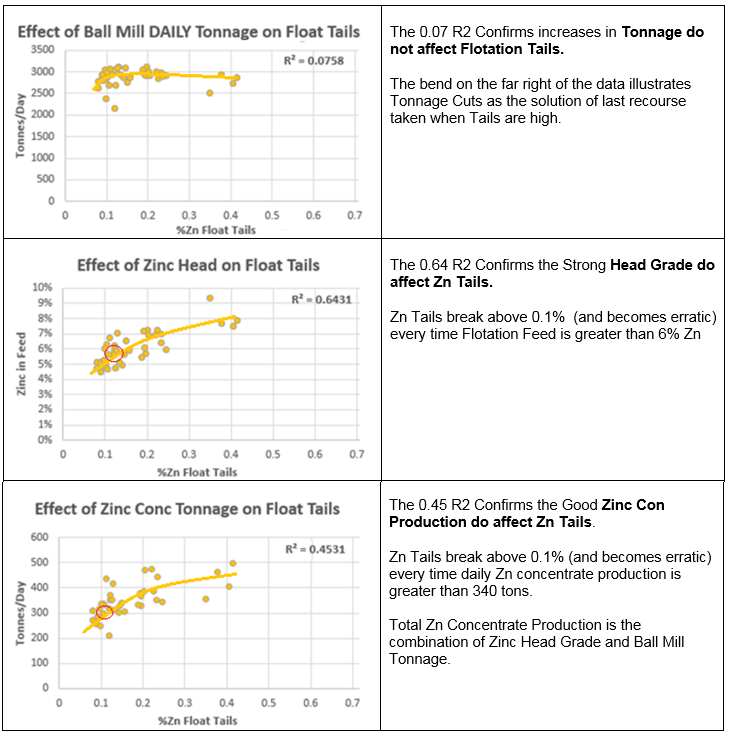
For now, looking a more plant data, the following conclusions can be drawn:
- Ball Mill Tonnage (in itself) does not impact Zn Flotation Tails levels
- Flotation Feed Zinc head grade has the most impact on Zn Flotation Tails levels
- Total Zinc Production has a collateral impact on Zn Flotation Tails levels
The Zinc 2nd cleaner APPEARS to be is very much undersized with 2.5 minutes of flotation time. This 2.5 minutes is generally enough but becomes a restriction when Zinc head grade goes over >6% and the total Zinc production needing flotation via that 2nd clean is greater than 340 tons/day.
For more about Froth Flotation Kinetics.
- Evaluating Copper Rougher-Scavenger Flotation Circuit Performance
- Mineral Composition and Fragmentation
- Flotation Process Development and Assessment
- Measure and Evaluate Flotation Cleaner and Scavenger Tail Losses

