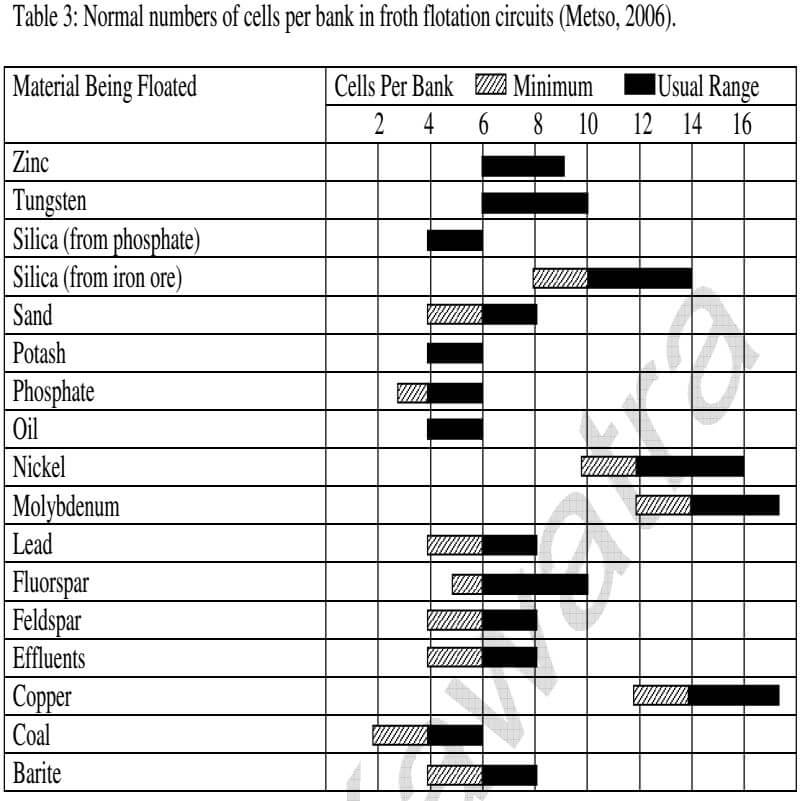
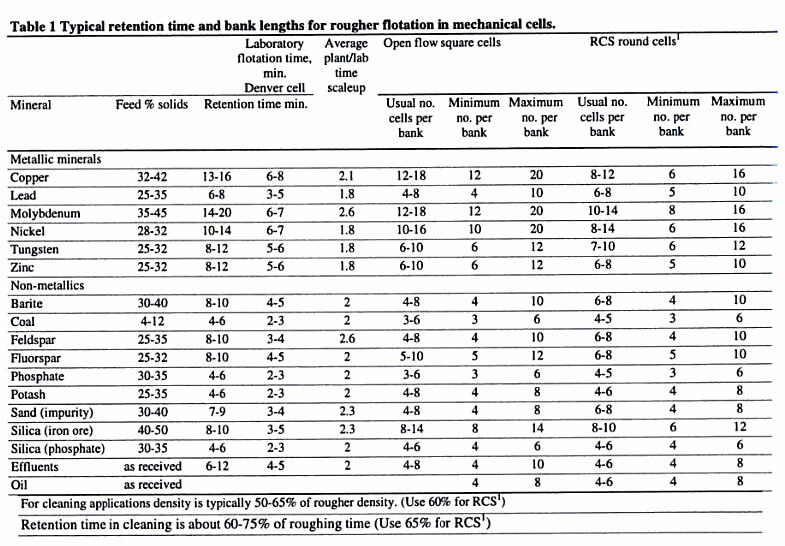
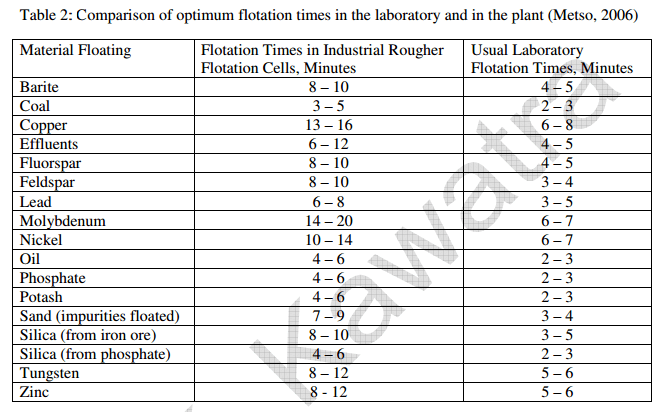
Using Laboratory bench-top float test results and their retention (flotation) time to scale-up to real life full scale plant time can be done using the following tables and examples. How to select the proper scale-up factor takes experience and …. good data.
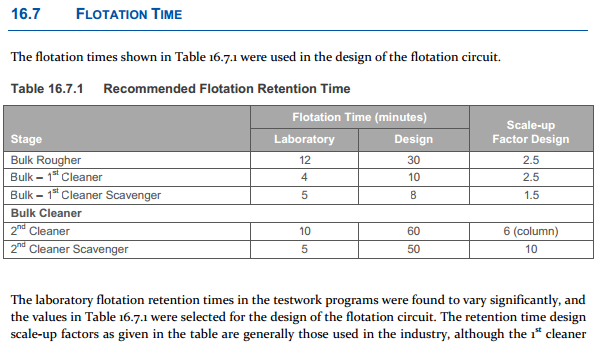
Figure 16.7 was used and seen in the a technical report for the Pebble Project in Alaska (Northern Dynasty Minerals). This project is a “Copper flotation” project with some Moly (<200ppm). The chosen scale-up was 2.5 while The Book calls for on copper 2.1X.
Without have access to the complete metallurgical testwork data and results I’d say 2.5X was the extra chosen to factor in Moly recovery which The Book calls for 2.6X.
Good overall selection in my view.
Up scaling of froth flotation equipment and SCALE-UP OF LABORATORY GRINDING AND FLOTATION TESTS FOR PLANT DESIGN AND OPTIMISATION are very useful papers on the topic.
PS: Notice the 6 to 10X scale-up factors for Column cells? hmm… Columns they so make me think of nature…
Copper Oxide flotation scale-up factors to a plant are depend on the volume of the lab cell used during testing:
3L 3.5x to 4x
5L 3x to 3.5x
8L 2.5x to 3x
https://www.chem.mtu.edu/chem_eng/faculty/kawatra/Flotation_Fundamentals.pdf
