Table of Contents
Basic Geometallurgy Short Course for mineral processing applications

Geometallurgy and grinding
- It is often desirable to be able to load ore hardness information into the mine block model.
- Allows the mining engineers to better schedule ore delivery to the plant, and to run more sophisticated net present value calculations against ore blocks.
- Requires hundreds of samples from drill holes distributed across the orebody.
Geometallurgy and plant recovery
- It is often desirable to be able to load leaching information into the mine block model.
- Allows the mining engineers to run more sophisticated net present value calculations against ore blocks.
- Requires hundreds of samples from drill holes distributed across the orebody.
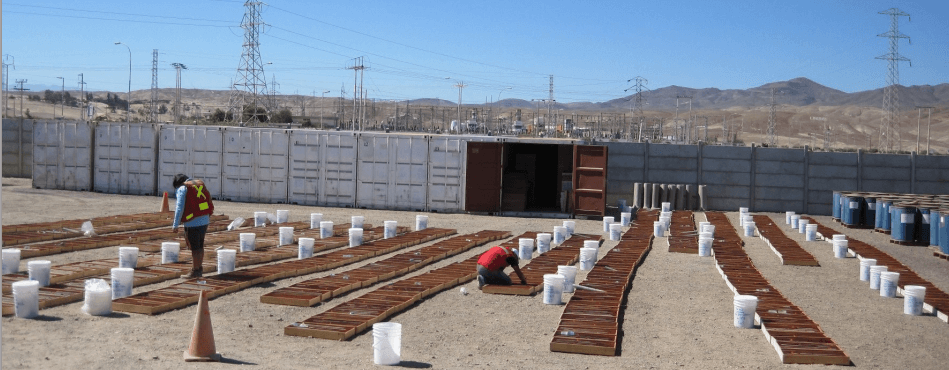
Sampling

Block model
Geologic systems can be modelled as a structure of equally sized blocks arranged in a regular grid.
Interpolation
Interpolation is the mathematical method used to estimate a parameter in the spaces between known positions with known values.
- A simple interpolation method could be a linear weighted average of the two nearest points.
- Geo-statisticians use more complex methods, such as kriging.
- Consider the same 1-dimensional model with measurements at points A&B.
- Try an inverse distance-squared weighting.

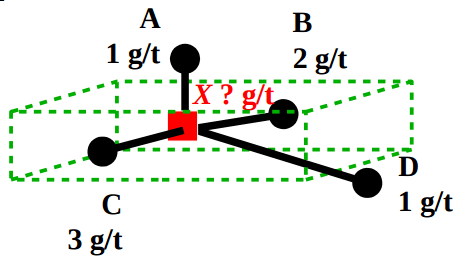
- Consider a 3-dimensional model with measurements at points A,B,C,D
- A ‘polygon’ displays the rock unit that X belongs to.
Interpolation by kriging
- The most common interpolation is some form of kriging.
- Kriging uses nonlinear, directional interpolation constrained by domains.
Check the domains
- Domains determined for assay data may not apply for process parameters
- Geostatisticians should re-domain the process data to verify.
Example: Grade may be determined by alteration, but grindability may be determined by tectonic stress fields.
- You must check!
Domains
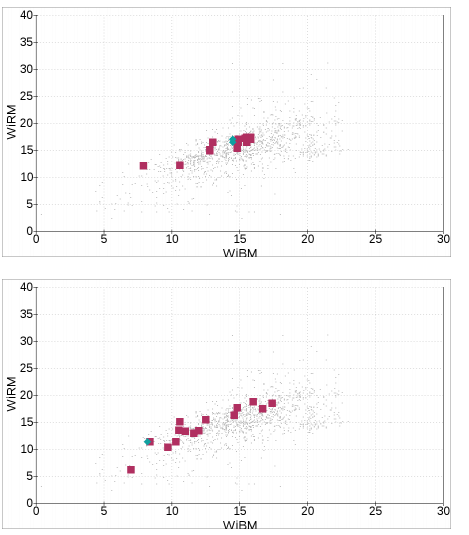
- Example grinding data, top from a ‘hematite’ domain and bottom from a ‘magnetite’ domain.
- Shapes are different – confirms each must be interpolated separately.
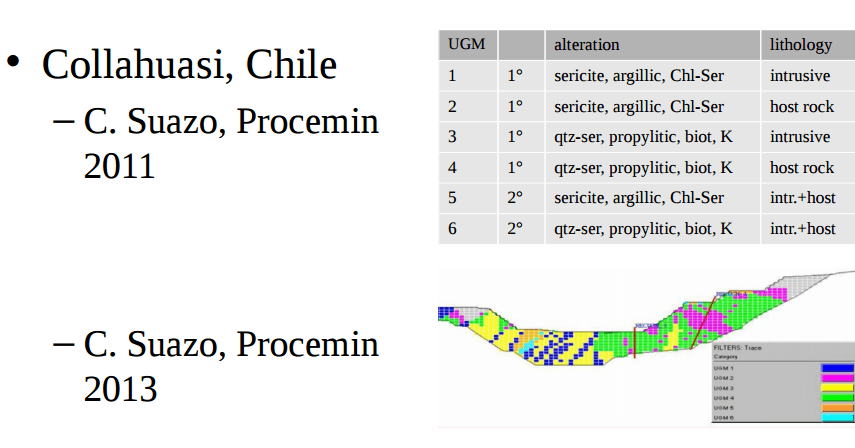
Example domain definitions
Variogram
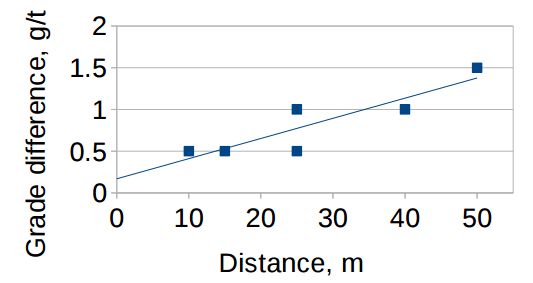
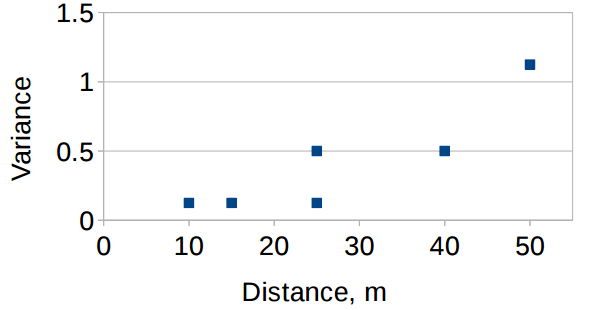
A variogram plots the average difference between two arbitrary points and the distance between the points.

- Warning: oversimplified!
- Plotting the example grade difference VS distance from earlier slide
- Slightly more correct version
- Y-axis shows variance
- The population variance is shown as the “sill”
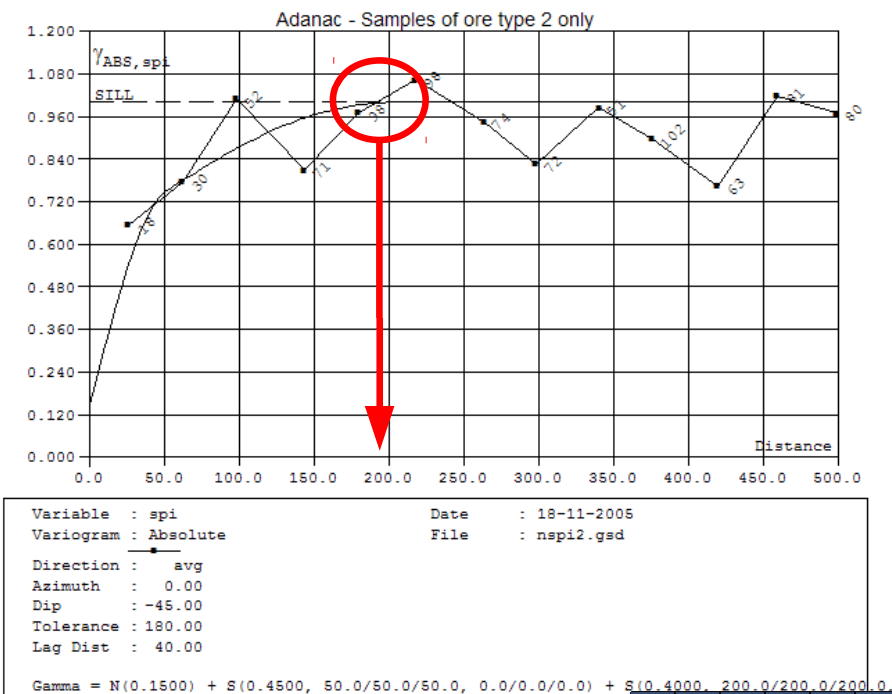
A published variogram from Adanac Moly suggests that the maximum spacing between samples should be 200 m or less.
How many samples?
Area of influence of a sample
- How “close by” must a sample be to have importance in geostatistics.
- Observed as the location of the“sill” of a variogram of grindability versus distance.
- So you should know the variogram result of a geometallurgy program to plan a geometallurgy program.
Additive parameters
Additivity
- Geostatistics only works if the values you are “mixing” have a linear mixing characteristic.
- A parameter is “additive” if you can combine two samples of a known value, and the blend test results in the arithmetic average of the two.
– Eg. mix one sample “10” and a second sample “20”
– The blend should give a result of “15” - Values suitable for block modelling
– Not all grindability results are suitable for block model interpolation, they must be “additive” • e.g. mixing two samples with “10” and “20” should give “15”. Work index, SGI and A×b results do not have this property.
– Specific energy consumption is generally additive, so Etotal, ESAG and/or Eball can be interpolated.
Additivity of process parameters
A variety of process models exist. You will need to evaluate which models are useful for your mine.
– The process models need to make useful predictions of process behaviour.
– The process models need to have additive parameters suitable for geometallurgy.
Geometallurgy program
Procedure for a geometallurgy program:
- collect samples distributed around the orebody
- test in the laboratory, use at least 2 methods
- run all samples through comminution models
- distribute specific energy values into block model
- run geostatistical checks (variograms) and repeat (do a second, in-fill, sample collection program)
- provide mining engineers with a model populated with grindability values; run annual production forecasts.
The block model
A block model containing geometallurgical data will include:
- grindability information suitable for estimating the maximum plant throughput,
- recovery information suitable for estimating the metal production,
- (flotation plants) concentrate grade predictions for smelter contracts.
Grindability models
- Specific energy consumption models determine how much energy is required to grind a sample.
– E given in kW·h/t {alternative notation: kW/(t/h)} - Mill power models determine the amount of grinding power available
– P given in kW
• Dividing P by E gives the circuit throughput
– t/h = kW ÷ (kW·h/t)
Throughput predictions
- Grindability, in the form of specific energy, will be interpolated for a block.
– in this example, ESAG = 6.0 kWh/t - The metallurgists will supply the typical power draw of the SAG mill (at the pinion).
– Yanacocha is about 14,000 kW - Throughput = 14,000 kW ÷ 16.0 kW = 875 t/h
Recovery models
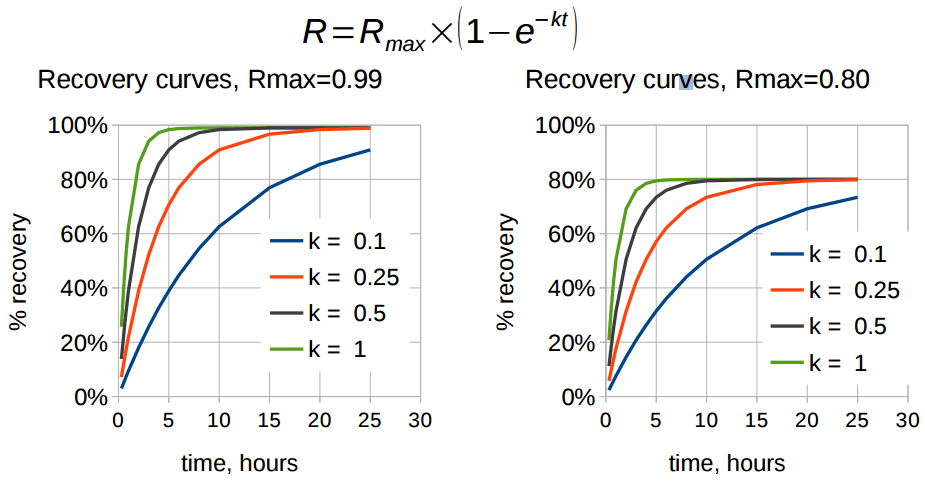
Net Smelter Return prediction
- The mining engineer can estimate the revenue of a block using the recovery equation(s) and the block model parameters.
– Gold recovery R is known by interpolation.
– Revenue=block mass (t) × grade (g/t) × recovery - If there are penalty elements in the block model, is may be necessary to estimate their recovery, too.
Block value prediction
- Determine the value of a block
– Revenue
include penalties, if applicable
– Operating costs ($/t)
• include mill power draw, kWh/t × t/h × $/kWh
• include other operating costs
– Processing time can be included as a cost penalty
• revenue form harder blocks worth less than revenue from softer blocks.
New cut-off calculation
- The variable revenue benefits blocks with good recovery characteristics.
- The variable grindability benefits blocks with lower power consumption.
- Applying a penalty for difficult to process blocks benefits easy to process blocks.
Benefits of geometallurgy
- Permits future production to be accurately predicted. Future sales can be estimated.
- Identifies “problem” areas within the mine where throughput may be low or recovery may suffer.
- Allows better optimized mine plans with more accurate NPV predictions per block.
Variable mining rate
- Operate the mine to keep the SAG mills full.
- A grinding geometallurgy database allows mine planners to schedule more ore to the mill.
– Do not plan a “nominal” throughput rate for the whole mine life.
– mine more in years with soft ore, and
– mine less in years with hard ore.
– If possible, defer hard ore until later in the mine life.
Variable gold production
- The gold production in each year of a mine life will be different, and can be calculated from
– block gold grade,
– block gold recovery,
– block throughput calculated from the grindability. - The pit optimization software will pull the pit towards softer ore with better recovery.
Summary of benefits
- The pit shape and equipment fleet will change due to the new NPV equations,
- the pit will probably be mined more rapidly,
- production is advanced into earlier mine years,
- a more optimal pit shape will all result from a fully applied geometallurgy program, and
- no nasty surprises.
Stages of a geometallurgy program
- Decide which process parameters to collect
– plant surveys, fitting models to plant data - Conduct a drilling program to obtain samples of future ore
- Conduct a laboratory program determining parameters for samples
- Supply geostatisticians the parameters and their spatial locations
- Interpolate the parameters into the block model
– check variograms, conduct in-fill drilling and recycle - Generate a mine plan with a variable ore throughput
- Generate a cash flow with a variable gold production rate
Cost of a geometallurgy program
- Plant surveys, engineering time fitting models to plant data
- drilling program to obtain samples of future ore
- laboratory program determining parameters for samples
- Geostatistician time to interpolate parameters into the block model
– check variograms, conduct in-fill drilling and recycle - Mine engineering time to generate a mine plan
- Sustaining capital cost of mine fleet needed to support variable throughput rates
Geometallurgy for scoping studies
- Early project evaluation will not use a full program:
– Use about 5-15 intervals of half-core (from the resource drilling program).
– Do laboratory work for one set of process models.
– Unlikely enough data will exist to do variograms or kriging. Work with cumulative distributions instead of geometallurgy.
Geometallurgy for prefeasibility
- Collect at least 50 more half-core samples from the resource drilling.
– The quantity should be sufficient to permit creation of variograms.
– Do the first circuit of the geometallurgy program stages, but exclude the recycle.
– Determine how much of the orebody is unrepresented by samples.
– Do the variable rate mine plan and gold production schedule.
Geometallurgy for full feasibility
- Using the variograms from pre-feasibility, determine how many more samples are needed
– These extra samples should be dedicated metallurgical drilling. Use the whole core for a greater variety of metallurgical tests. - Do the “recycle” loop and determine updated variable rate mine plans and gold production.
Geometallurgy for operation
- Do the program indicated for pre-feasibility and feasibility to establish the initial mine plans.
- Do annual drilling to keep extending into the next 5 years of future ore.
- Revise the process models (did they work?).
- Revise the mine plans based on the updated geometallurgy database.
Examples of geometallurgy
- Los Bronces, Confluencia (Chile)
– Design of pit for an expansion project included plant recovery and ore grindability parameters. - Collahuasi (Chile)
– Monthly throughput predictions are within 5% of actual. - Freeport-McMoRan study
– Geometallurgical database used to compare SAG milling to HPGR in a detailed study. - Andina, Piuquenes tailings (Chile)
– Recovery and regrind energy for re-mining a tailings pond.
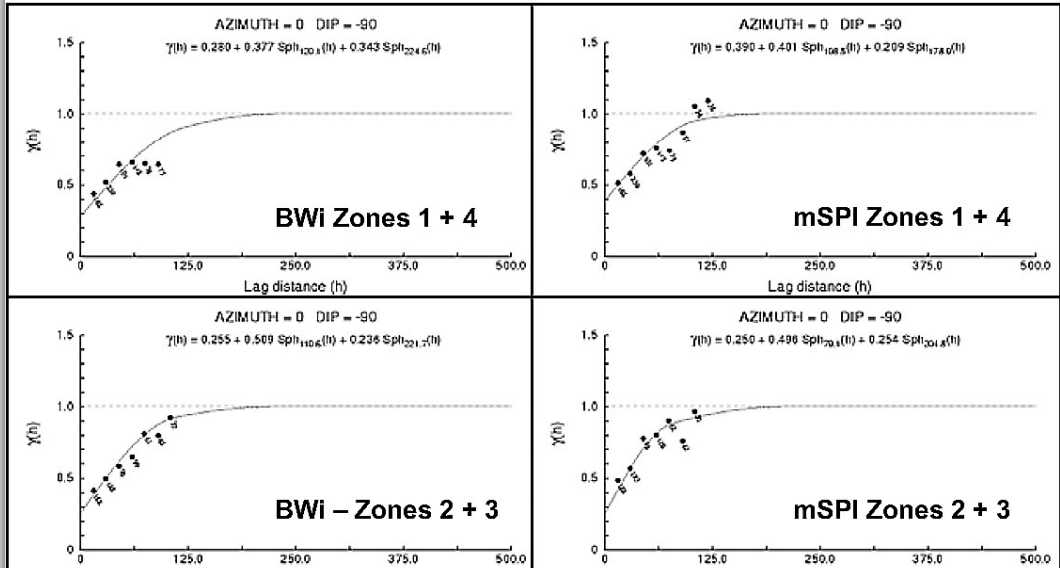
Escondida variograms
Examples of geometallurgy
- Adanac Molybdenum, Canada
– Flotation model using interpolated parameters:
• k, Rmax value for molybdenum
• k, Rmax value for non-sulphide gangue
– Different models run at different grind P80 sizes
• k, Rmax values change at each P80.
CONCLUSION
- Grade proxies and process mineralogy are often called geometallurgy, but they are different
– Grade proxy is where a process variable (eg. recovery) is closely related to a grade (%Cu)
– Process mineralogy is a careful mapping of minerals (rather than elements) - useful to predict recoveries, rate constants, etc.
Most important concept! ALL MODELS ARE WRONG, BUT SOME ARE USEFUL
Presented by: Alex Doll, Consultant of SAGmilling.com
References
– Brissette, M. & de Souza, H. (2012) `Metallurgical testing of iron ore from the Labrador Trough`, Mineral Resources Review Conference.
– Bulled, D. (2007) `Flotation circuit design for Adanac Moly Corp using a geometallurgical approach`, Proceedings of the 39th Canadian Mineral Processors Conference, Ottawa, Canada.
– Preece, R. (2006) `Use of point samples to estimate the spatial distribution of hardness in the Escondida porphyry copper deposit, Chile`, Proceedings of International Autogenous and Semi-autogenous Grinding Technology 2006, eds.
Allan, M., Major, K., Flintoff, B., Klein, B. & Mular, A., Vancouver, Canada. Slide 51 2015-11-12
• References
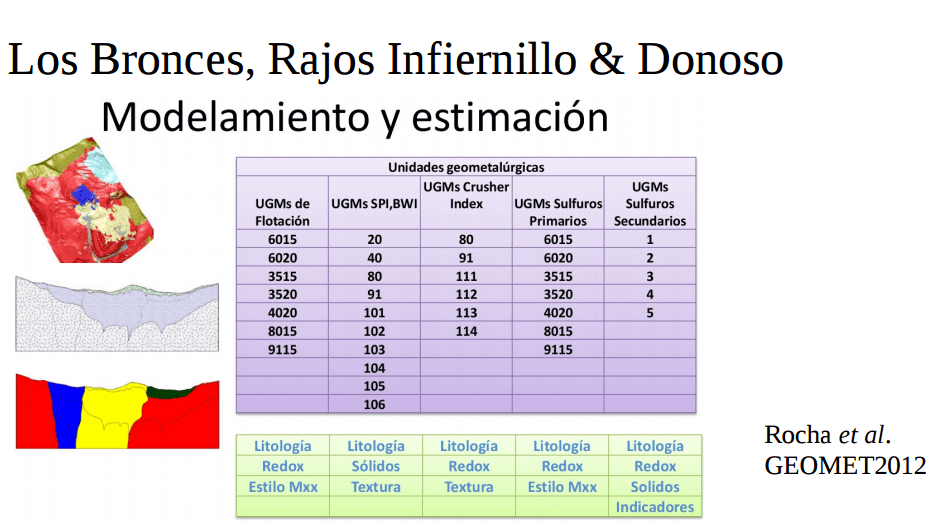
– Rocha, M., Ulloa, C. & Díaz, M. (2012) `Geometallurgical modelling at Los Bronces mine`, Proceedings of the International Seminar on Geometallurgy (GEOMET 2012), eds. Barahona, C., Kuyvenhoven, R. & Pinto, K., Santiago, Chile.
– Suazo, C., Hofmann, A., Aguilar, M., Tay, Y. & Bastidas, G. (2011) `Geometallurgical modelling of the Collahuasi grinding circuit for mining
planning`, Proceedings of the 8th International Mineral Processing Conference, eds. Kracht, W., Kuyvenhoven, R., Lynch-Watson, S. & Montes-Atenas, G., Santiago, Chile. Slide 52 2015-11-12
• References
– Suazo, C., Muñoz, C., & Mora, N. (2013) `The Collahuasi geometallurgical modelling and its application to maximizing value`, Proceedings of the 10th International Mineral Processing Conference, eds. Álvarex, M., Doll, A., Kracht, W. & Kuyvenhoven, R., Santiago, Chile.
– NI43-101 report, Zafranal project
Adanac Moly variogram should be referenced as “Bulled et al, 2007”
The Escondida variograms should be references as “Preece, 2006”
