Table of Contents
- BOND RWi, BWi, CWi, Ai Work Index: What’s the difference
- Relation of Bond ball mill work index and rod mill work index
- Relation of Bond ball mill work index and crushing work index
- Relation of Bond rod mill work index and crushing work index
- Relation of Bond abrasion index versus the work indices
- Commentary on effect of particle size on modelling
- Commentary on relative error in laboratory testing
BOND RWi, BWi, CWi, Ai Work Index: What’s the difference
Three Bond work index tests are commonly used in the industry. This essay discusses some observations from SAGMILLING.COM database of published grindability results about relationships, and lack thereof, between the Bond comminution tests. A further comment is made about the Bond abrasion index and its relation to the three work indices; A Bond Work Index Wiki of sort.
A Commentary on relationships between the three Bond Work Index parameters by Alex Doll, SAGMILLING.COM
alex.doll
DWi
Introduction
The Bond “Third Theory” of grindability modelling includes three laboratory tests conducted at different size ranges and that represent three different classes of “classical” comminution equipment. The three tests are:
- The Bond ball mill work index (WiBM, or BWi) conducted from a feed size of approximately 2 mm to a product size on the order of 100 µm.
- The Bond rod mill work index (WiRM, or RWi) conducted from a feed size of approximately 10 mm to a product size on the order of 1 mm.
- The Bond crushing (impact) work index (WiC, CWi, LEIT or IWi) conducted on specimens of a nominal dimension between 50 mm and 75 mm. The product size is not relevant to this test; it is a determination of the energy to the “first fracture” that substantially breaks the rock.
A fourth index attributed to Bond is the abrasion index (Ai) which is used to predict the quantity of liner and ball wear in classical comminution equipment.
One complication to comparing parameters is a difference in the apparatus used at some laboratories for the rod mill work index. The apparatus specified by Bond is that the rod mill should have a wave liner and be subject to a “rocking” motion to ensure proper mixing of the mill charge during the test.
https://www.911metallurgist.com/ore-hardness-testing-grinding-measurement
Relation of Bond ball mill work index and rod mill work index
The Bond rod mill and ball mill work indices are the most similar in size classes, both being fed material crushed to “relatively fine” sizes. Both test are also locked-cycle tumbling tests where the charge of ore in the mill is brought to a steady state over the duration of a test. Based on these similarities, it is little surprise that the results of the two tests are often similar.
There is a reasonable amount of scatter shown in the data shown in Figure 1, due to a variety of issues including the rod mill apparatus liner issues noted in a future Commentary .
Link to the commentary on the rod mill liners.
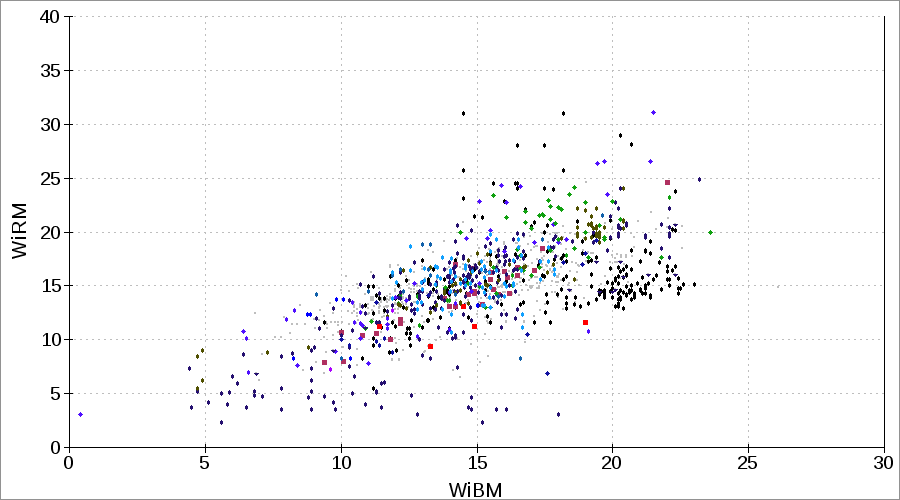
The relationship for any particular mine is typically smaller, as shown in Figure 2.
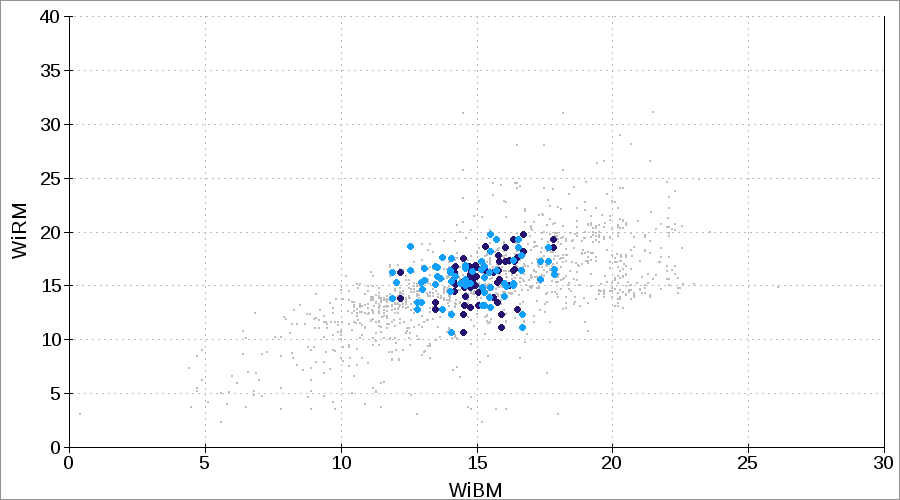
The median Bond ball mill work index and Bond rod mill work index will be similar for most projects, thought significant variation can manifest for any one particular sample.
Relation of Bond ball mill work index and crushing work index
Rarely is there a relationship between the Bond ball mill work index and the Bond crushing (impact) work index. Two reasons for this are:
- The size range over which the two tests are valid (the ball mill test feed is about 2 mm, whereas the crushing test feed sizes are between 50 mm and 75 mm).
- The dominant mechanisms of comminution are very different in the two tests (the crushing test is mostly measuring impact crushing strength of fractures in the rock, whereas the ball mill test is measuring the abrasion strength of the matrix of a rock and the attrition resistance of individual grains within the rock).
Many published works comment that it is common for no relationship to exist in these two parameters (eg. Doll & Barratt, 2009). The cases where there is a relationship in the two parameters is usually limited to rocks with few evident fractures, and where the crushing test is measuring matrix strength rather than fracture strength.
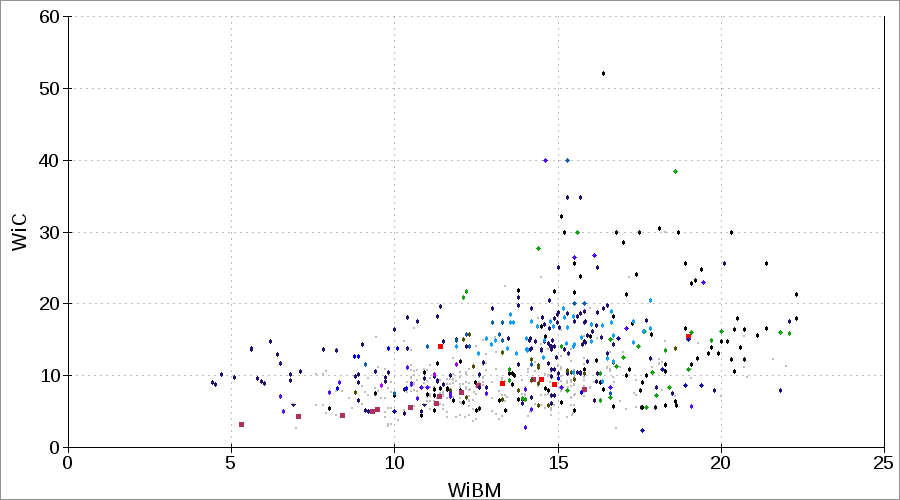
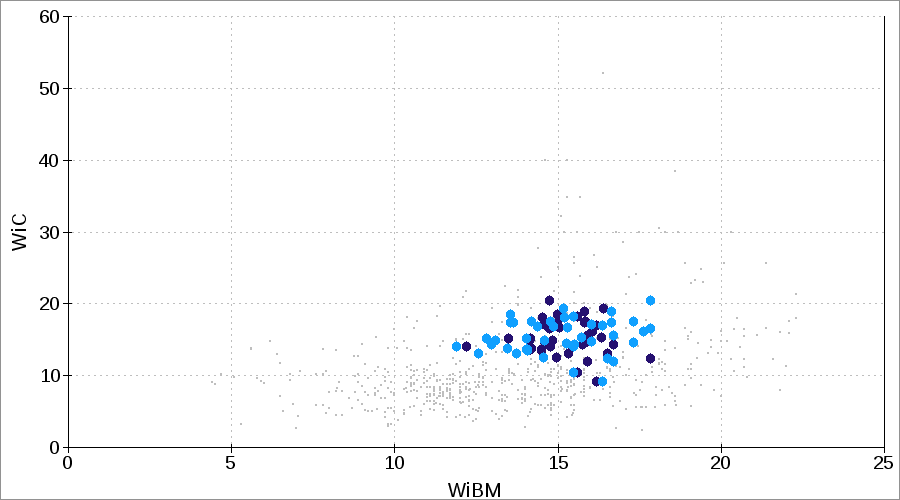
The global database (Figure 3) demonstrates a relatively small number of projects where a high ball mill work index corresponds to a high crushing work index. Most of these are hard ores are believed to be free of fractures. The example of Malartic (Figure 4) shows that it does not have a relation between the two parameters.
Relation of Bond rod mill work index and crushing work index
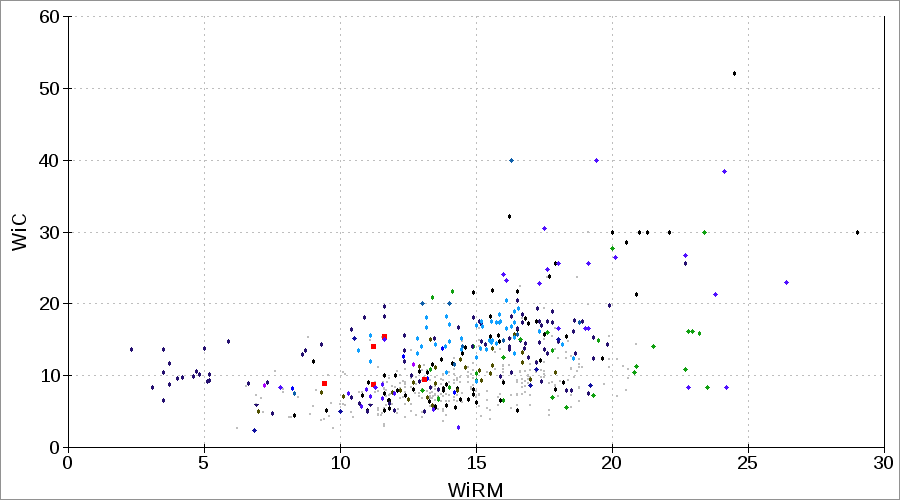
Similar to the ball mill work index, the rod mill work index is a tumbling test that includes both attrition and abrasion breakage mechanisms. Unlike the ball mill work index, the size of the feed to a rod mill test (10 mm–12 mm) is closer to the size of the crushing test.
Plotting the database of global projects shows some relationship (Figure 5), but is still very much ore-dependent. It demonstrates a ball mill work index of 17 can relate to a crushing work index anywhere between 5 and 30.
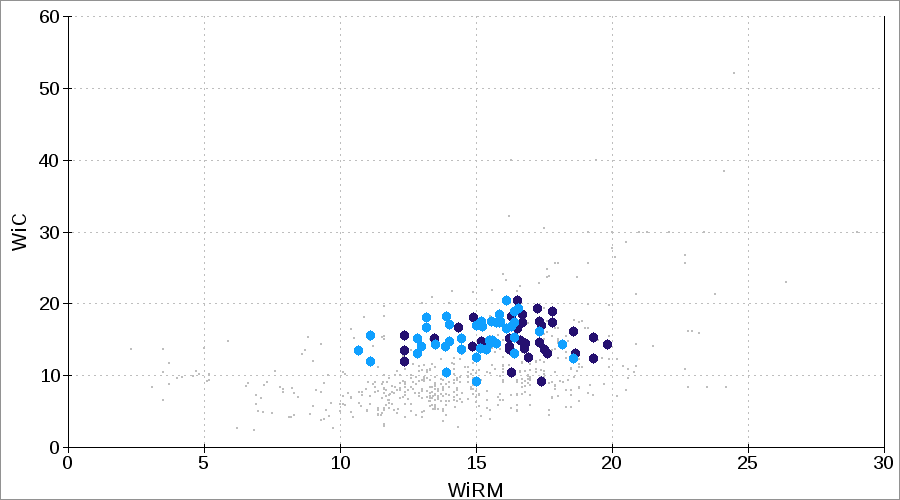
The equivalent plot for Malartic (Figure 6) shows no relationship. The Author’s experience is few projects in the Andes or Western Cordillera have such a relationship (Cerro Verde is one of the exceptions). The only projects with clear relationships tend to be in the Canadian Shield (eg. Dumont) and Australia (eg. KCGM).
Relation of Bond abrasion index versus the work indices
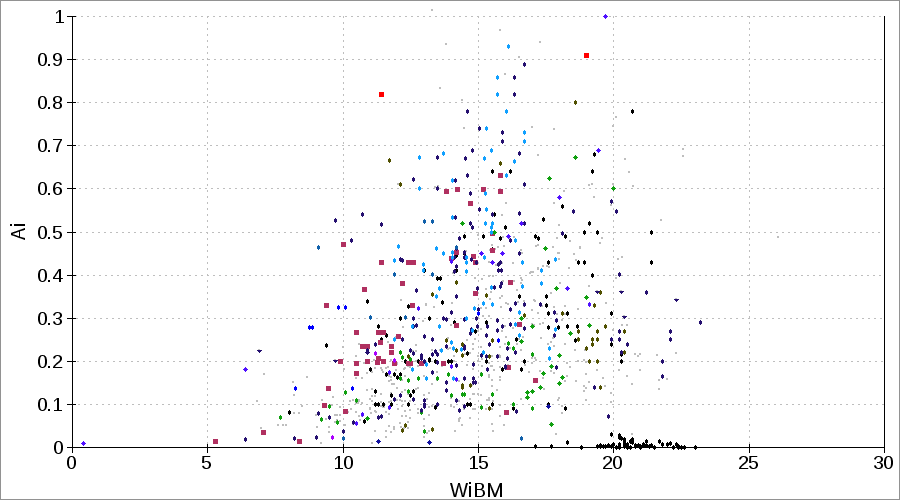
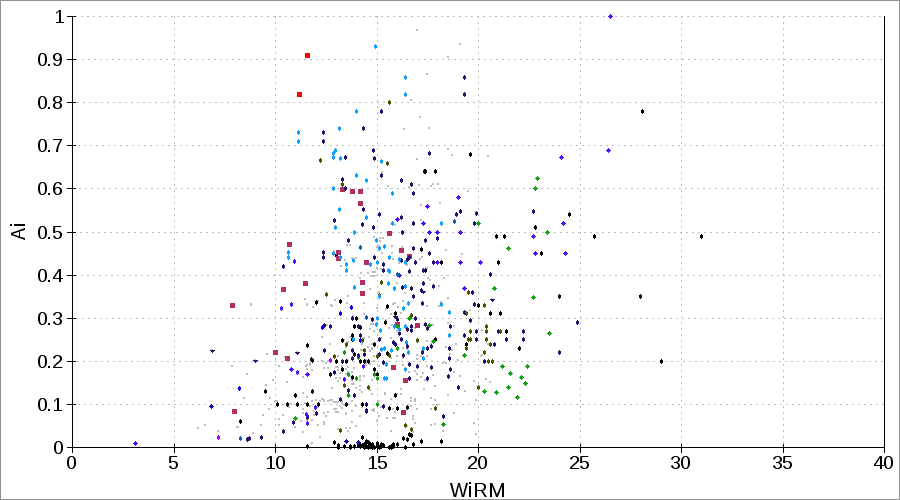
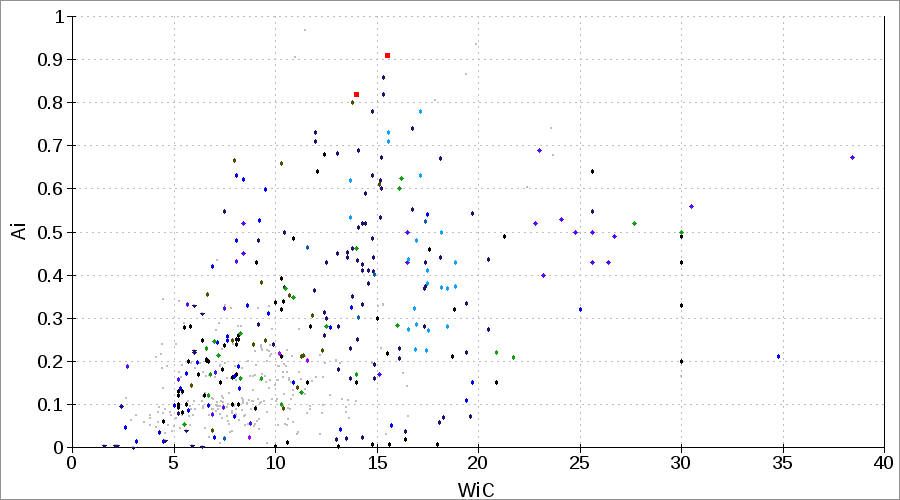
The Bond abrasion index is a crude measurement of the rate at which steel is abraded by contact with a sample of ore. The Author (among other practitioners) believes the abrasion index is dominated more by the mineralogy and shapes of grains within the rocks, and not the compressive or cohesive strength of rocks which dominate in grindability testing. A sample with a large quantity of angular quartz crystals will have a very abrasive Ai result, but the grindability may be low if the quartz is brittle when smacked by a steel ball.
The Author’s opinion is the ball mill work index (Figure 7) is the most likely parameter to show a relationship to the abrasion index because both are measuring rock properties at the size of individual grains within the rock. Coarser measurements (rod mill, Figure 8 and crushing work indices, Figure 9) tend to measure matrix and texture rather than grain properties.
Commentary on effect of particle size on modelling
Work index modelling is based on the assumption that variations in the specific energy consumption of particles will vary with size according to the size to the exponent of –½. Bond commented the derivation of this exponent is largely empirical, though he was able to show that the exponent matches what would be expected of the geometry of a linear crack propagating through a sphere. The dataset that Bond used is based mostly on the ball and rod mill surveys, with a few crushing surveys. It is postulated that the empirical exponent is mostly related to the ball and rod mill surveys, and the crushing tests were “made to fit” a model with this exponent.
Work by Hukki (1962) demonstrated, based on the equation above, a much larger continuum of model exponents across a much larger range of particle sizes (exponent b of zero at “large” sizes, several metres; exponent b of –1 and beyond for fine grinding, below 100 µm). Subsequent work has shown a number of models that fit into Hukki’s structure, including the SGI model of Amelunxen (2014) with an exponent of –0.275 for SAG milling and the signature plot models of Glencore Technologies for their Isamill (exponents between –1 and –3 for sizes down to 5 µm). The Author is purposely ignoring the Morrell Mi model because its boundary condition of fine grinding cannot be met by the model exponent alone, and instead much of the variation by size must be soaked up by the coefficient K.
Commentary on relative error in laboratory testing
There have been many papers published related to duplicate (round-robin type) tests involving different laboratories. One paper by Angove & Dunne (1997) shows large standard deviations in the Bond crushing work index test (25%–50%) and relatively smaller standard deviations in the two tumbling tests (most are around 5%, one outlier point is 11%).
The two tumbling tests, at about 5% error, are pretty typical of the accuracy that the Author has observed. Given that the rod and ball mill test are the most important in circuit design (contributing about 90%–95% of total specific energy consumption in SABC circuit simulations), the accuracy of Bond type models can be no better than ±5%, due solely to measurement error.
The crushing and abrasion tests are less important, and can be thought of as “indicative”, indicating “high” or “low”, but not much else. Consultants use these values in modelling because they are “better than nothing”, and the crushing work index test is certainly better than trying to extrapolate coarse breakage characteristics from a 20 mm sample in a drop weight rig.
References
NI43-101 report (2014) Mine Canadian Malartic, Agnico-Eagle Mines Ltd.
SAGMILLING.COM database of publicly published data.
Doll, A & Barratt, D. (2009) `Case studies on the effect of sample dimensions on comminution testwork results` Procemin 2009, Santiago, Chile.
Angove, J. and Dunne, R. (1997) `A Review of Standard Physical Ore Property Determinations`, World Gold Conference, pp. 139–144, Singapore. http://www.onemine.org
NI43-101 report (2012) `Technical Report on the Dumont Project, Launay and Trécesson Townships, Quebec, Canada`, Royal Nickel Corporation.
Nelson, M., Valery Jr., W. and Morrell, S. (1996) `Performance characteristics and optimisation of the Fimiston (KCGM) SAG mill circuit`, Proceedings of the International Autogenous and Semiautogenous Grinding Technology 1996 Conference, pp. I-233 – I-248, Vancouver, Canada.
Amelunxen, A., Berrios, P. and Rodriguez, R. (2014) `The SAG grindability index test`, Minerals Engineering 55, pp. 42–51, doi:10.1016/j.mineng.2013.08.012
Bond-F-C-1961-Crushing-and-Grinding-Calculations
Anyone wondering how Bond ball mill work index compares versus SPI or JK A*b?
Well, M. Doll says, several comparisons have been published, such as at CMP 2011 and Procemin 2009 and in general, the Wi_BM is not compatible with the other two because they measure different size classes. The Bond ball mill work index measures the grindability in the 2-0.1 mm size classes whereas the SPI (or the generic SGI) measure the 15-2 mm size classes and the A×b measures either the 65-3 mm size classes (JKDWT) or 35-3 mm size classes (SMC).
There is significant overlap between the SGI and A×b size classes, so it is reasonable to compare them. The ball mill work index is different and not generalised. Any comparison must be done on an ore-specific basis.
