Table of Contents
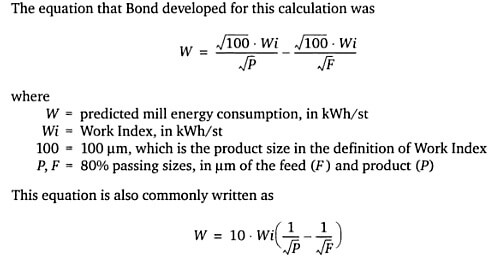
What is the Bond Work Index Formula-Equation? In case you had forgotten, here is a classic:
You can read all the details of this now “Biblical” grinding power requirement calculation formula in Fred Bond’s original paper. You can also review the step-by-step Bond Work Index Test Procedure I posted here.
See this useful summary Table of Bond Work Index by Minerals.
For any circuit, whether a crushing circuit, a rod mill, or a closed ball mill circuit, the Work Index always means the equivalent amount of energy to reduce one ton of the ore from a very large size to 100 um.
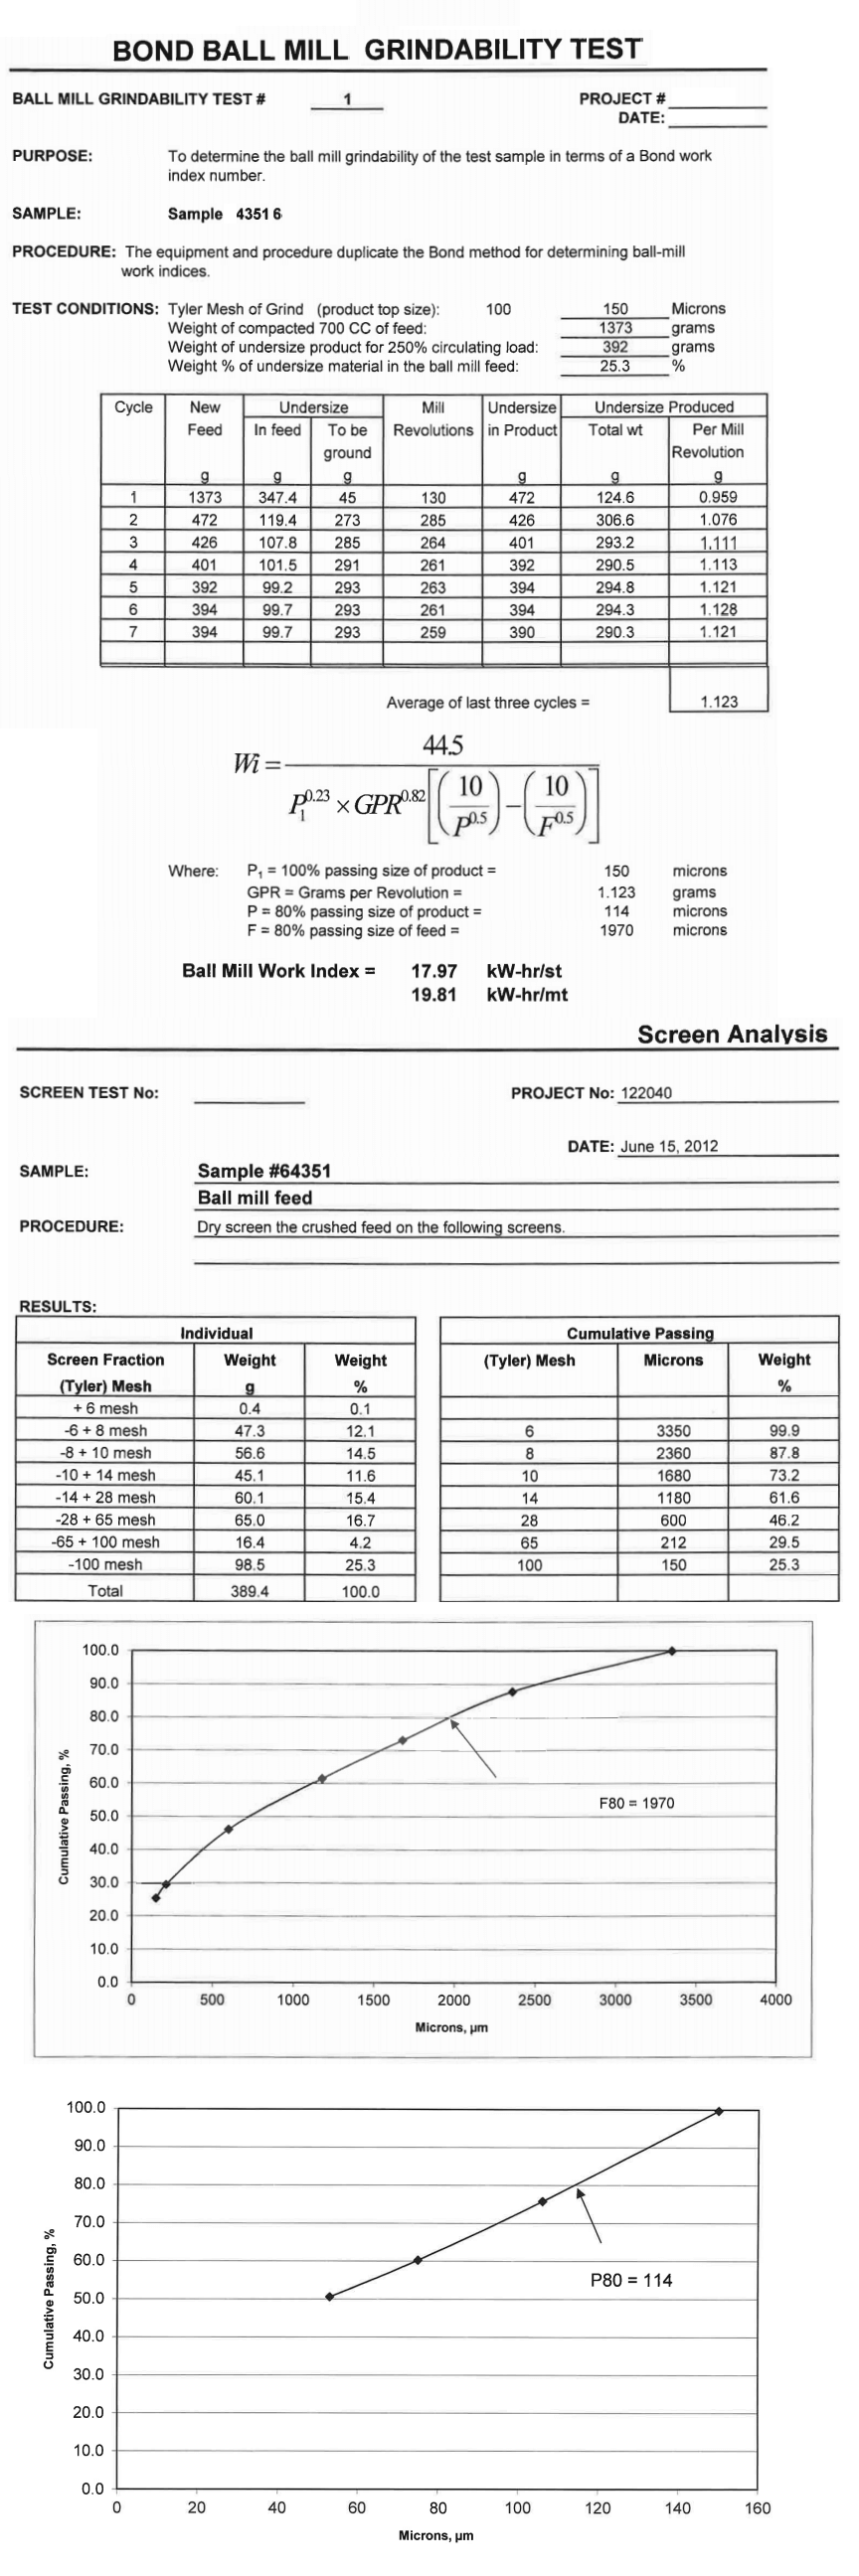
The sample was received crushed appropriately for the ball mill test.
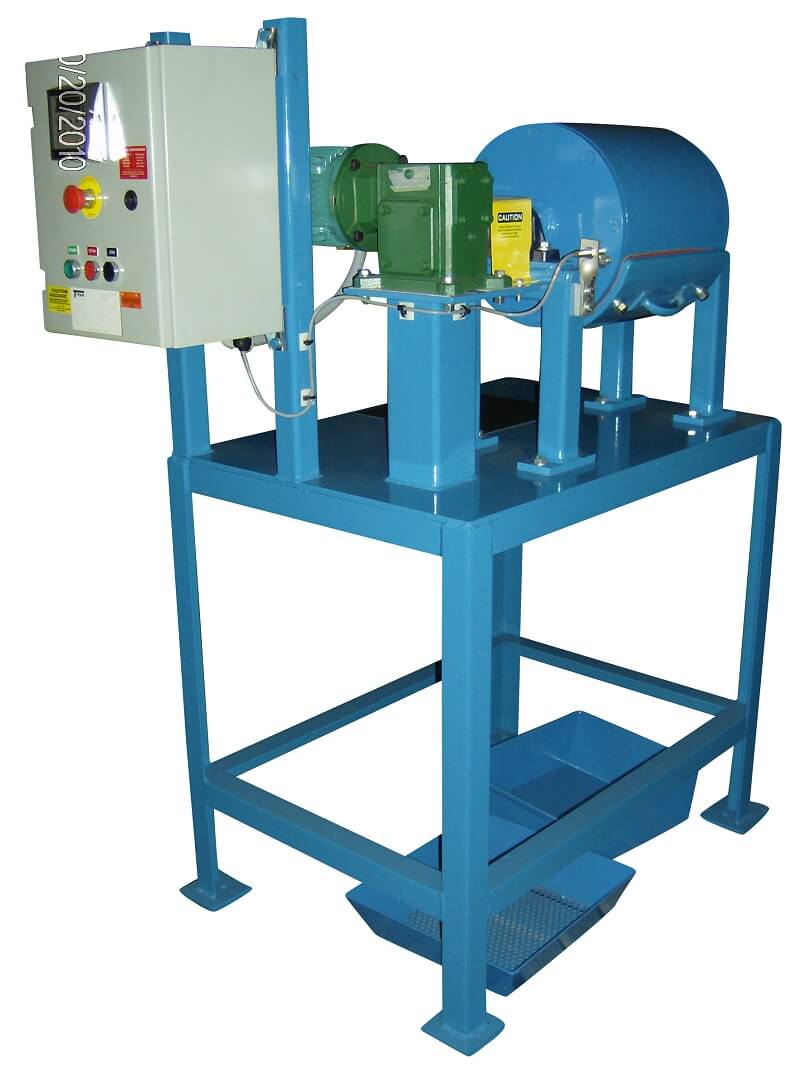
Ball Mill Grindability Test was conducted by standard practice using 100-mesh (150 pm) closing screens. The ball mill work index is shown below.
- BM Wi (kW-hr/st) = 17.97
- BM Wi (kW-hr/mt) = 19.81
Any improvement in the accuracy of commercial comminution calculations under the Third Theory must be accomplished either by increased precision in energy input measurements, or by a better evaluation of the total new crack length produced, as indicated by the feed and product size distributions. Since at the present time feed and product sizes are approximated solely by the microns 80% passes, the most promising opportunity for increased accuracy lies in consideration of their plotted size distribution characteristics. This paper shows how more accuracy can be obtained over an increased range of feed and product sizes from size distribution studies.
Basic Equations
The basic work index equation is:
W = 10 Wi/√P – 10 Wi/√F…………………………………………………………………………(1)
where W is the work input required in kilowatt hours per short ton to grind from 80% passing F microns to 80% passing P microns, and Wi is the work index, or the grinding resistance parameter. It represents the energy input required in kilowatt hours to reduce a short ton from theoretically infinite feed size to 80% passing 100 microns. This simple equation has been extremely useful in analyzing and grinding operations, and in predicting the performance of new installations. It can be written in the following form:
Wi = W/(10/√P – 10√F)…………………………………………………………..(1a)
The work index Wi can be determined from plant operations and from laboratory ball mill grindability, rod mill grindability, and impact crushing tests. The laboratory test results are used to check the efficiency of commercial operations and to compute the proper machine sizes for new installations.
In the standard A-C closed circuit ball mill grindability test the work index is found from

where Pi is the opening in microns of the sieve mesh tested, and Gbp is the net grams of mesh undersize produced per revolution of the 12″ x 12″ test ball mill. The closed circuit 80% passing size P averages P1/log 20 for all sizes larger than 150 mesh. For 150 mesh the average P value is 76 microns, for 200 mesh it is 50, for 270 mesh it is 32.3, and for 325 mesh it is 26.7. These average values can be used when P cannot be determined from screen analyses.
In the A-C rod mill grindability test

where Grp is the net grams of mesh undersize per revolution of the 12″ x 24″ test rod mill.
In the A-C impact crushing test
Wi = 2.59C/Sg……………………………………………………………………….(4)
where Sg is the specific gravity and C is the impact crushing strength of the twin pendulum weights in foot-pounds per inch of rock thickness. No size distribution measurements are made in the impact test.
Size Distribution and Exposure Ratio
The trend of the particle size distribution line is shown by plotting its screen analysis in, such a manner that a complete homogeneous crushed or ground product will form a straight line; any curvature then indicates a natural or induced grain size. Semi-log paper is used with the percent cumulative retained plotted on the vertical logarithmic scale Y. Straight lines which each represent one mesh sieve size of P1 microns are drawn radiating from the upper left hand corner of the plot; each crosses the 20% retained, or 80% passing, line at w = 10/√P1 where w is the horizontal lineal X value at Y = 20. The total work input to the sample in KWH/ton divided by the work index Wi is w. The straight plotted distribution line follows the exponential equation:
AX = log b – log Y………………………………………………………………………………….(5)
where b is the Y intercept of the extended line, and A is the negative slope. The 80% passing size P is 100/w² microns.
The exposure ratio Er is the quantity that expresses the line trend, or the fine size distribution. Er equals X2/W where X2 is the value of x at the top of the chart with Y = 100%. It has the following relationship to b.
log b = 2 – 1.301 Er/1 – Er…………………………………………………………….(6)
When the exposure ratio Er is zero only one particle size is present and there has been no exposure of fines to the grinding media. The fines present increase as Er increases, and when Er is unity b is infinite.
When natural or induced grain sizes cause the plotted distribution line to curve in the region of 80% passing, the straight line determining Er is drawn through w at the average slope from Y = 10 to Y = 40, or is estimated to avoid the curvature. The exposure, ratio of the feed is Erf and that of the product is Erp.
It is apparent that the specific work input required, as represented by the new crack length Cr produced in centimeters per cc of solid (Crp – Crf), will be decreased at large product sizes and will increase at fine product sizes when Crf and Erf are increased. In this case the work index Wi will increase as the product size P becomes smaller. Conversely, when the feed contains little fines and Erf and Crf are small, the work index will increase as P increases. These conditions are largely responsible for the observed work index variations at different product sizes which were formerly thought to require an exponent different from ½.
Equations for Work Index Variations
In a recent publication fifteen different ores each had grindability tests made at 28, 35, 48, 65 and 100 mesh, with many work index variations at the different product sizes. These tests are used here to develop empirical equations from which the work index at different product sizes can be computed from a grindability test at one size. In each of the 15 ores the data from the grindability test at 48 mesh alone were used to calculate the Wi values at 28, 35, 65, and 100 mesh, and these were compared with the actual values obtained by testing. In the calculation the exposure ratio Erp of each mesh product size was considered to be that determined by testing at 48 mesh, and Crp was determined from that value and the average P for each mesh size.
The work index should theoretically be proportional to (Crp – Crf) √P/Yn where Y is the percent weight of the feed retained on the mesh size tested. From this relationship
Wi = K (Crp – Crf) √P/Y 1.67……………………………………………………………..(7)
the exponent n was determined empirically to be 1.67, or 5/3, and K is the proportionality constant for each ore.
However, an equation is desired which uses the exposure ratios and does not require calculation of the crack lengths, Eq. (8) was derived to give the work index Wi at any 80% passing product size P from the work index Wio found from a single grindability test with a product size Po and exposure ratios Erf and Erp. It is
Wi = Wio + (P – Po) (.018 – .014 Erf/Erp)…………………………………………………..(8)
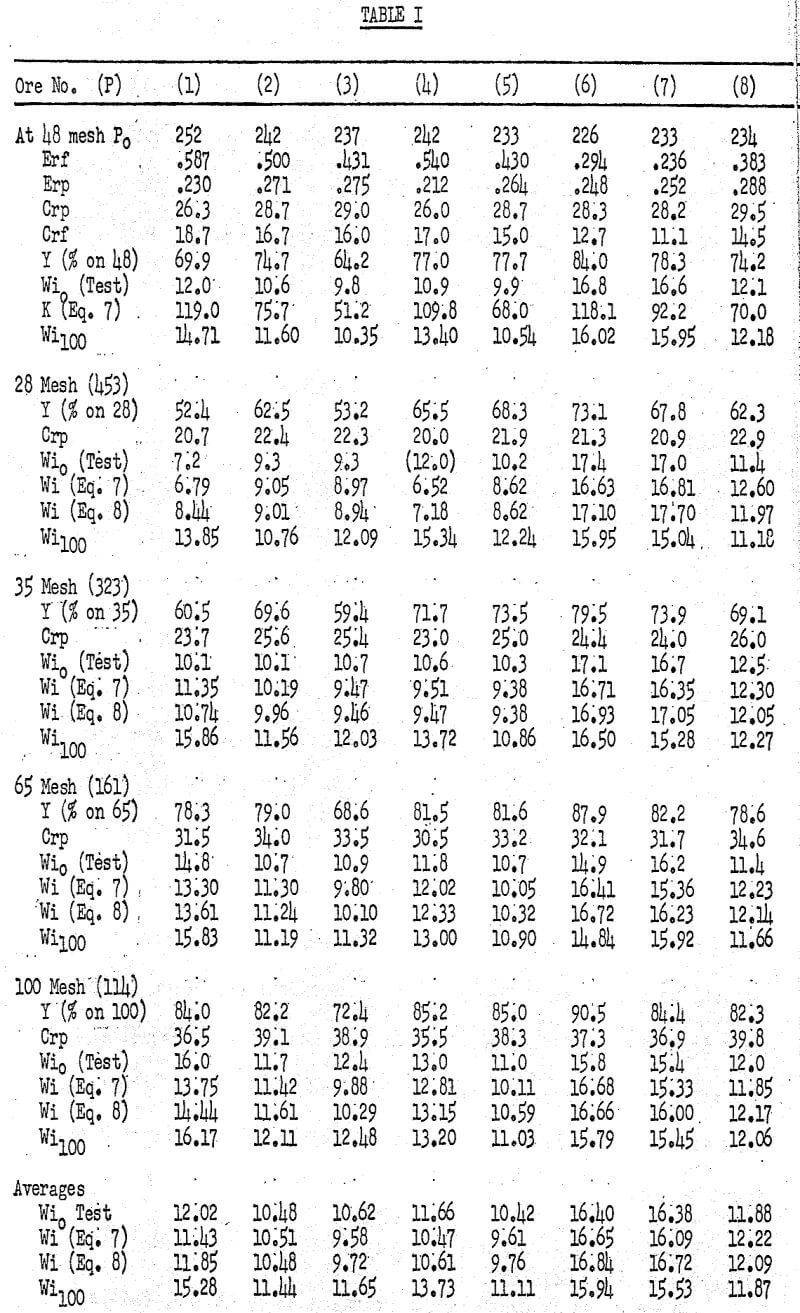
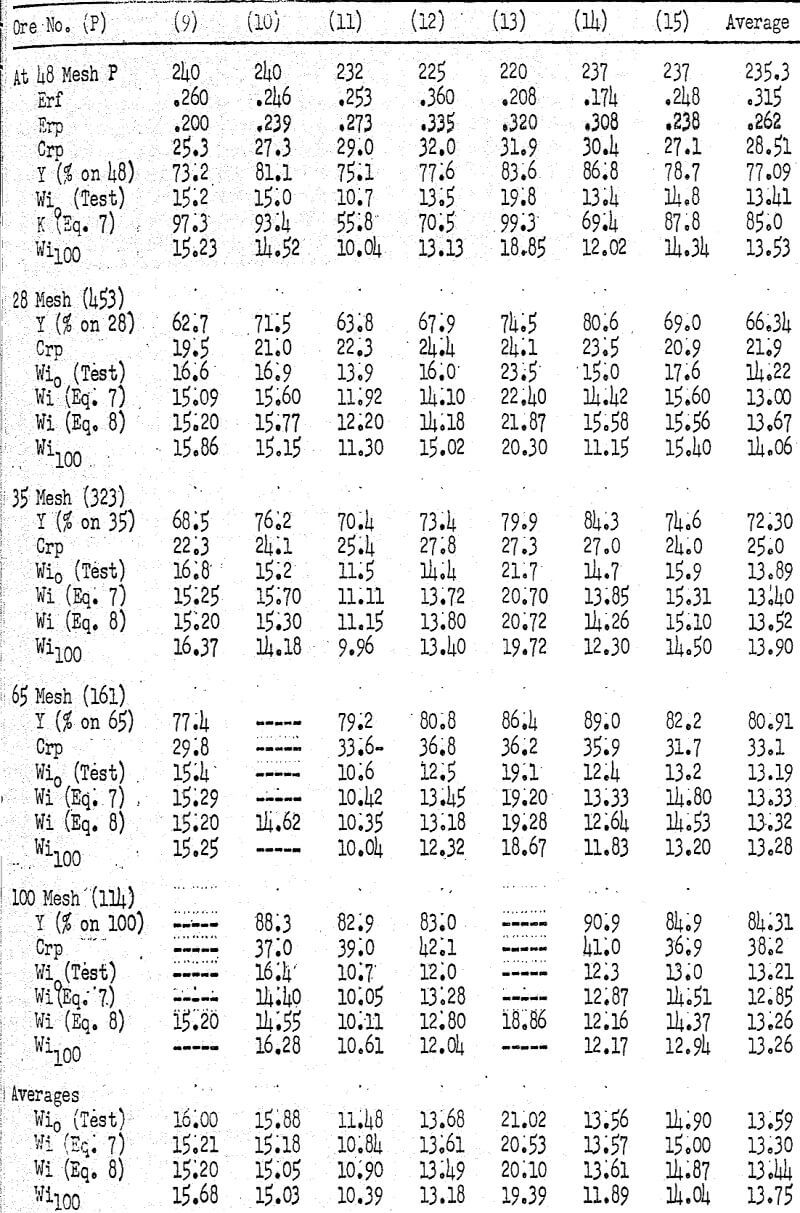
The work index values calculated from Eq. (7) and Eq. (8) are listed in Table I. Comparison with the actual Wi values shows that Eq. (8) is slightly more accurate than Eq. (7), and it is much simpler to use. Eq. (8) is suitable for determining the work index at various product sizes from one ball mill grindability test made at product size Po. It can be checked by grindability tests made at other product sizes.
The exposure ratio of the prepared minus 6 mesh feed Erf is regularly somewhat larger than that of the closed circuit product Erp, and Eq. (8) indicates that when Erf/Erp equals 1.29 the work index continues constant at all product sizes. When Erf/Erp is greater than 1.29, the work index increases as the product size decreases, and when Erf/Erp is less than 1.29 the work index decreases.
Eq. (8) suggests that a standard work index Wi100, or the work index at 80% passing 100 microns calculated from the exposure ratios, can be found from the following Eq. (9):
Wi100 = Wi0 + (100 – Po) (.018 – .014 Erf/Erp)…………………………………………………(9)
Then the work index Wip at any 80% passing size P can be found from
Wip = Wi100 + (p – 100) (.018 – .014 Erf/Erp)………………………………………………………(10)
When Wi100 is calculated by Eq. (9) from the data at 48 mesh for each of the 15 ores listed, then Wip found by Eq. (10) for each of these ores at 28, 35, 65, and 100 mesh is essentially the same as the Wi value found from Eq. (8).
Comparison of the Wi100 values from Eq. (9) for different ores furnishes a measure of the relative grindability unaffected by size distribution differences; and comparison of the Wi100 values for the same ore calculated from the data at different mesh sizes gives a measure of the actual experimental errors involved in testing, plus any error in measuring the plotted Er values, and any error resulting from natural grain sizes causing curved plotted lines.
The standard work index Wi100 values calculated from Eq. (9) for each ore at each mesh size are included in Table I. Comparison for each ore shows a reasonable agreement among the tests made at various mesh sizes, and indicates that Eq. (9) and Eq. (10) can be used with confidence. The data show that the ball mill grindability tests at 28 mesh are somewhat less accurate than the others; this is expected because of the low ratio of reduction and the short retention time in the mill, when grinding prepared minus 6 mesh feed.
The work index values from rod mill grindability tests are corrected for exposure ratio variations to 80% passing 1000 microns by the following equation:
Wi1000 = WiP + (1000 – P)(.0060 – .0055 Erf/Erp)……………………………………………………..(11)
and the rod mill grindability work index at any product size P is found from:
Wip = Wi1000 – (1000 – P)(.0060 – .0055 Erf/Erp)…………………………………………………………(12)
When Wip and WiF have been calculated for the desired ball or rod mill product size P and feed size F the following modified form of Eq. (1) is used to obtain the accurate work input required:

Work Index and Crack Energy
The specific crack length Cr100 in centimeters per cc of solid for any material ground to 80% passing 100 microns with an exposure ratio Er is found from:
Cr100 = log (Er + 0.28) + 0.77/0.0125……………………………………………………(14)
Since joules (watt – seconds) per gram equals 3.97 times kWh/ short ton, the crack energy Ce in joules per centimeter is found from:
Ce = 3.97 Wi100 Sg/Cr100……………………………………………………………….(15)
where Sg is the specific gravity.
Combining Eq. (14) and Eq. (15) gives the following equation for calculating the crack energy in joules per centimeter directly from the standard work index and product exposure ratio:
Ce = .0496 Wi100 Sg/log (Erp + 0.28) + 0.77…………………………………………………….(16)
From Eq. (16) and Table I, the ores tested (with an average specific gravity of 2.86) have an average crack energy of 4.0 joules per centimeter.
Since the work input varies as the crack length, or as the square root of the surface area, surface areas should not be used in computing the work required for varying amounts of material.
The total crack length Cr in centimeters per cubic centimeter of solids is most conveniently found from log-log charts prepared from a previously published table. However, in the absence of these chart the crack length of a crushed or ground product can be calculated for any 80% passing size P in microns and any exposure ratio Er by the following equation:

A somewhat simpler equation is given below for use between the following limits; 20< P< 50,000 microns, and 0.1<Er<0.8. Outside of these limits the Cr values will be high.

In the standard ball mill and rod mill grindability tests the specific crack lengths of the product Crp and of the feed Crf are found from their Erp, P, Erf, and F values. Where Y is the cumulative fraction of the feed retained on the mesh size tested the centimeters of new crack length produced per mill revolution are found from:

The average useful work input to the standard ball mill is 65 joules/Rev. with 115 joules/Rev. to the rod mill. The crack energy Ce of the sample tested is found by dividing joules/Rev. by Cm/Rev. The standard work index can then be found by transposing Eq. (16) and solving for Wi100.
In commercial grinding mills the operating work index is found by Eq. (19). However, when exposure ratios of the feed and product are obtained by plotting the screen analyses, their specific crack lengths Crf and Crp can be found. This furnishes the crack energy Ce in joules/Cm from:
Ce = 3.97 W Sg / (Crp – Crf)………………………………………………………………………….(20)
The standard work index Wi100 can then be found from transposed Eq. (16). Comparison with the plant operating work index at product size P may show that the coefficients .018 and .014 in the last term of Eq. (9) should be altered slightly for the commercial grind. With the proper coefficients Eq. (9) can be used to evaluate the plant grinding operation at different product sizes with considerable accuracy.
