Table of Contents
Chemical and electrochemical leaching processes using chloride solutions (FeCl3, HCl, CuCl2) and dry chlorination with Cl2 gas followed by leaching of the resultant chlorides are some of the methods considered for treating fine-grained Zn-Pb-Cu-Fe sulphide ores and concentrates. These processes eventually result in an impure zinc chloride liquor which, after purification using either solvent extraction (SX) or conventional zinc dust cementation, could yield a chloride electrolyte suitable for zinc electrolysis. Although SX technology also offers the possibility of converting the zinc chloride electrolyte to the sulphate system from which zinc could be recovered by conventional electrowinning, direct electrolysis of zinc chloride has the potential advantage that the chlorine gas generated at the anodes could be recycled to the dry chlorination step or used to regenerate the aqueous leaching medium.
The objective of the present work was to determine the feasibility of electrowinning smooth, compact, dendrite-free zinc deposits from aqueous zinc chloride electrolyte at current efficiencies and deposition times, comparable to those of the present industrial zinc sulphate system.
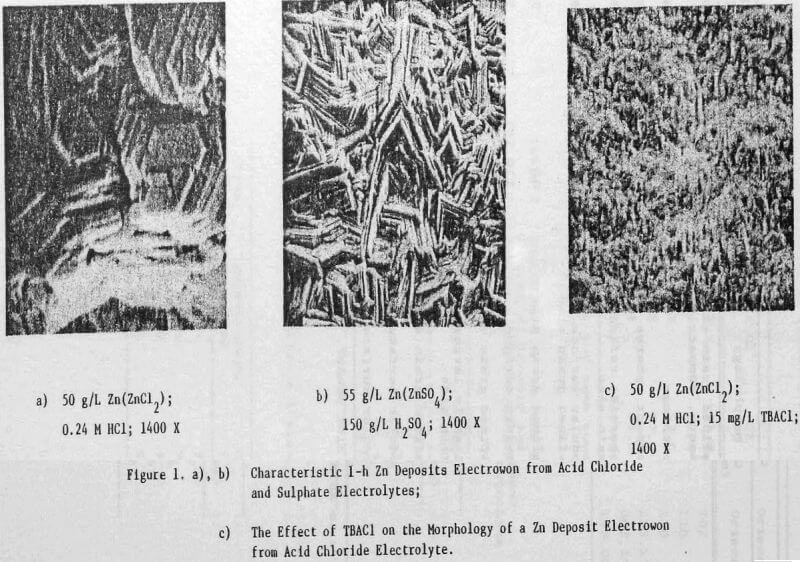
In a previous study, a characteristic 1-h zinc deposit structure was defined for acid chloride electrolyte. The effect of addition agents and various -metallic impurities on this deposit structure was also briefly examined. The characteristic morphology for 1-h zinc deposits obtained from acid zinc chloride electrolyte is shown in Figure 1 where it is compared to the corresponding deposit structure obtained from purified, addition free acid sulphate electrolyte. The deposit from acid chloride electrolyte (Fig. 1(a)) consists of hexagonal zinc platelets, aligned parallel to the Al substrate, resulting in a predominantly [002] orientation. The deposits obtained from acid sulphate electrolyte (Fig. 1(b)) consists of well-defined hexagonal platelets aligned at intermediate angles to the Al substrate, resulting in a predominantly [112] oriented deposit. The addition of 45 mg/L tetra-butylammonium chloride (TBACl) to the acid zinc chloride electrolyte had a strong influence on the morphology of the 1-h zinc deposit (Fig. 1(c)), causing a substantial reduction in the deposit grain size and a change in deposit orientation from [002] to [110] .
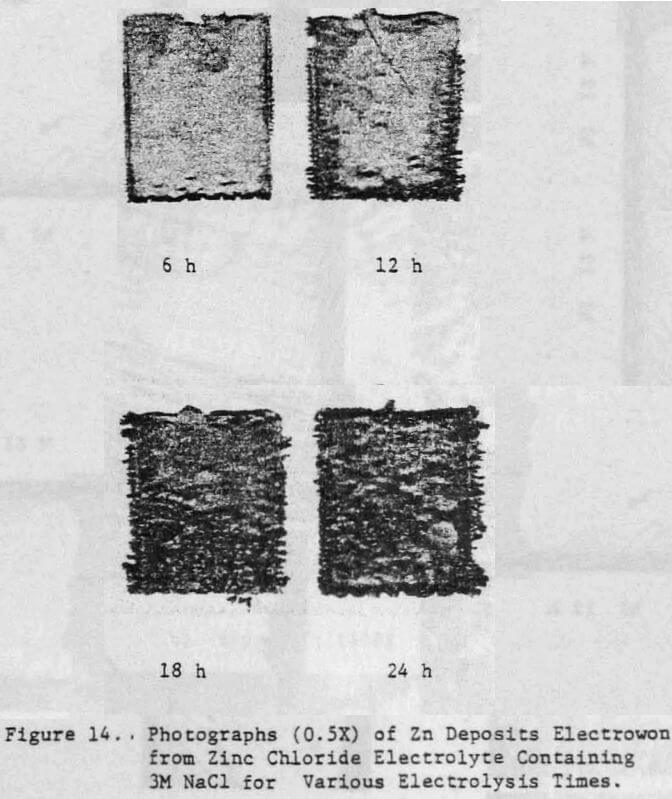
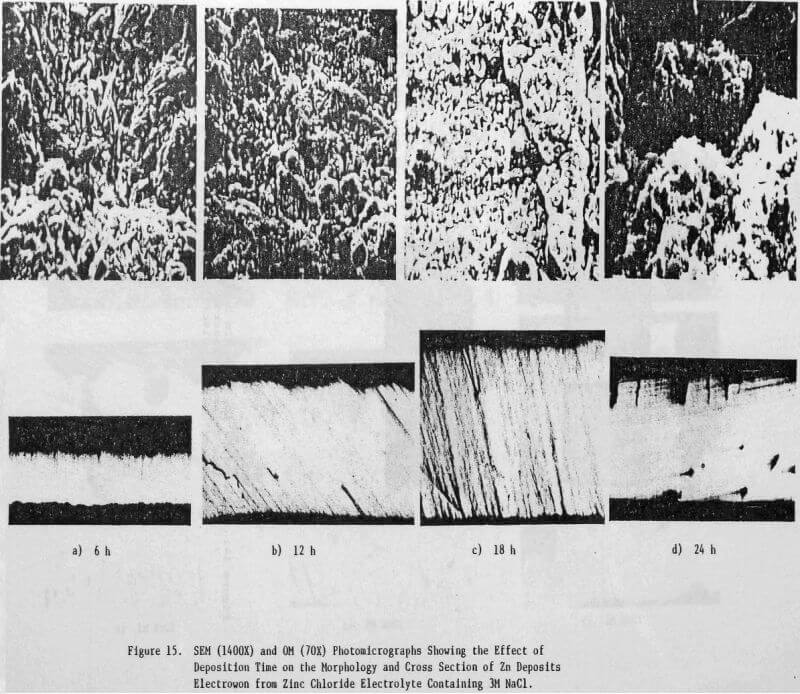
The present paper, which is an extension of the above work on 1-h deposits, describes the results obtained for the electrowinning of 24-h zinc deposits from aqueous chloride electrolyte. Initial attempts to increase the deposition time from 1 to 24-h resulted in the formation of black, powdery zinc deposits; powder formation began to occur after about 6 h. In order to eliminate powder formation, modifications were made both to the electrolysis cell and to the electrolyte composition. Details of the cell design, experimental conditions and the effects of solution composition, current density, addition agents and metallic impurities on the quality and structure of the 24-h zinc deposits and on current efficiency of zinc deposition are also presented.
Electrolysis Cell
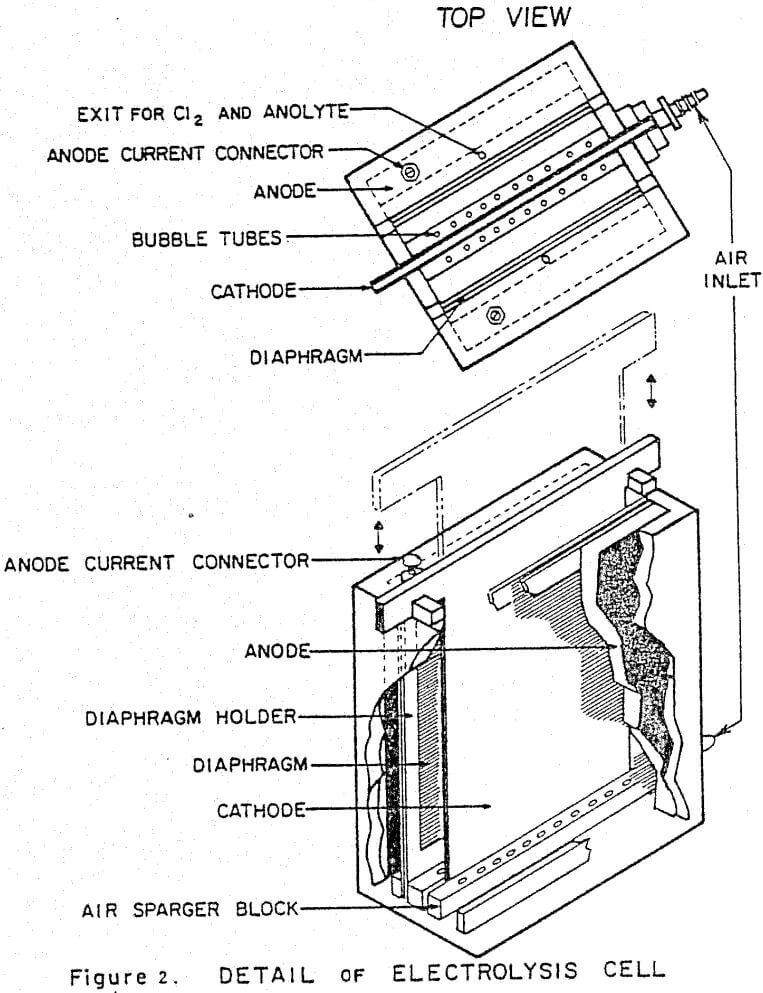
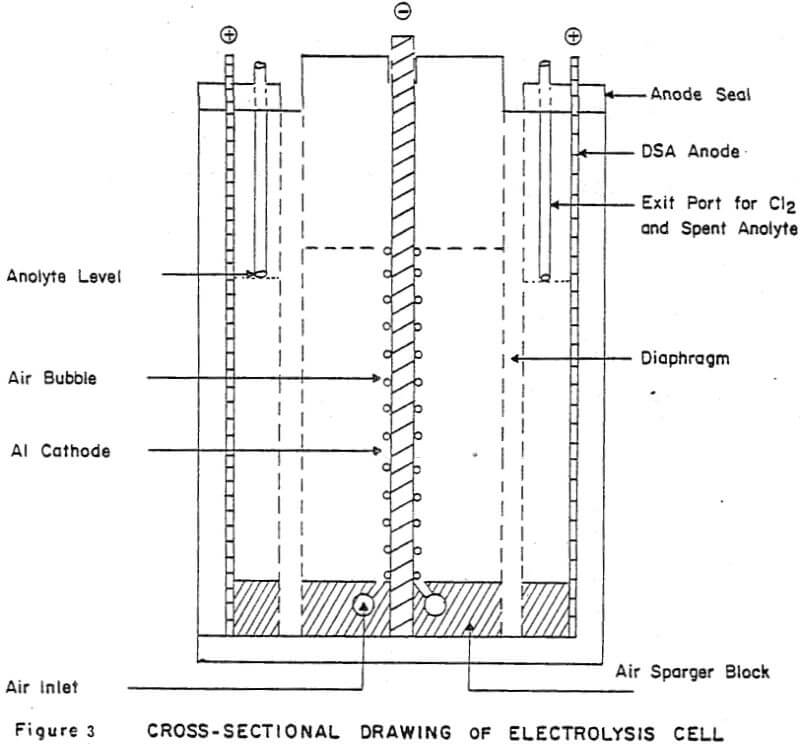
Details of the cell design and construction are shown in Figures 2 and 3. The cell was constructed from 0.6 cm polycarbonate sheet and had the overall dimensions: 8.4 cm long x 7.9 cm wide x 12.4 cm high. The cell consisted of three compartments: two anode compartments which were separated from a central cathode compartment by Dynel cloth diaphragms. The anode compartments were sealed to the atmosphere and the chlorine gas and spent anolyte were withdrawn via glass tubes inserted through the anode seals (Fig. 3). The cathode compartment was open to the atmosphere so that the cathode could be easily removed from the cell to strip the zinc deposit.
Vigorous agitation of the electrolyte at the cathode surface was achieved by sparging moist air from the bottom of the cell. The air sparger was constructed from a plexiglass block 8.2 cm long x 7.9 cm wide x 1.1 cm high. A 0.2 cm slot was cut in the center of the block along its entire width (7.9 cm) to position the aluminum cathode. A 0.4 cm diameter air conduit was drilled on each side of the slot. Air bubbler holes 0.07 cm diameter, spaced at 0.6 cm intervals were drilled along the length of the air conduits at 17° angle to the cathode. The air sparger block also contained two 0.4 cm slots to accommodate the diaphragms and the anodes were fixed in the 0.1 cm spaces between the ends of the air sparger block and the cell walls. (The length of the air sparger block could be shortened to accommodate thicker anodes).
Dynel cloth diaphragms were used to separate the cathode and anode compartments. The cloth was sandwiched between two 0.1 cm thick plexiglass windows (see Fig. 2). The total assemblage was 0.4 cm thick and was pressure-fitted into slots in the cell walls and fixed at the bottom of the cell by the slots cut in the air sparger block.
Cathodes were cut from 0.4 cm commercial aluminum. An area of 25.3 cm² was masked off on each side of the cathode, using electroplating tape (total surface area =50.6 cm²). The tape also covered the sides of the cathode to minimize edge- build-up and to facilitate stripping of the zinc deposit. In addition to being fixed at the bottom by the slot in the air sparger block, the cathode was held in place at the top of the cell by 0.4 cm slots cut into the top of the side walls.
Initially the anodes were fabricated from high purity, high density graphite blocks. Electrical contact was made by tapping a 0.3 cm aluminum bolt through the anode seal into the graphite. However, after several experiments, loose graphite particles were noticed in the anode compartments. Subsequent experiments were done using 0.1 cm thick dimensionally stable anodes (DSA). These anodes extended through a slot in the anode seal and electrical contacts were bolted to the exposed tops of the anodes. Current to the cell was provided by a d.c. rectifier (6/30 Amp; 0-25 volts). The cumulative ampere-hours (total coulombs) were recorded using an ampere-time meter.
Electrolyte and Additives
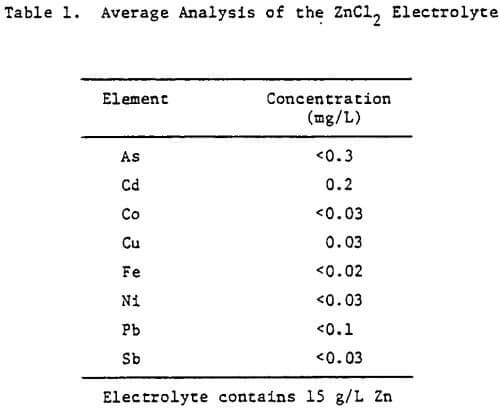
The electrolyte was prepared from reagent grade zinc chloride (ZnCl2) and had the average analysis shown in Table 1. For some tests, the total chloride ion concentration was varied to 4 M by the addition of NaCl. The additives studied included HCl, animal glue, tetrabutyl- ammonium chloride (TBACl), Separan NP10 and Percol 140. They were added to both the cell and feed solutions as aliquots from their respective aqueous solutions.
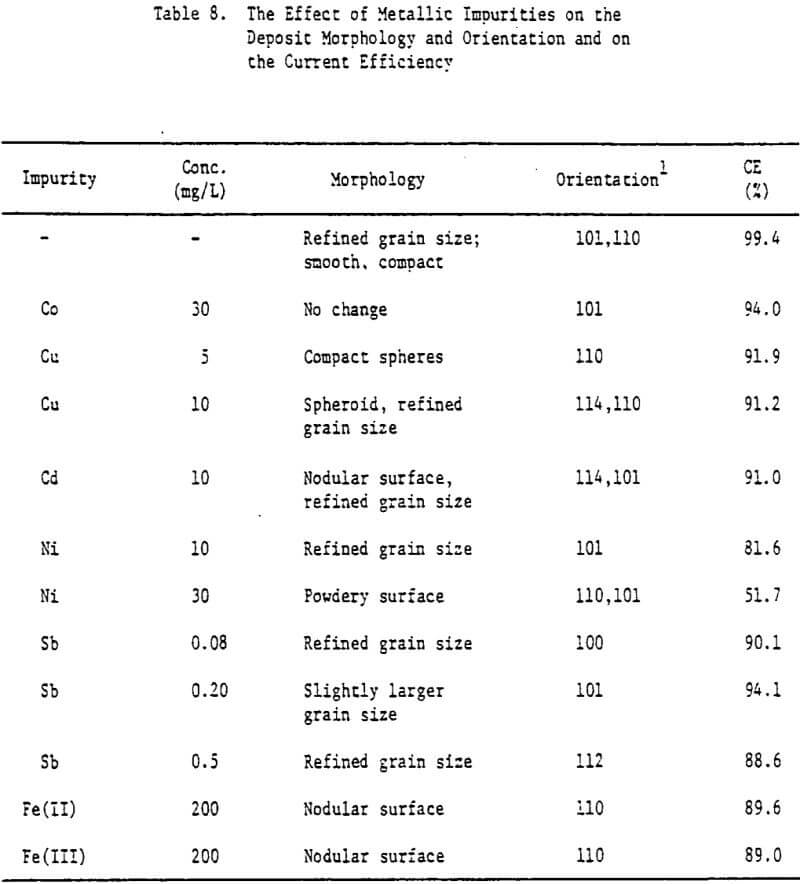
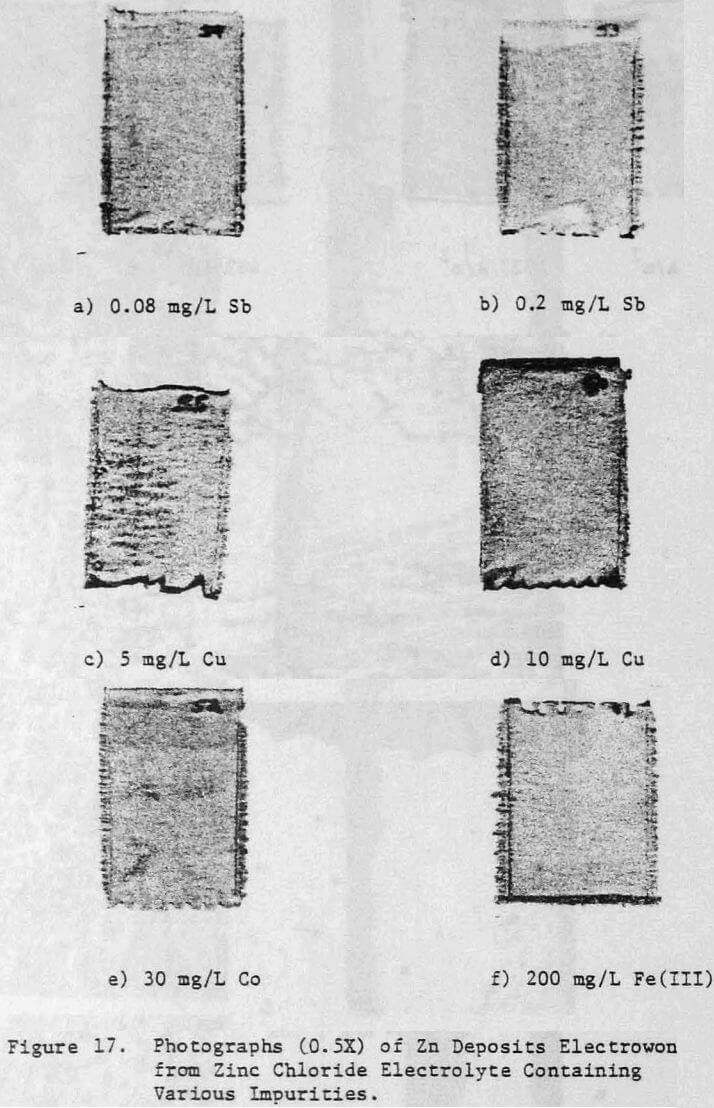
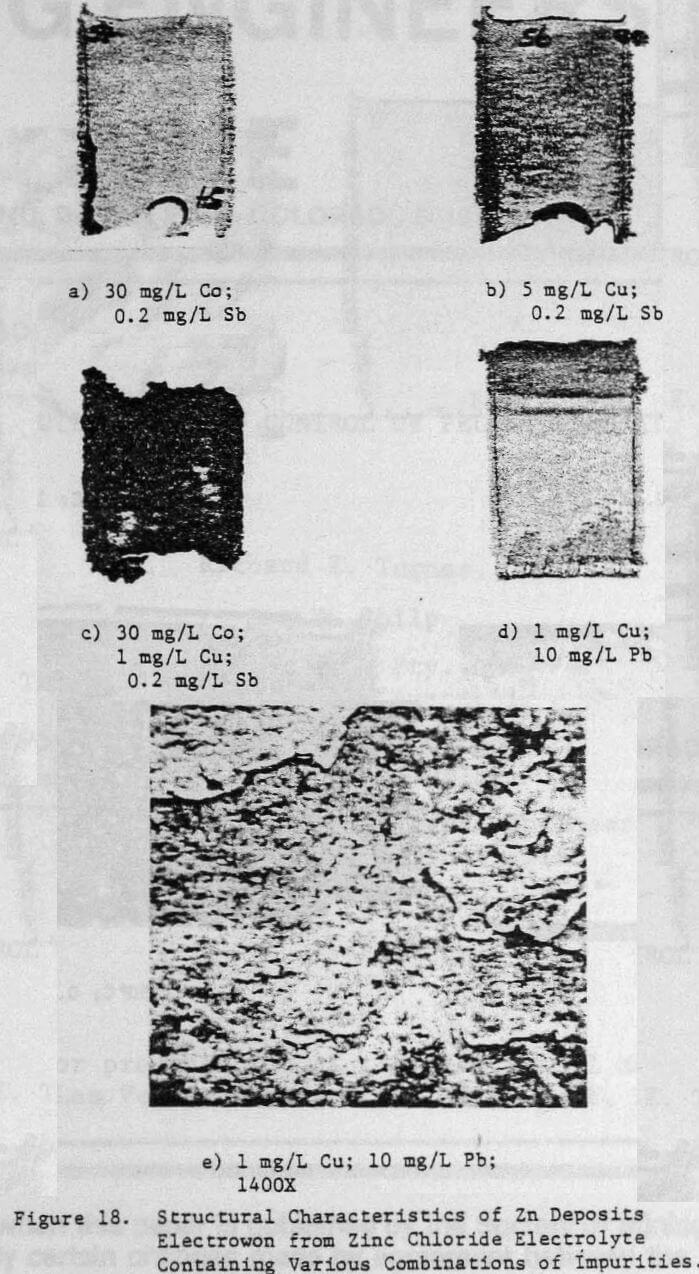
Various metallic cations were also added to the electrolyte in order to assess their effect on the zinc deposit structure and quality. The Impurities Cu, Co, Cd, Fe(II) , Fe(III) and Ni were added to the electrolyte as aliquots from stock solutions prepared from their respective chloride salts. Antimony additions were made as a potassium antimony tartrate solution and lead was added as a lead acetate solution.
Test Procedure
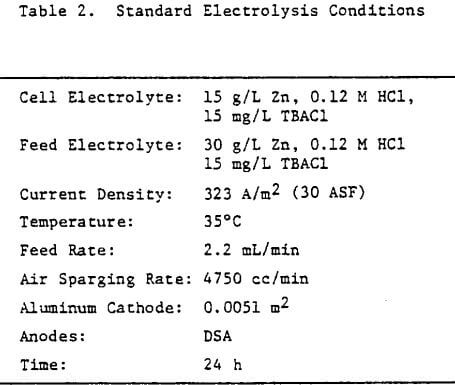
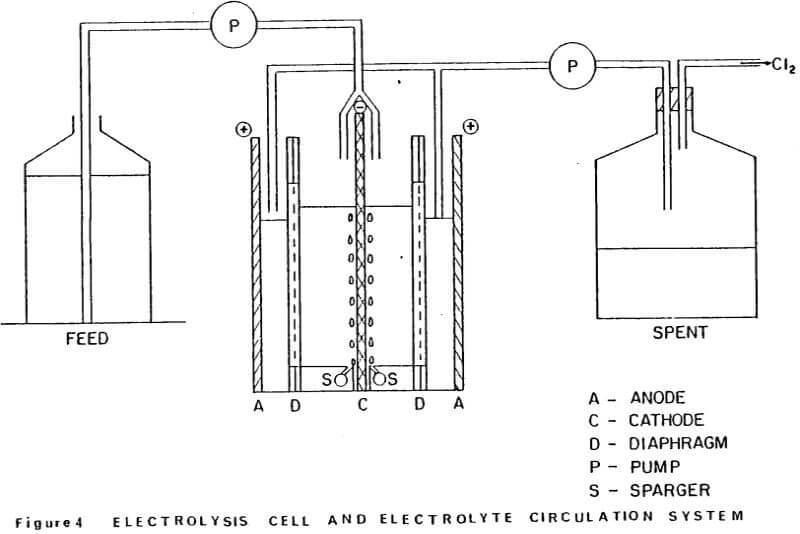
The electrolysis cell and electrolyte circulation system was set-up as shown schematically in Figure 4. The cell electrolyte contained 15 g/L Zn and was maintained at 35°C, using a thermister controller and small immersion heater located in the cathode compartment of the cell. Feed solution containing 30 g/L Zn was supplied to each side of the cathode (see Fig. 4) at a rate of 2.2 mL/min, using a tubing pump. This feed rate was sufficient to maintain the Zn concentration in the cell at 15 g/L over the duration of the electrolysis.
A constant head of solution was maintained in the cathode compartment by withdrawing solution and Cl2 from the anode compartments from below the catholyte level as indicated in Figure 4. Moist air was continuously sparged over the cathode faces at a rate of -5L/min, via the manifold at the base of the cathode.
Prior to use for the first time, the exposed faces of the aluminum cathode were hand-polished, using 600-grit polishing paper. At the end of the electrolysis period, the cathode was pulled from the cell, and the zinc deposit was water rinsed, stripped, dried and weighed. The surface of the stripped cathode was also water rinsed and dried; no additional surface treatment was necessary before it was used in subsequent tests. Samples of anolyte and catholyte were analysed for Zn, free acid and total Cl after each test.
Electrolysis Conditions
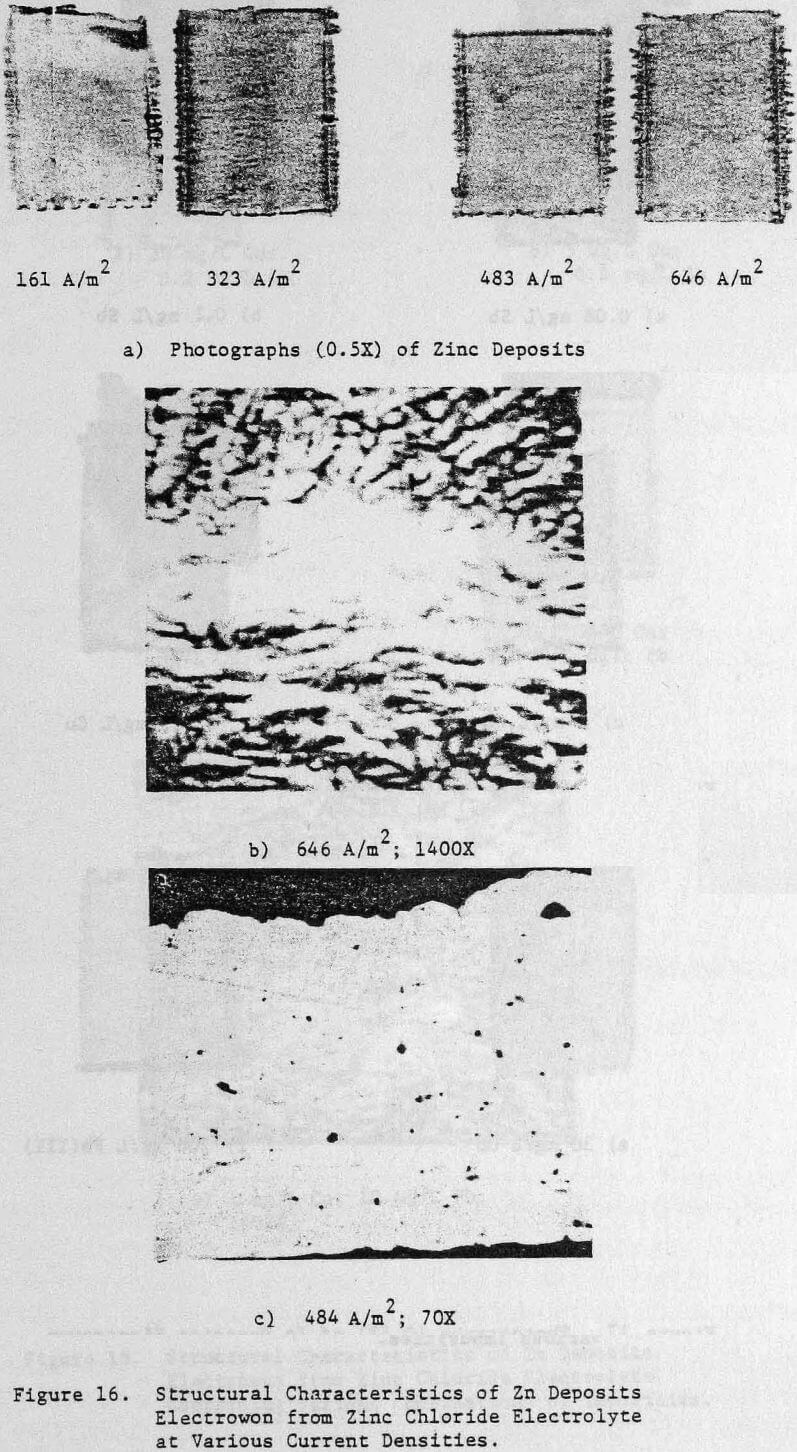
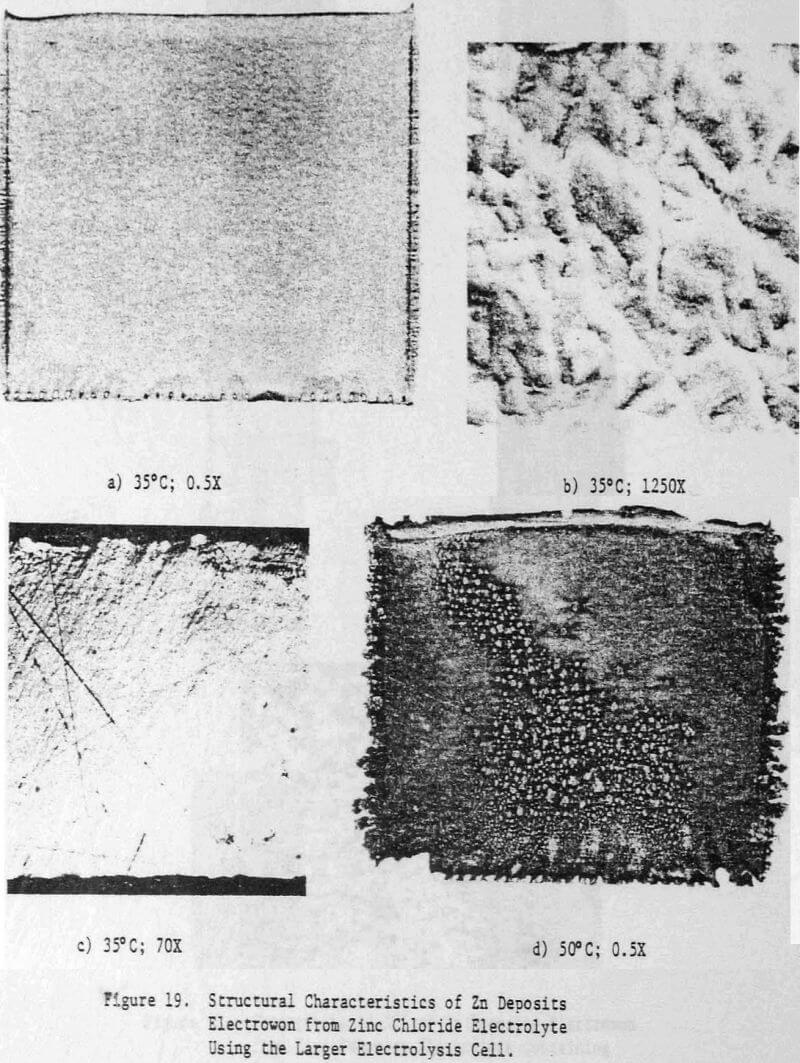
Operating conditions of 323 A/m² (30 ASF) and 35°C were used for most of the experiments although some tests were done at other current densities to assess the effect of this variable on the structure and quality of the zinc deposits. Unless otherwise stated, all electrolysis tests were run for 24 hours.
Deposit Examination
Sections of the deposits were examined by X-ray diffraction (XRD) to determine their preferred orientation relative to the ASTM standard for zinc powder and by scanning electron microscopy (SEM) to determine their Surface morphology. Deposit cross sections were examined by optical microscopy (OM) techniques.
Current Efficiency and Energy Requirement
The current efficiency (CE) was calculated from the weight of the zinc deposit and the number of coulombs passed. The energy requirement (ER) was calculated in terms of kWh/kg, using the average cell voltage recorded during each test and the weight of the zinc deposits.
Standard Electrolysis Conditions
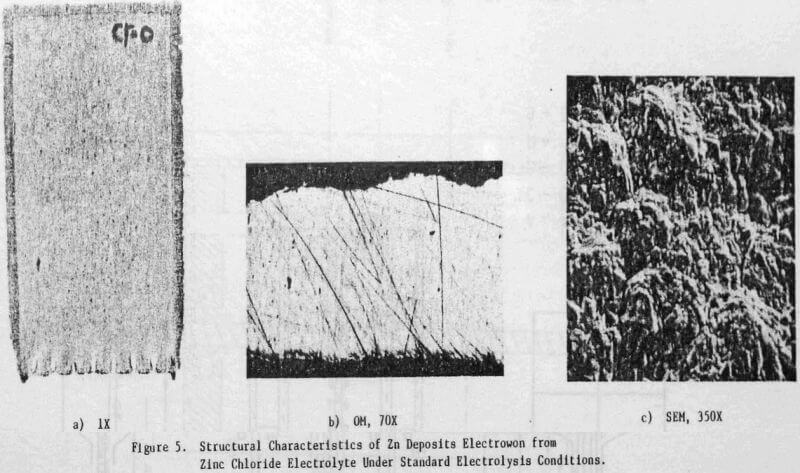
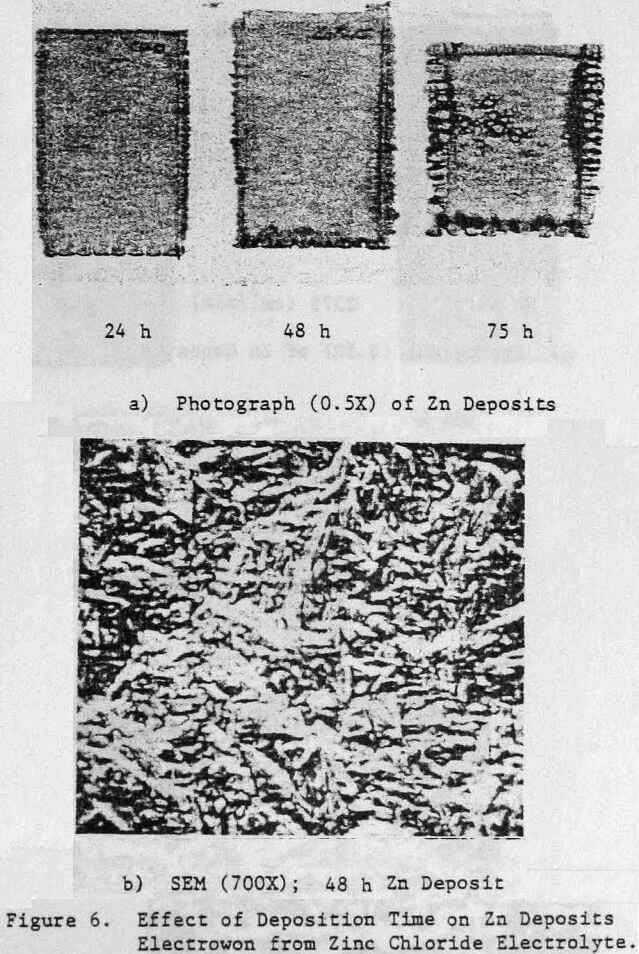
Preliminary experiments were concerned with manipulating variables such as Zn and HCl concentrations in the electrolyte, current density, temperature and addition agent concentration to establish standard electrolysis conditions which would yield smooth, compact, dendrite-free 24-h zinc deposits on a reproducible basis. These standard conditions are summarized in Table 2 and a typical 24-h zinc deposit, is shown in Figure 5(a). The zinc deposit is smooth with bevelled edges, showing no signs of dendritic growth. A cross section of the deposit is shown in the photomicrograph (70X), Figure 5(b), which indicates the deposit to be compact and relatively even. The typical morphology of zinc deposits obtained for the experimental conditions given in Table 2 is shown in the SEM photomicrograph, Figure 5(c). The refined grain size is caused by the presence of 15 mg/L TBACl in the electrolyte. This deposit morphology is very similar to that obtained previously for the l-h deposit of Fig. 1(c)). The preferred orientation, relative to the ASTM standard for zinc powder, was [101], [110]. Similar deposit structures (Fig. 6) were also obtained under these conditions (Table 2) for deposition times >48-h. Deposits obtained for 24, 48 and 75~h are shown in Figure 6(a). The 24 and 48-h deposits are very similar while, the 75-h deposit has some nodular growth on its surface and particularly at the bottom between the air sparger holes. The on-set of powder formation along the edges, of this deposit is also evident. The SEM photomicrograph for the 48-h deposit (Fig. 6(b) reveals that the morphology is similar to that obtained for the 24-h deposit (cf. Fig. 5(c)).
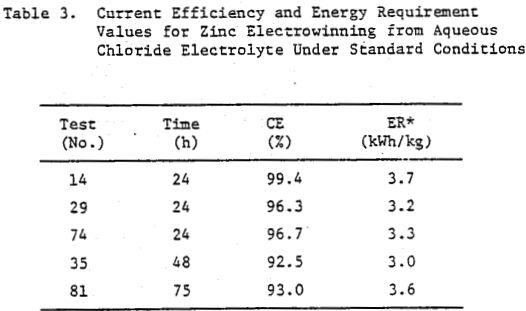
Some typical current efficiency (CE) and energy requirement (ER) values for zinc electrowinning from aqueous chloride electrolyte are summarized in Table 3. The average value for the energy requirement 3.4 kWh/kg (Table 3), obtained under these conditions (Table 2) is the same as that for commercial zinc electrowinning from acid sulphate electrolyte. Semiquantitative spectrochemical analysis of sections of the deposits obtained for the conditions listed in Table 2 indicated 99.97% Zn.
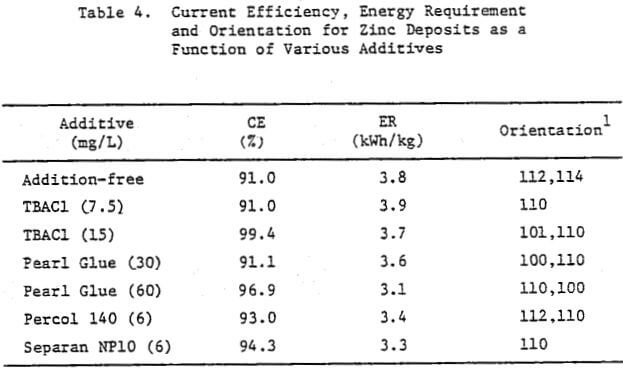
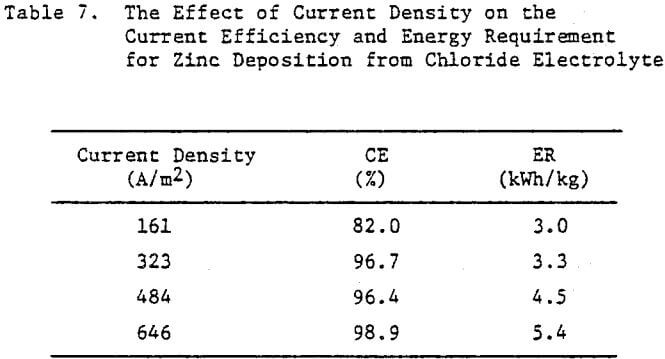
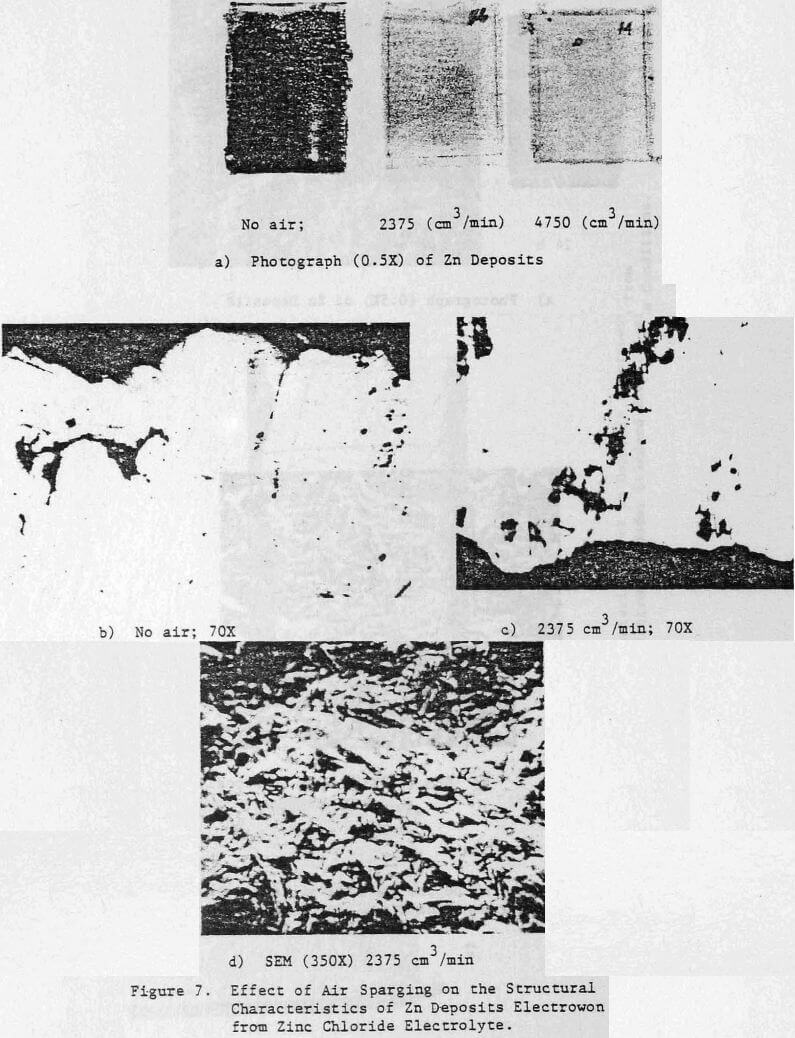
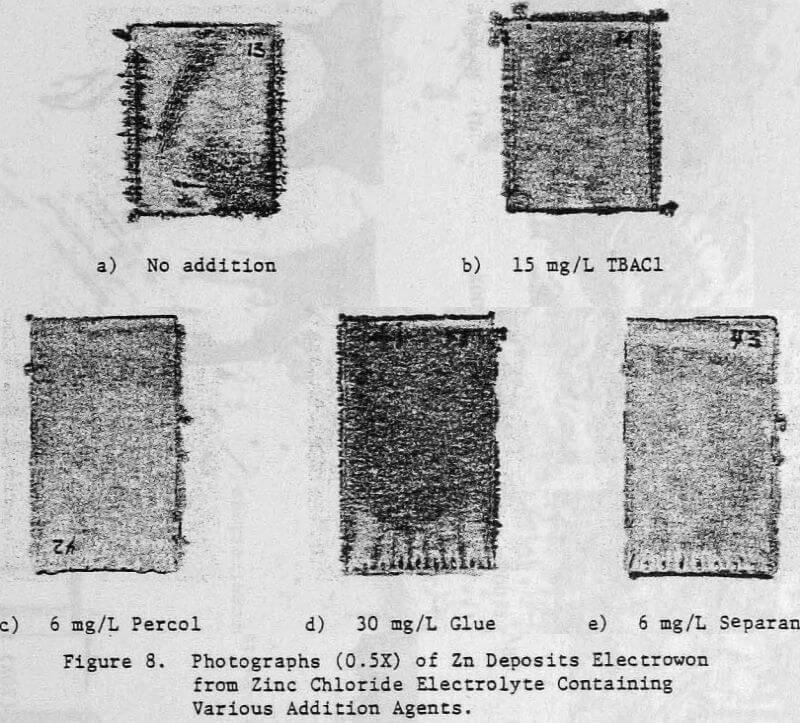
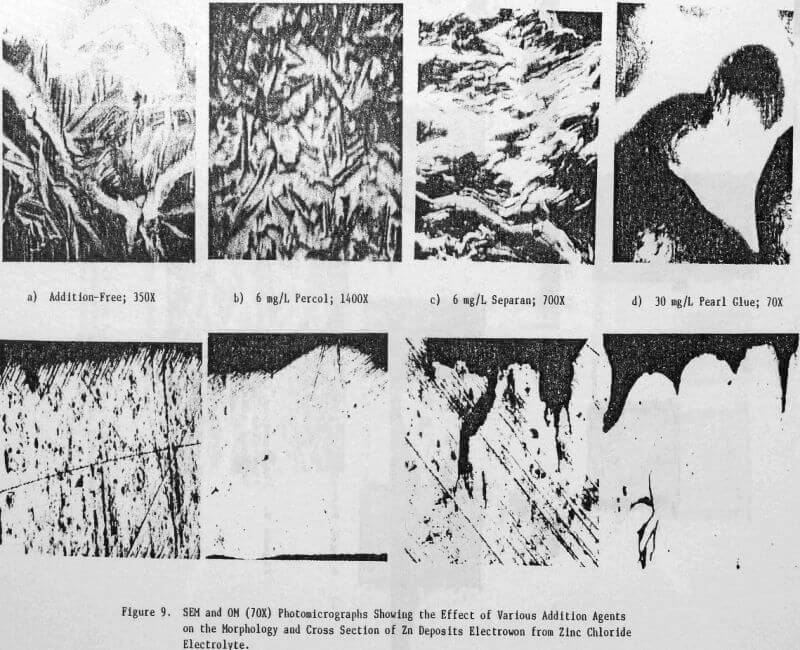
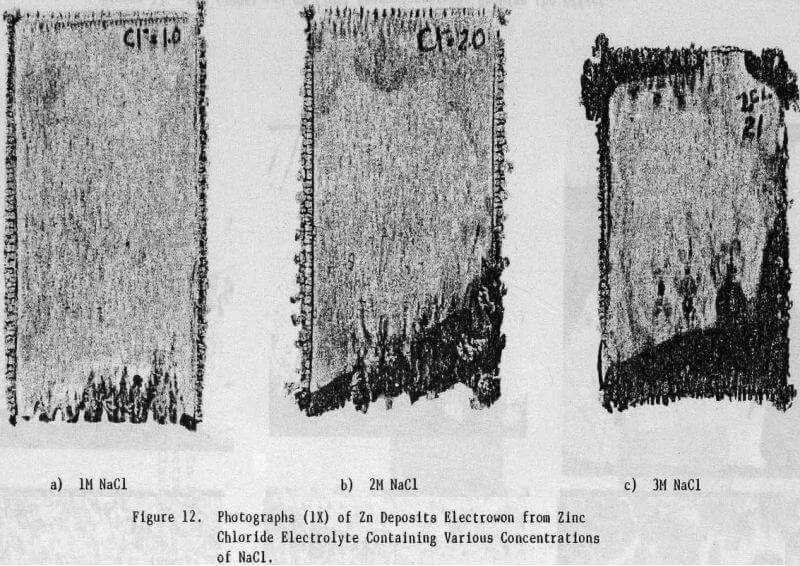
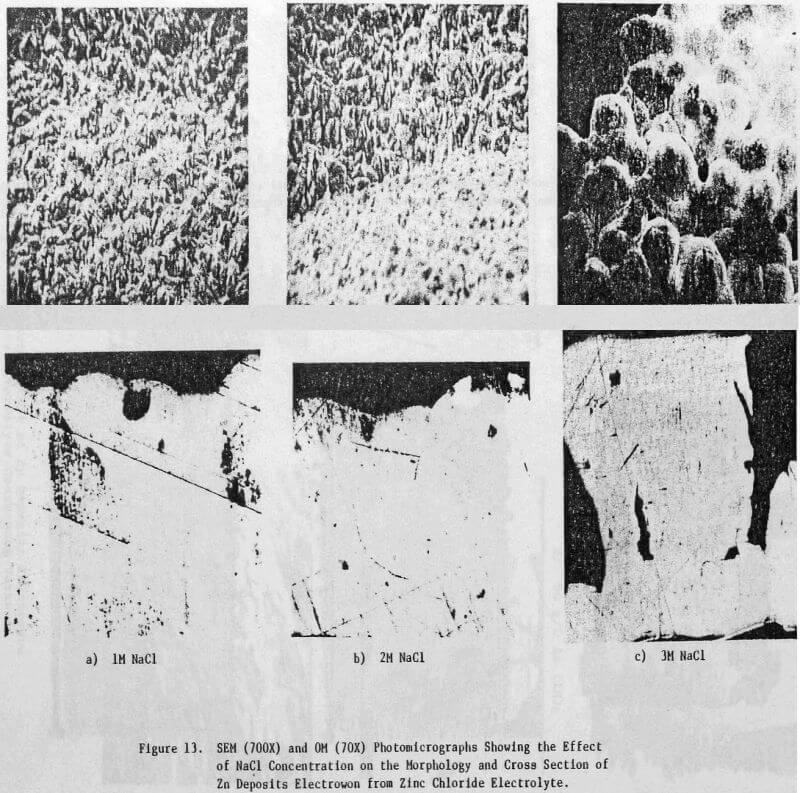
The effect of variations in air sparging rate, addition.agent, HCl concentration, current density, zinc concentration as well as the effect of NaCl and metallic impurities on the structural characteristics of the zinc deposits and on the current efficiency were determined.
Effect of HCl Concentration
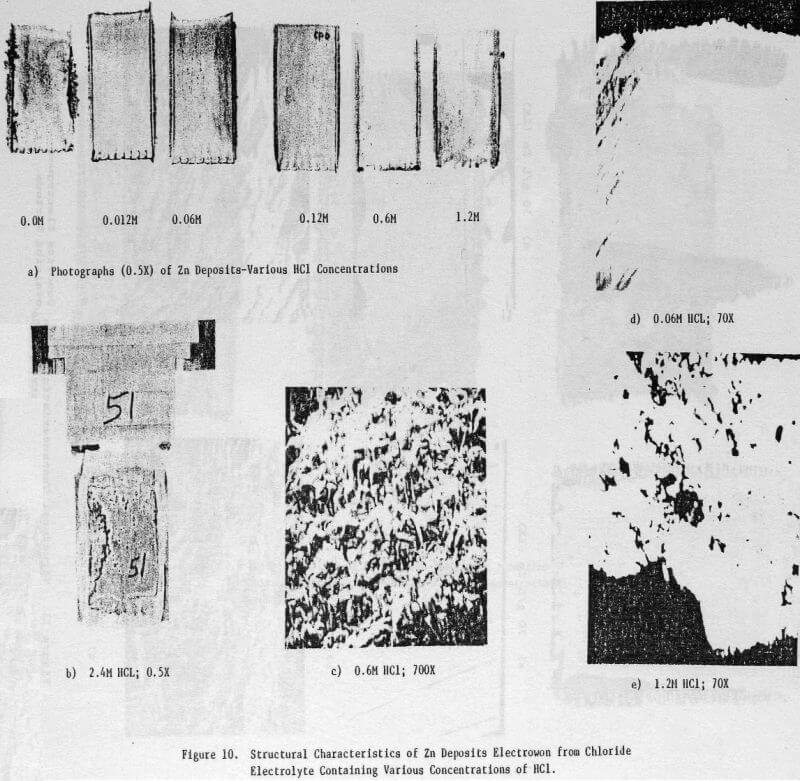
Figures 10(a) and (b) show a series of photographs of zinc deposits obtained from zinc chloride electrolytes in which the HCl concentration was varied from 0 to 2.4 M. The deposit obtained from the electrolyte containing no added HCl was rough and featured dendrite formation along the edges. The deposit surface became smoother and the dendritic edge growth was lessened as the HCl concentration was increased, the best surface was obtained at 0.12 M HCl. At higher HCl concentrations; e.g., 0.6 and 1.2 M, the deposit surface and edges again became rough and nodular. At 2.4 M HCl, only a partial zinc deposit was obtained as the aluminum cathode underwent severe dissolution (Fig. 10(b)).
The structural characteristics of the zinc deposit obtained as a function of HCl concentration are shown in the SEM and OM photomicrographs, Figures 10(c)-(e). Increasing the HCl concentration to 1.2 M had no significant effect on the zinc deposit morphology (Fig. 10(c)) which was similar to that obtained under standard electrolysis conditions (cf. Fig. 5(c)). The cross sections of the zinc deposits obtained for HCl concentrations to 0.6 M are typical of those shown in Figure 10(d); i.e., smooth and compact. For 1.2 M HCl, the cross section (Fig. 10(e)) indicates an uneven, porous deposit.
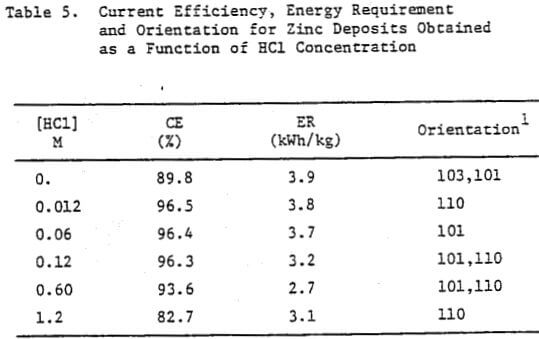
The data obtained for the current efficiency, energy requirement and orientation for zinc deposits obtained as a function of HCl concentration are presented in Table 5. A high CE and reasonable ER were obtained at 0.12 M HCl; at HCl <0.12 M, the CE remained high (except for 0.0 M HCl) but the ER increased whereas for HCl >0.12 M both the CE and ER decreased. At 0.0 M HCl, the CE decreased significantly (89.8%) and the deposit orientation changed from [110], [101] to [103], [101].
Effect of Zinc Concentration
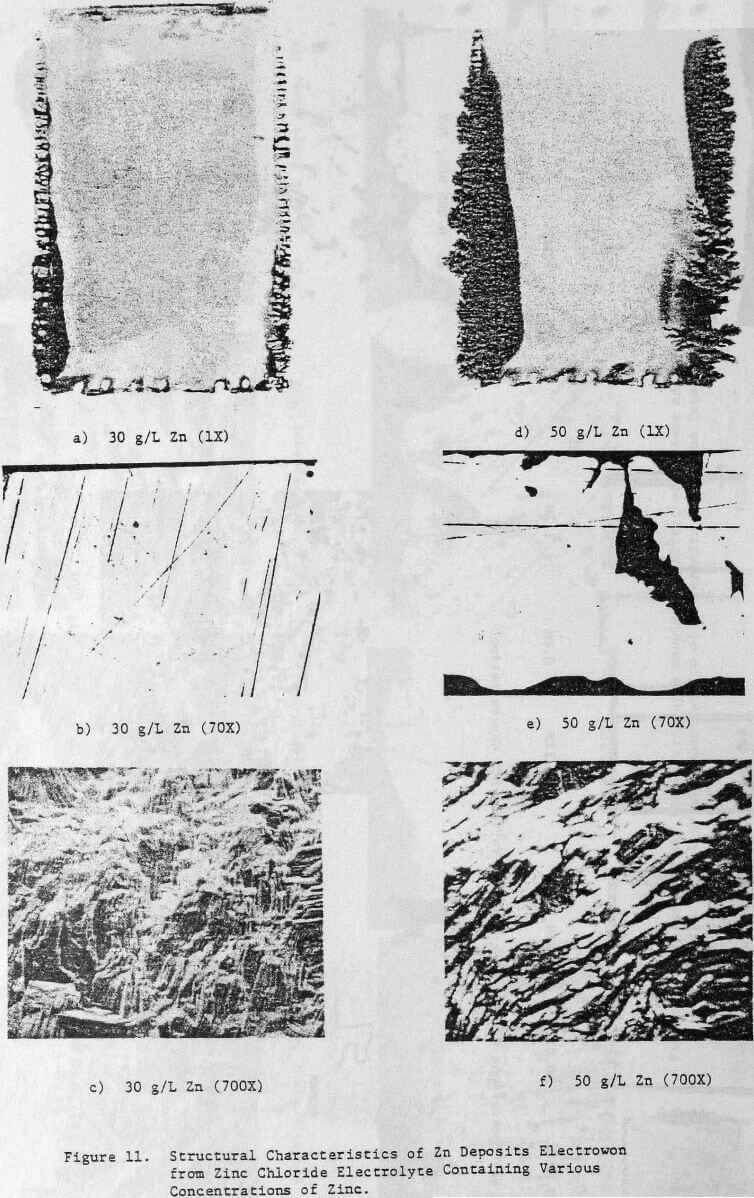
The effect of maintaining higher zinc concentrations in the cell electrolyte on the structural characteristics of 24-h zinc deposits obtained from zinc chloride electrolyte is shown in Figure 11. A cell electrolyte containing 30 g/L Zn results in the zinc deposit shown in Figure 11(a), which indicates the on-set of dendritic growth and powder formation at the deposit edges. The center of this deposit is smooth and compact as indicated by cross-section, Figure 11(b), but is thicker than the deposit obtained from an electrolyte containing 15 g/L Zn, cf. Figure 5(b).
This is probably related to the vertical or outward growth of the deposit obtained from the electrolyte containing 30 g/L Zn as shown in Figure 11(c).
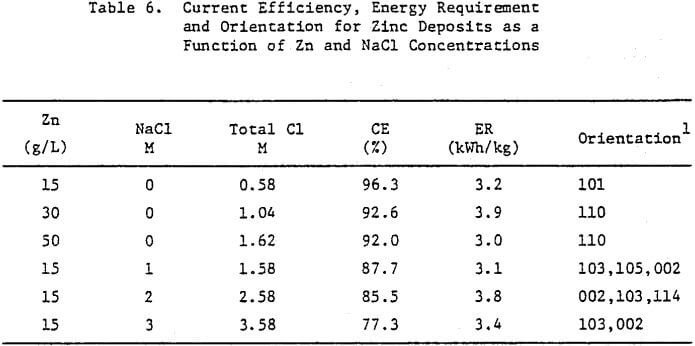
Increasing the Zn concentration in the cell electrolyte to 50 g/L results in increased denddritic growth and powder formation, Figure 11(d). The cross section reveals the presence of voids in the deposit, Figure 11(e), and the SEM photomicrograph, Figure 11(f), shows that the vertical growth is maintained. The CE decreases from 96.3 to 92.0% as a result of increasing the Zn concentration from 15 to 50 g/L (Table 6), The deposit orientation (Table 6) changes from [101] to [110] preferred in agreement with the vertical or outward growth exhibited (Fig. 11(c) and (f)).
