Table of Contents
Model studies, using rock, require carefully prepared specimens. Most preparation procedures use some form of grinding or polishing as the last of several steps. During these steps, particularly the final one, the surface formed acquires a configuration defined as texture. Texture is a composite term identifying the physical features called flaws, lay, waviness, and roughness.
Any prepared surface has each of the four features to some degree, all of which will influence any physical property test dependent upon surface effects. Identification of these surfaces is important in tests such as sliding friction and the influence of planes of weakness on strength.
The importance of surface texture upon the apparent coefficient of sliding friction between rock surfaces has been discussed by both Byerlee and Ripley. However, their reports indicate that neither investigator presented the entire surface in true perspective. Due to instruments used, waviness was not included as it should be in sliding friction studies.
An investigation of the influence of planes of weakness on pillar strength presently being conducted by the Bureau of Mines required an evaluation of the surface texture. To obtain a wider range of vertical movement of the tracer point than present in commercially available instruments, a device was designed and built that would give a complete surface representation including waviness. The following report is the result of equipment design and procedural development for measuring rock surface textures.
A device for measuring and recording surface textures was developed based upon the linear variable differential transformer (LVDT). The resulting records were used as a quality control measure for fabricated surfaces which simulated planes of weakness. Details of important rock surface features, equipment design, and measuring procedures are described.
No claim is made as to the superiority of this device over commercial surface measuring devices.
There is no stylus-type instrument available which will give the absolute profile of the surface texture because of the limitations of the size of the tracer point. This instrument was designed to give an approximate and useful comparative value of a measure of the surface texture of rock using other instruments, such as the X-Y recorder, which would probably be available from other areas of research.
The Texture of Surfaces
Surface texture, as defined by the American Standard ASA B 46.1-1962, is “The repetitive or random deviations from the nominal surface which form the pattern of the surface. Surface texture includes roughness, waviness, lay, and flaws”. These four descriptive terms for surface texture, which are defined by the American Standard, will be used in this paper and are repeated below for convenience.
Roughness consists of the finer irregularities in the surface texture usually including those irregularities which result from the inherent action of the production process. These are considered to include traverse feed marks and other irregularities within the limits of the roughness-width-cutoff.
Waviness is the usually widely-spaced component of surface texture and is generally of wider spacing than the roughness-width-cutoff. Waviness may result from such factors as machine or work deflections, vibration, chatter, heat treatment or warping strains. Roughness may be considered as superposed on a ‘wavy’ surface.
Lay is the direction of the predominant surface pattern, ordinarily determined by the production method used.
Flaws are irregularities which occur at one place or at relatively infrequent or widely varying intervals in a surface. Flaws include such defects as cracks, blow holes, checks, ridges, scratches, etc. Unless otherwise specified, the effect of flaws shall not be included in the roughness height measurements.
Any measurement of a surface must provide for the four factors defined above. The roughness, waviness, and lay are dependent on the material and the surfacing process. Flaws are selectively eliminated for most laboratory purposes. Specific studies, such as sliding friction of two or more rock surfaces, can be conducted to reduce the importance of lay. For example, if the two sliding surfaces are always ground in a constant direction in relation to the direction of movement during the test, lay becomes negligible as a surface texture variable. Roughness and waviness cannot be reduced below some minimum value for each investigation due to economic and time limitations. Measurement of surface texture then becomes principally an identification of roughness height and width and waviness height and width.
Most commercial measuring devices have a roughness-width-cutoff which is defined as : “The greatest spacing of repetitive surface irregularities to be included in the measurement of average roughness height”. The numerical value from the roughness measurement usually does not include all the lower frequencies of waviness because of this cutoff; consequently, the true surface is not represented. When the total surface is involved in a test, as it is in sliding friction, waviness becomes the major factor and can only be correctly identified by measurements made across the complete surface without some limiting filter circuit.
The influence of asperities of a given height and shape on the texture of a surface is a function of the wavelength (λ). To illustrate this, figure 1A shows a perfectly flat surface. If λ is made progressively smaller, keeping the amplitude or height constant, the acceptable smooth surface, figure 1A where λ → ∞, will change to a rough surface depending only on λ as illustrated for figures 1B through 1F. Obviously, if only the height of the asperities is used as a criteria to measure roughness, the height measurement or roughness from A to B on figures 1B through 1F, would all give the same value. A measurement of ½ inch horizontally on figure 1D will not give the same height as a ½ inch horizontal measurement on figure 1E. Therefore the horizontal length over which variation in surface heights is measured is very important and a necessary qualification to assess the surface texture. This horizontal length is called the roughness-width-cutoff or sampling length, as previously defined. The roughness-width-cutoff for commercial instruments starts at 0.003 inch, and is 1.000 inch as a maximum. If the roughness-width-cutoff is not specified, the value of 0.030 is assumed. The tracing stroke is as long as the capability of the measuring instrument (2-¾ inches in the
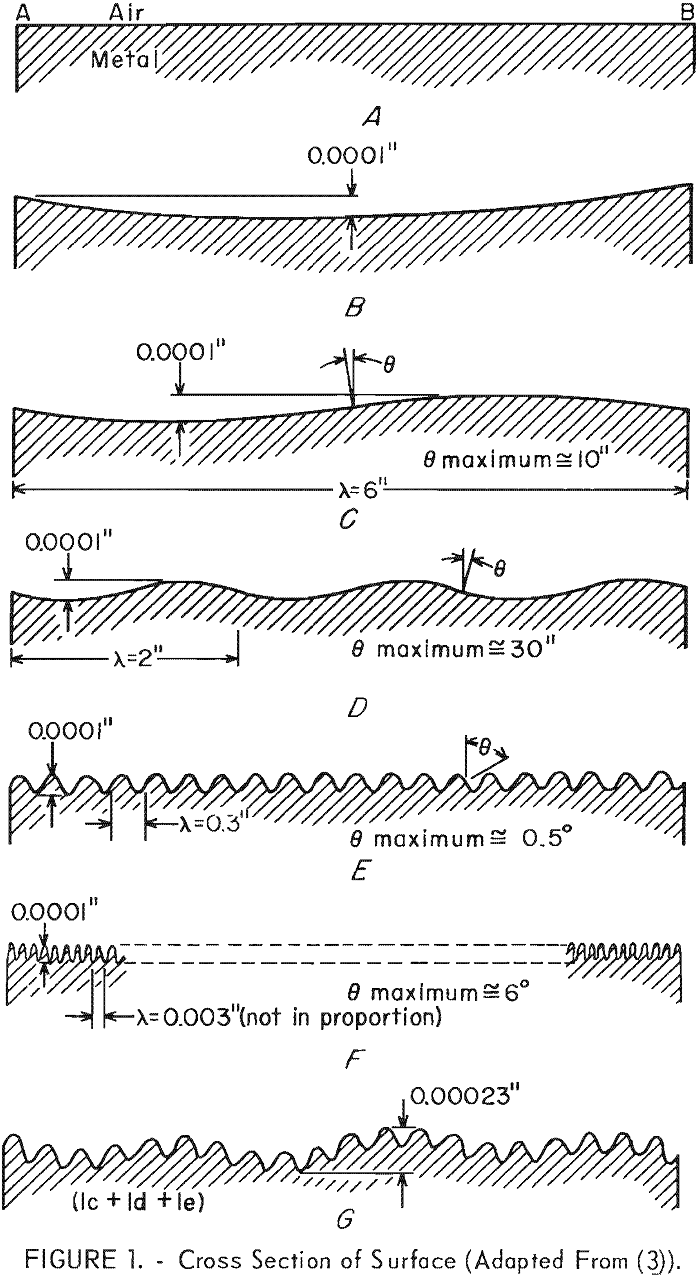
Microcorder or 6 inches in the Talysurf instrument) but the averaging is still done on a roughness-width-cutoff which is 1 inch as a maximum. Commercial surface measuring devices use 0.003 to 1.000 inch as their roughness width-cutoff to provide a standardized technique of quantitative evaluation and are made electronically selective to measure only part of the wavelengths represented by a surface. A low-frequency cutoff filter system is built in the instrument. As stated by Reason, “It is important to realize the measurement made by modern electrical integrating instruments is not of the surface itself, but of that representation of the surface offered to the integrating meter by the pickup, amplifier, and filter circuits used to control the selectivity”. Therefore, commercial surface measuring instruments are primarily designed to measure roughness and some of the higher frequencies of waviness of low amplitude. On figure 1G, only the small irregularities superimposed on the longer wavelengths would probably be measured by commercial instruments.
Cylindrical rock specimens of the same length can vary several thousandths of an inch due to nonparallelism of ends (Δl) surface waviness, and surface roughness as shown in figure 2. The grinding facilities available gave
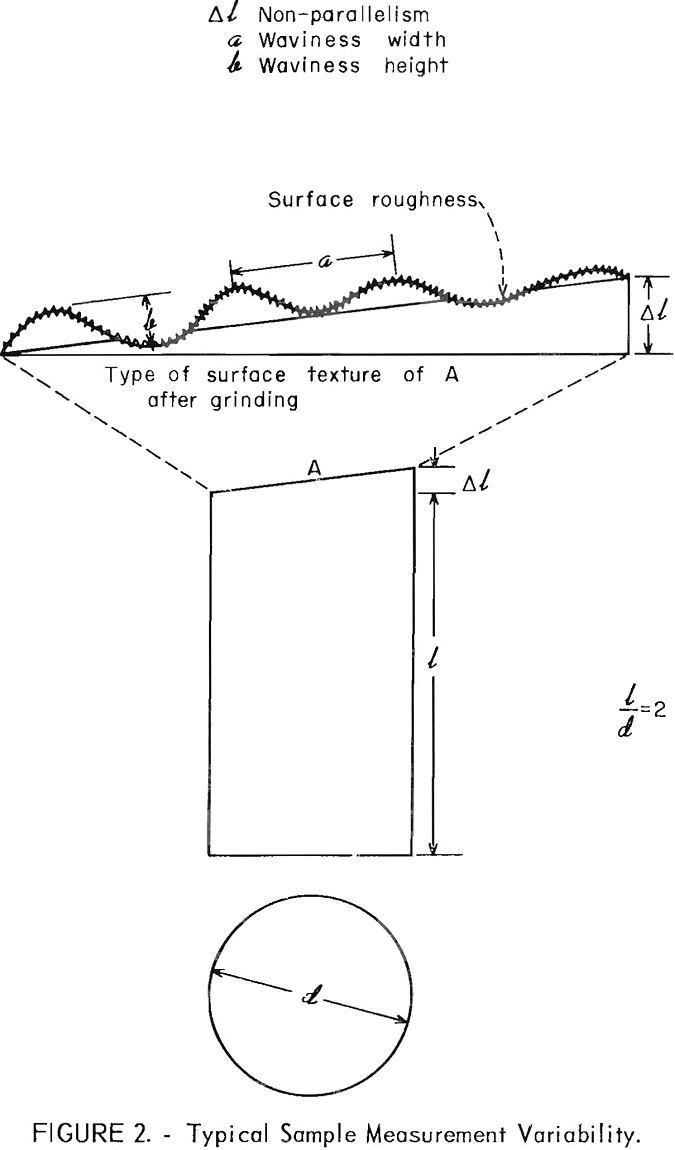
reproducible surface accuracies of ±0.0005 inch for a 5¼-inch specimen length. Careful grinding techniques could give 0.0001 inch of nonparallelism. Surface waviness height (b in fig. 2), varied from 25 microinches to 250 micro- inches dependent on the rock type.
The planimeter technique was used for data interpretation. This technique is comprised of the following steps: (1) draw a center line through the surface profile, (2) use a planimeter to measure the total area above the center line and the total area below the center line, (3) if these total areas are within 10 percent of each other, then proceed. If not, a new center line is drawn and total areas are again obtained, (4) add the two areas and divide this sum by the traverse length. This will give the arithmetical average of the height of the planimetered area in inches, (5) multiply this height by the vertical scale value giving an average waviness and roughness height in microinches.
This numerical value is the quantitative representation of surface texture. Although it does not compare with the usual surface roughness values, for many purposes, it is a more realistic number because it includes all frequencies of the waviness and geometry.
Equipment
The LVDT was chosen as the basic transducer because of its combination of range and accuracy. The LVDT is an electromechanical transducer which converts mechanical movement of the transformer core into differential voltage
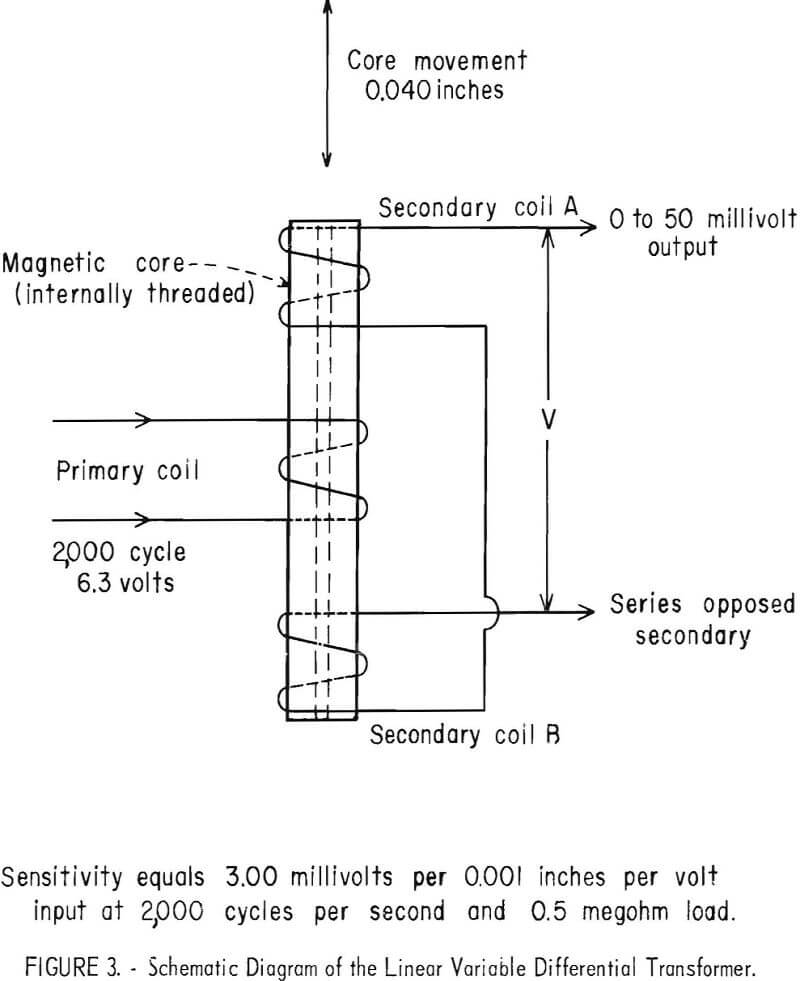
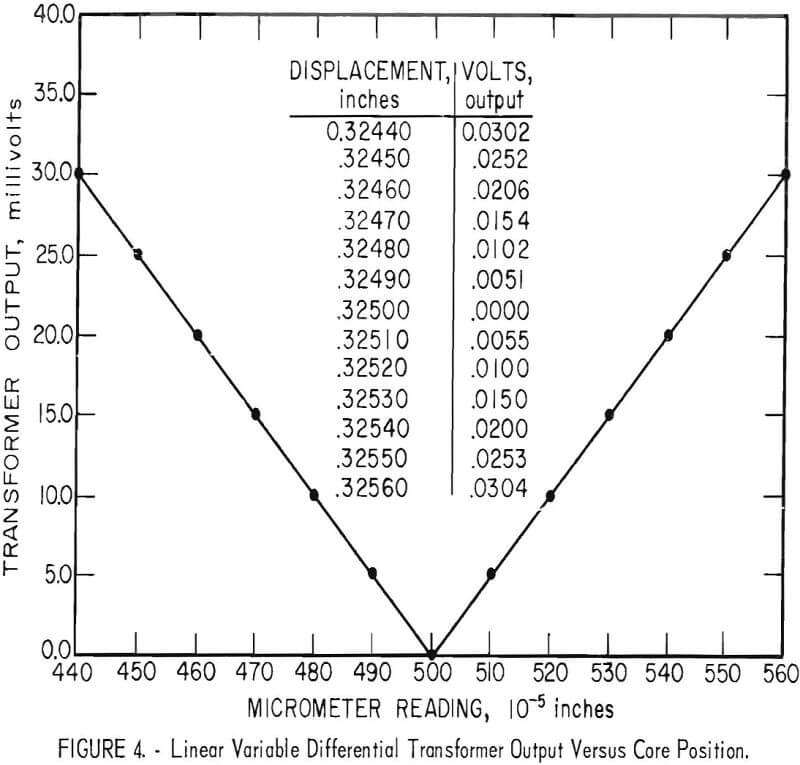
output that is linear with respect to the movement over a given range within ±0.5 percent. Sensitivity of two parts in one million is obtained; however, accuracy is primarily dependent upon the probe and holder characteristics. The transformer is basically three coaxial coils of wire surrounding a movable magnetic core, as shown schematically in figure 3. The primary voltage induces voltages in the two secondary coils that are equal and opposite in phase at the null position. If the core is moved toward coil A, the induced voltage in coil A increases while the induced voltage in coil B decreases. The resultant output voltage V from the two secondary coils is directly proportional to the axial movement of the core. The output of the transformer versus core position is shown in figure 4. Using only this portion of the nominal range of the LVDT, the graph would indicate that the linearity is ±0.3 percent or well within the ±0.5 percent specification. The recorded data was obtained from an 040 MSL Schaevitz LVDT, with a range of ±0.04 inch,
energized by a Daytronic Type 300C S/N 303B40 amplifier indicator with a type 62 plug-in and Fluke model 801 differential voltmeter.
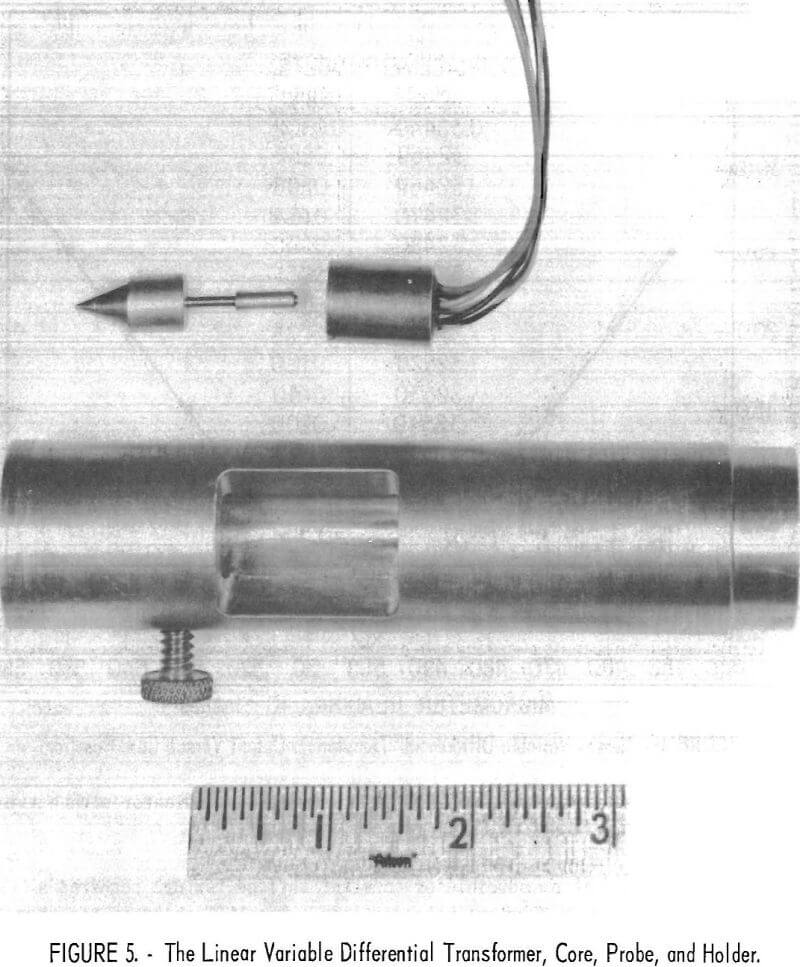
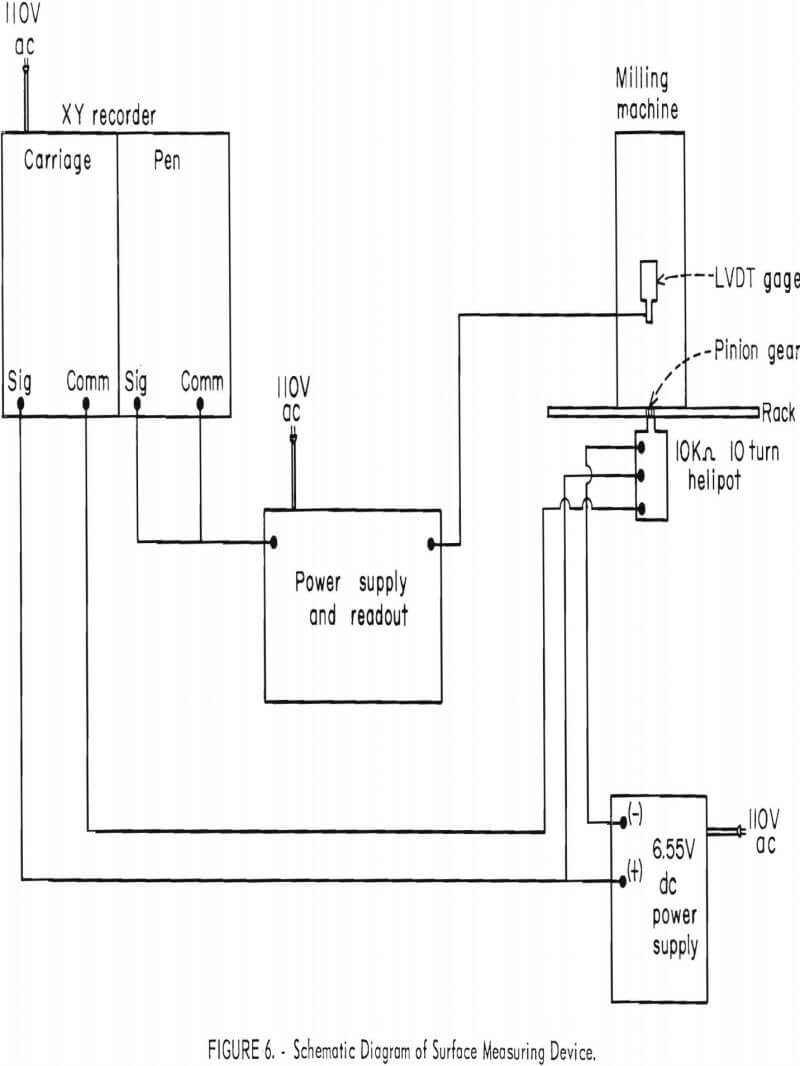
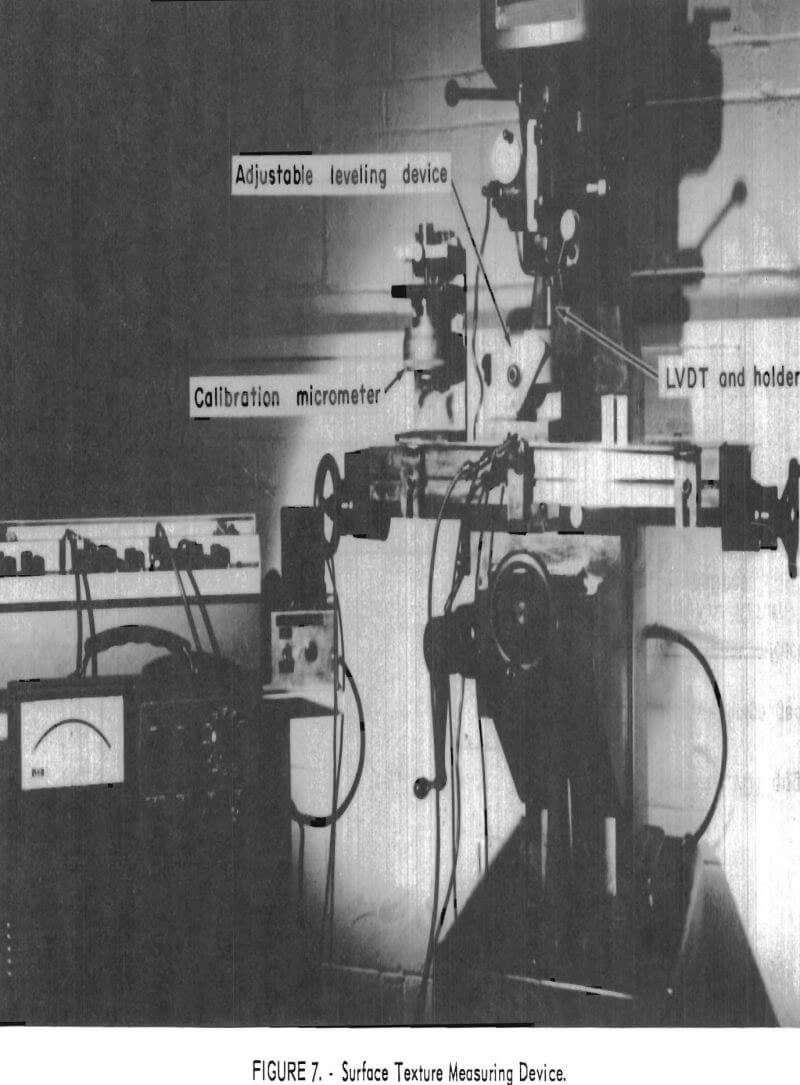
Determination of reproducible or constant surface texture required a measurement accuracy of 20 microinches or less. The LVDT selected together with the smallest scale setting of the readout device produced a sensitivity of 2 microinches. The surface probe used had a ball 0.03125 inch in diameter and the total weight of the probe assembly was 6.5 grams and was 1.6 inches long. Other probes tried were balls 0.0625 and 0.125 inch in diameter and a needle point of less than 100 microinches in diameter. All of these were less satisfactory than the 0.03125-inch probe in describing the surface and in producing repeatable results. A special holder and probe were designed, as shown in figure 5, to adapt to the chuck of a milling machine. The LVDT output signal was used to drive the vertical coordinate control of the X-Y plotter. The attenuation or gain was adjusted either by scale setting of the power unit to the LVDT or at the X-Y recorder. The X-axis of the recorder was activated directly from a rack and pinion mounted potentiometer connected to a milling machine cross travel, as shown schematically in figure 6. Magnification of this signal was generally not greater than 2:1 since a 2-1/8 inch traverse across the specimen end was adequately represented in four to six inches on the graph. Vertical signal amplification depended upon the surface waviness. Figure 7 shows the surface measuring device and auxiliary equipment, including the calibration micrometer.
For the smoother surfaces, the sensitivity or minimum reading obtainable was determined by the amplifier calibration and was 2 microinches. A minimum reading means the value of the smallest division of the graph paper which was, for this case, 10 divisions per inch. The accompanying range for this sensitivity was 200 microinches maximum, or two magnitudes. For rough surfaces the limitation was the total range of the transformer of 0.04 inch (40,000 microinches) with an accompanying sensitivity of 400 microinches. Horizontal range at 1:1 reproduction allowed 15 inches horizontal specimen travel with a constant minimum reading of 0.1 inch. The definition of minimum reading is the same as stated above. The horizontal scale does not affect the height, since the measured height is a function of probe dimension. If the peaks of asperities are closer together than the diameter of the ball of the probe point, the true height of the asperity is not measured.
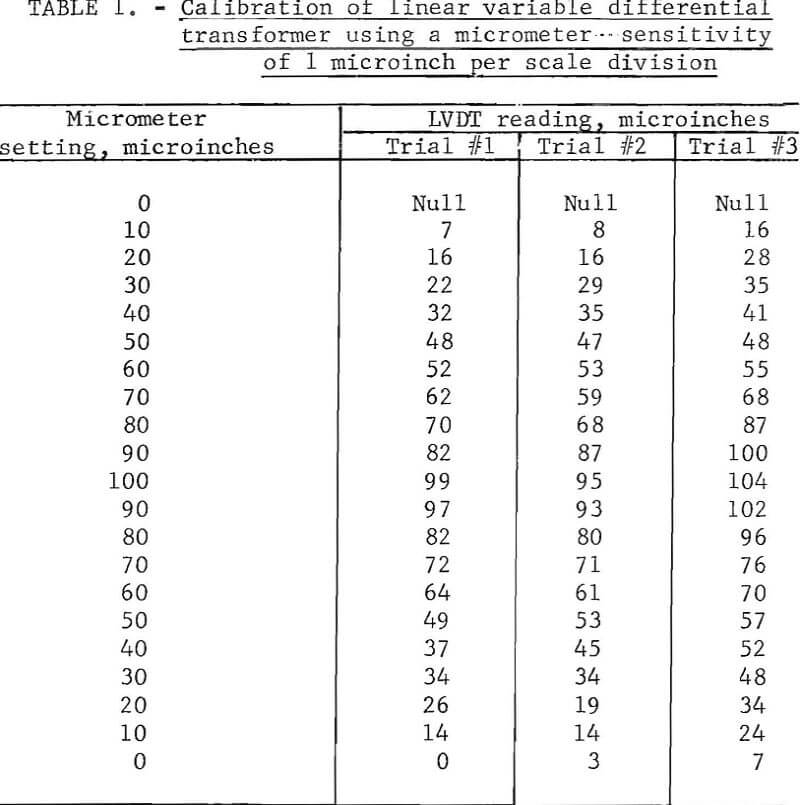
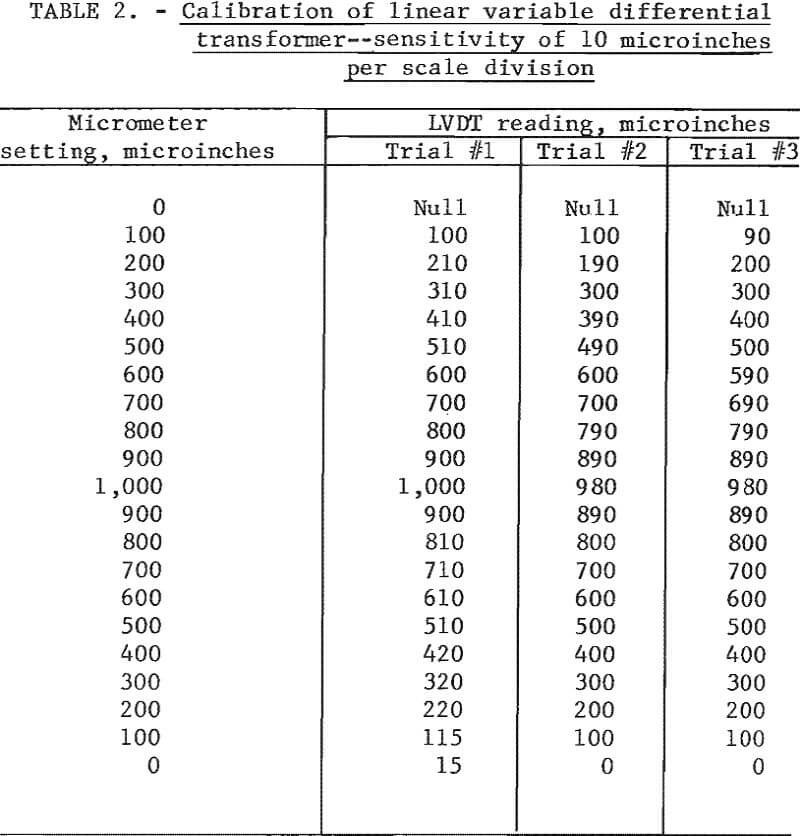
Several features such as core alinement with the axis of the coils, linear range of LVDT, input stability, shielding, and environmental factors adversely affect accuracy of measurement. The cumulative effect of these factors was shown to be less than 20 microinches when compared to micrometer measurements. The results of two comparative tests are shown in tables 1 and 2. Input voltage fluctuations, potentially the largest error, were found to be quite low. Slight fluctuations of one to four microinches in the readout were due to a rapid change of line voltage; however, gradual change in line voltage from 105 to 125 volts resulted in less than 2 microinches shift. If accuracies greater than 20 microinches are desired, then special precautions for these variable factors must be taken.
Procedure
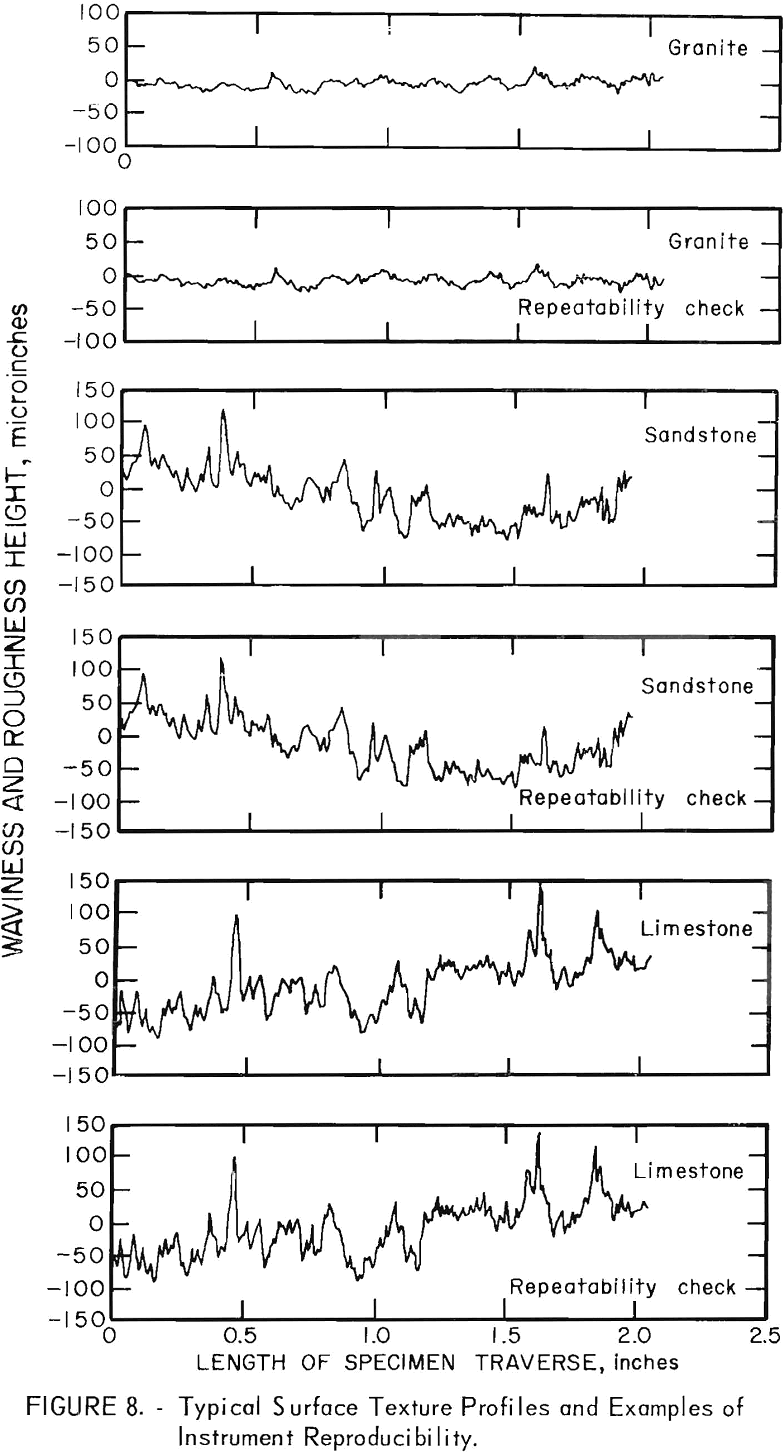
After the sample is placed on the bed of the milling machine the LVDT is positioned at the starting point of the line along which the surface profile is desired. The null position of the LVDT is obtained by the vertical feed mechanism of the milling machine. A convenient scale on the amplifier unit is selected, and the amount of nonparallelism is determined by a trial traverse using the cross feed of the milling machine. Adjustments to compensate for nonparallelism and to provide for a level surface within the range of the LVDT setting is made by the use of shim stock placed under the sample or by an adjustable leveling device seen in figure 7. The null position of the starting point is again determined, and the profile of the surface waviness and roughness is made. This procedure takes approximately 5 minutes. Specimens with excessive nonparallelism (0.001″/2-1/8″) should be reground. Surfaces found to be concave or convex to as little as 100 micro- inches maximum deviation from a mean level line were also reground for sliding friction tests. Figure 8 shows a sample of the profile of surface waviness and roughness for limestone, sandstone, and granite together with a repeat of the traverse to show the reproducibility of the device.
Conclusions
Specific conclusions made as a result of the study are:
- The surface texture of rocks can be identified accurately and quickly by use of an LVDT and X-Y recorder.
- The capability of identifying surface irregularities of 20 microinches or larger is standard and exceeds the limit of all but the most exacting preparation equipment.
- Application of the LVDT with appropriate probe design gives a very useful graphical presentation of the rock surface for quality control.
