Table of Contents
Rittinger’s theory and law of the energy expended in crushing of rock is that the work of crushing is proportional to the reduction in diameter; or, as I have more fully expressed it:
“The work done in crushing is proportional to the surface exposed by the operation; or, better expressed for this purpose, the work done on a given mass of rock is proportional to the reciprocal of the diameter of the final product, assuming that all the mass has been reduced to one exact size, which is only theoretically possible.”
Kick’s law is: “The energy required for producing analogous changes of configuration of geometrically similar bodies of equal technological state varies as the volumes or weights of these bodies.” In other words, the energy expended is porportional to the volume reduction, instead of the diameter reduction.
That these two laws would give widely different results may be shown by a simple imaginary case. A ton of 16-in. cubes is broken to 1-in. cubes at the first operation, and these are broken to 1/16 -in. cubes at a second operation. Since the first operation produces only one-sixteenth as much new surface as the second, the ratio of energy expended in the two operations would be by Rittinger’s law as 1 to 16. By Kick’s law, since the volume-reduction ratio is the same in both cases, the ratio of energy would be 1 to 1. This discrepancy is great enough to challenge a test by actual experiment, of which there has been, hitherto, but little compared with the amount of argument. The present paper is the record of such a test, and is offered as showing that Rittinger’s theory more nearly represents the actual facts that any other proposed hitherto.
Mr. Stadler, in the paper already cited, applying to rock fracture Kick’s law (which I accept as applicable to the deformation of elastic bodies), proves that the stamp mill, working on relatively coarse feed, is several times as efficient as the tube mill on fine feed, this relation being expressed in what he calls “relative mechanical energy per horsepower.” He distributes his energy units among the various sizes produced, according to Kick’s law. But my results show, among other things, that many more of Stadler’s energy units are obtained per foot-pound-applied, in coarse than in fine crushing. This suggests a doubt as to the correctness of his unit, since one would expect a foot-pound-applied to produce the same number of “energy units,” whether the feed and resulting product were coarse or fine. When Rittinger’s theory is applied, the number of mesh-tons (my unit of surface produced) is nearly proportional to the foot-pounds-applied, whether the product be coarse or fine; hence my conclusions favor, the simple Rittinger theory that surface produced is proportional to energy applied.
The Two Laws:
It is the purpose of this paper to record and interpret a series of experiments made for the purpose of studying the consumption of energy in the crushing or fracturing of rock particles both coarse and fine. At the start, the expectation was to determine constants according to the Rittinger theory for several rocks, whereby it would be possible to calculate absolute crushing efficiencies of machines crushing such rocks, or to predetermine what a machine would accomplish in the way of tonnage and screen analysis upon a given rock, knowing what the machine accomplished upon another rock whose constants were likewise known. While approximate constants for a few rocks were determined, the results indicated that an amount of work (perhaps with the microscope upon sizes too small to be screened) greater than could be accomplished by a single investigator would be necessary to determine these constants with reasonable accuracy. For this reason no constants are submitted as such in this paper.
What about Bond?
It is possible, however, to compare by means of these experiments!’ the two antagonistic “laws” of crushing already mentioned. The fracture of cubes by compression in a testing machine produces, in nearly all cases, pyramids of the same general shape (Fig. 1), indicating that the stresses are greatest along certain planes of fracture; and, since the relative movement must have been greatest along these fracture or shear planes, the greatest amount of energy must have been expended there. While I know of no tests that show that the several pieces return to the dimensions existing before the break, it seems reasonable that they do, and that they do not retain the deformation. All that has resulted from the pressure and consequent movement is cracks. They are new, while the particles resulting are of the same form and specific gravity as they were before separation; and if put together accurately the dimensions of the mass would be the same.
Rittinger’s Law:
Rittinger’s theory is the law of the cracks. It is well explained in an article by E. A. Hersam in the Mining and Scientific Press, an abstract of which is given in the third volume of Richard’s Ore Dressing, and to which I acknowledge my indebtedness for some of my ideas and,methods.
The mathematics of this theory follow:
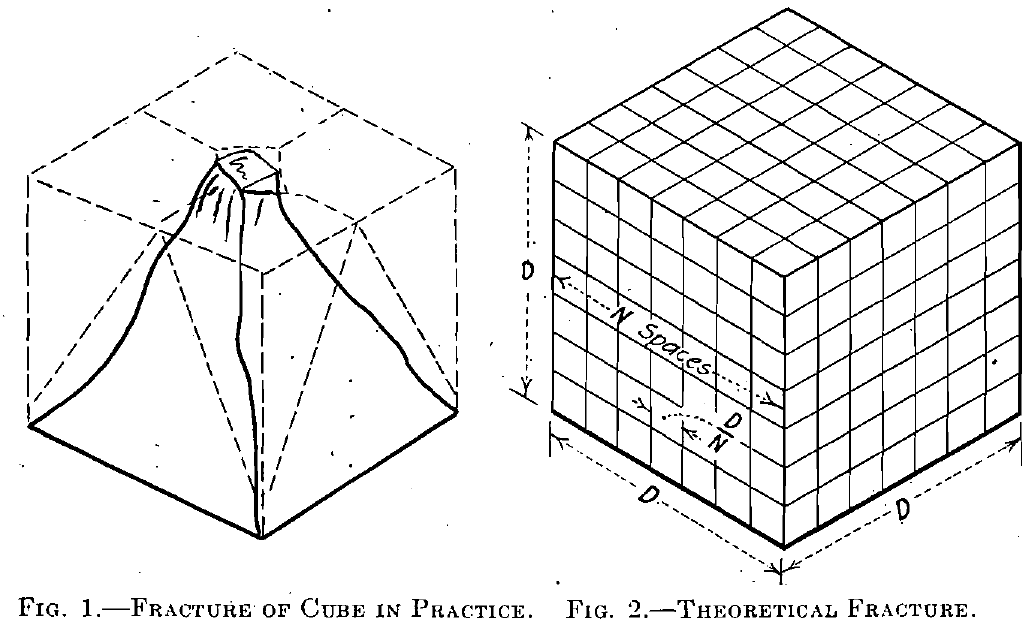
Assume a cube of rock (Fig. 2) of side D, divided into smaller cubes by planes passing through it in three directions, as shown. The surface of the original cube being 6D2, the aggregate surface of the smaller cubes will be 6ND2, and the new surface exposed will be 6(N — 1)D2. The theoretical mesh or reciprocal of diameter of new particles, M, is N/D hence N = MD; and the aggregate final surface, S = 6ND2 = 6MD3.
With D constant, that is, starting from the same size of cubes in both cases, S : S’: : M : M’, or the total surfaces of equal volumes of rock, each composed of particles of uniform size and shape, are to each other as the theoretical mesh or the reciprocal of the diameter of the particles composing the respective masses.
Suppose the surface S to be made up of X1 parts (by weight) of M1 mesh .(theoretical), x2 of M2, x3 of.M3, etc. xn-of Mn. Then
S = k∑1n x M ;
that is, the summation of the weights by the theoretical meshes, where k is a constant, six times the volume of unit weight of the rock. If different rocks were considered, specific gravity would enter into the value of k. Likewise,
S’ = k∑1nx’M’
Now where S was the surface existing on the mass before breaking, and where S’ is the total surface existing after the breaking, the new surface
S’- S = k∑1n (x’M’ – xM)
For a given screen analysis, weights of the different theoretical meshes, we may plot on co-ordinate paper x against M and x’ against M’, and obtain a crushing-surface diagram (Fig. 3) representing the equation
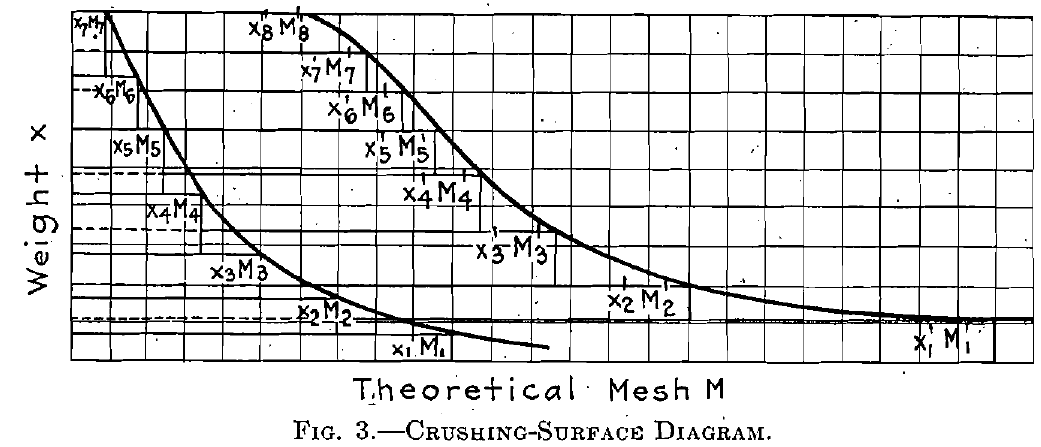
above given for new surface, the area between the steps being proportional to the difference in surface area: If we take closer divisions of M, smaller differences in x will result, and the limits of such divisions will result in the smooth curves, the area between which is a true measure of the surface produced.
Thus on the Rittinger theory that surface produced is proportional to energy applied the area of the diagram is a measure of the energy going into the crushing. (It should be distinctly understood that bearing- and gearing-friction losses should not be included in the energy-applied measured by the crushing-surface diagram, and that it is therefore impossible to compare the two laws by. tests upon commercial machines, unless the friction losses are known.)
The Crushing-Surface Diagram:
The crushing-surface diagram has the advantage over any other graphic method of comparing screen analyses, that it shows at a glance the “classification” of the pulp, the distribution of the surface, and (according to the Rittinger theory) the energy spent in its production. As the cards of a steam engine enable us to determine the power developed, and to locate faulty operation or design, so the crushing-surface diagram enables us to determine the power consumed, and to locate points at which the crushing practice may be improved and faults remedied in design.
From my original article on The Crushing-Surface Diagram, I take Fig. 4 and the following theoretical proof of the Rittinger theory:
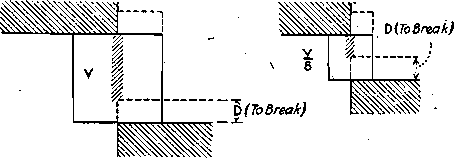
Fig.- 4 Rittinger’s Law
100 – Mesh Cube 200 – Mesh Cube
Area one section = A Area one section = A/4
Average resistance to shear per sq. in. = F
Energy = FAD Energy = F A/4 D
Surface Produced = 2 A Surface Produced = 2 A/4
Energy Proportional to the Surface.
Suppose it were possible to hold two similar cubes between the two offset faces as shown, and that forces were applied until the deformation shown by the dotted lines was obtained, it will be seen that only the molecules along the vertical center line
[it should read plane] are stressed and deformed, the mass of the cube away from this surface receiving practically no pressure or deformation. The energy in this case required to produce rupture will be the product of the average resistance to shearing per square inch by the area along which rupture takes place, and by the distance the two offset faces move together. The average resistance to shearing is a variable quantity, as the deformation increases up to rupture. To reduce to cubes, this amount of energy must be multiplied by three, as three similar fracture planes must be made to produce cubes. And it will not be hard to see that the distance through which the offset faces must move in either case must be the same and not proportional to the thickness of the piece. To break the molecular bond between adjacent particles would require the same movement, regardless of the thickness of the piece.
“It will be noted that if eight of the half-diameter cubes be sheared to produce cubes of half their size, the new surface presented will be double that formed when the single large cube is sheared into half-size cubes, and also that the energy required in the case of the smaller cubes is double that required in the case of the larger cubes. This should demonstrate that energy applied, to crushing is proportional to the surface produced.”
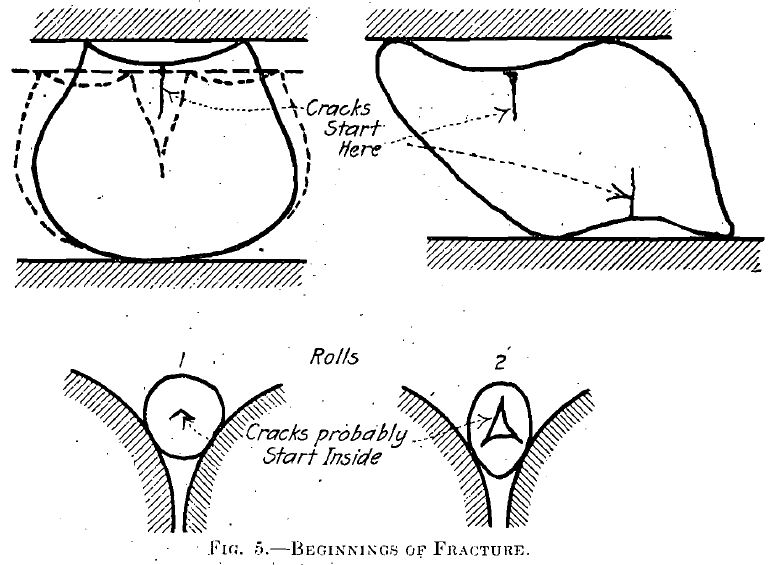
Of course the above passage states a theoretical case of shear, and it is not to Ire expected that cubes can be held in the manner shown; in practice the breaks occur, perhaps, as in Figs. 1 and 5,
New units are apparently necessary when using the crushing- surface diagram. The term “mesh-grams” as a proposed unit for crushing constants and measurement of surface I have defined.as “the surface produced by a theoretical crushing operation in which one gram of particles of the same diameter are all reduced to a diameter whose reciprocal is one greater than before reduction. The unit “mesh-ton” i have similarly defined as “the increased surface produced by crushing
all particles of a ton of rock to a diameter whose reciprocal is one greater than in its previous condition.”
As the crushing contemplated in the definitions is only theoretically possible, a couple of examples may explain them better. Shapes remaining the same, preferably cubes for argument’s sake, during all stages of the crushing, if 1 g. of 0.1-in. rock (reciprocal, 10) be crushed until it is all 0.05-in. (reciprocal, 20), the new surface produced is 10 mesh-grams. Or if 10 g. be reduced to exactly 0.01-in. from exactly 0.1-in. particles, there will be an increase of 10 times 100 minus 10 times 10,. or 900 mesh- grams. Mesh-pounds, mesh-ounces, mesh-percentages, etc., are similarly justified and defined.
The term “mesh” for a measurement has been objected to, as ambiguous in meaning. Some other short term may be desirable to take its place in forming these compound names for surface produced. But nothing better has been suggested. “Reciprocal” (of diameter) is too general and too long; “theoretical mesh-tons” is likewise too long and is also liable to misinterpretation; “dia-ton” has been suggested; but it would hardly do to speak of “dia-grams” in connection with a diagram. Perhaps “pitch-grams,” “pitch-tons,” etc., would be satisfactory, pitch being defined as the theoretical mesh or reciprocal of diameter(probably in inches). I would here again point out that these quantities are measures of surface, and that the weight element is only permitted to enter on the basis of equal specific gravity; where the specific gravity varies, a correction must be made for it.
Again I quote from my original paper my interpretation of Kick’s law, Stadler’s statement of which I have given above:
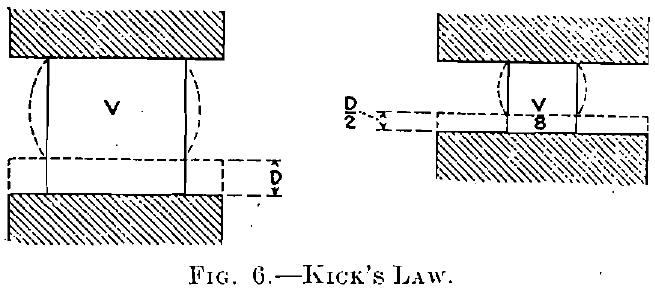
100 – Mesh Cube 200 – Mesh Cube
Area one section = A Area one section = A/4
Average resistance to shear per sq. in. = F
Energy = FAD Energy = F A/4 D/2 = FAD/8
Energy Proportional to the Volume.
“This law does not apply so much to crushing as to deformation of bodies before rupture takes place.
“In Fig. 6 are represented two particles of ore ‘of equal technological state,’ shown as cubes between the faces of a crushing or testing machine. Assuming the theoretical mesh, equivalent to the reciprocal of diameter, and using concrete values, we have a 100-mesh particle with eight times the volume of the 200-mesh particle, and with an area per face four times that of the 200-mesh particle. The dimensions are as two to one, and the bodies being similarly deformed within the elastic limit without fracture, the energy that must be applied in each case to produce this deformation is the product of the average resisting force per square inch, the same in both cases, by the area worked against and by the distance through which this average force works. As shown in the figure, in this particular instance the energy absorbed is proportional to volume, and it can be similarly shown for the general case. On the gradual release of the external pressure the energy absorbed is given back to the machine producing the deformation [better, which produced the deformation] and the body returns to its original shape. It should be noted that the body has been deformed only by a gradually increasing pressure, the first increment of deformation not requiring so much pressure as the last. In case the body has been deformed beyond its elastic limit either the whole mass of particles have been reduced to the molecular state by the freeing of their bonds with adjacent particles, which never happens, or fracture takes place along a few surfaces by the breaking down of some of the weaker bonds, and the particles thus formed are free to resume their original shape in so far as they are not held between the machine surfaces. The energy given up by them is probably used in some sort of lever action in making fracture planes. So the energy absorbed according to Kick’s law does not stay in the particles after pressure is released and therefore this does not govern to any great extent the amount of energy absorbed in crushing.”
Kick’s Law:
It is evident to the engineer that Kick’s law as explained above is but another form of the law of elastic bodies: namely, that within the “elastic limit” stress is proportional to deformation.
There is no incompatibility between the Rittinger theory and the laws of elastic bodies such as glass, steel, rock, etc. Up to the elastic limit, deformation is proportional to stress, and absorbed energy is
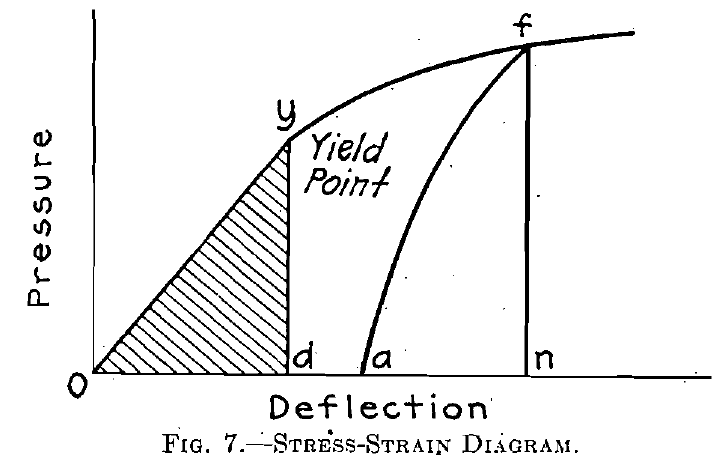
proportional to the volume of the particle stressed, according to Kick’s law. In Fig. 7 the area Oyd is a measure of this energy. When pressure within the elastic limit is released the body returns to its former shape, there having been no interior breaks so far. When, however, the elastic limit has been exceeded, certain local ruptures have taken place within the body at points weaker than others; these breaks occur consecutively or simultaneously at various places within the body, and upon release of pressure the body is found upon careful measurement to have taken on a permanent “set.” The first fracture noticeable occurs after several ruptures have weakened the body at one point, which, may be along a plane of greatest resultant stress, or of structural weakness. Referring back to Fig. 7, the elastic limit having been exceeded, as pressure is gradually, released, its relation to the deformation is shown by the line af, the area afn being a measure of the energy given back to the machine (by Kick’s law), while the area Ofa is a measure of the energy absorbed by the local breaks, which may or may not have become visible. In the case of a wrought-iron or mild-steel test bar undergoing tension between the jaws of a testing machine, local ruptures are probably occurring throughout the bar, reducing the section at those points of weakness, and putting greater load upon adjacent particles which may be then able to carry the load better.
The final rupture of the steel bar occurs when a number of local breaks , at one particular section have so weakened the bar that all the work the machine is doing is concentrated at that section, as shown by the “necking in” just before failure takes place. Unquestionably in spite of the permanent set in the test specimen away from the point of failure, the majority of the crystals composing the specimen are in the
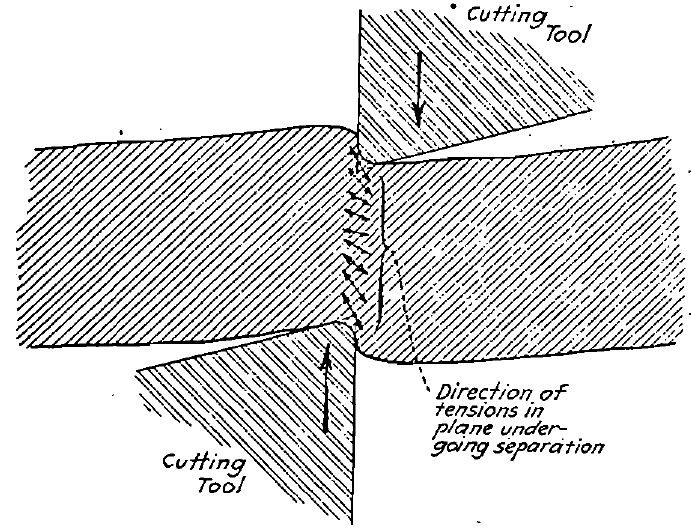
Fig.- 8 Shearing Metal Bar in Commercial Machine
same form as before the test, but some have slipped away from others and there is a new adjustment due to the failure of the few which could not hold on, the others at that section being in position to support the load for a further period. If it were wrought iron, we could say the fiber slipped along the slag or impurities between fibers until the slipping fibers were crowded so that they obtained a sort of “strangle hold.”
In the case of the shearing of iron and steel bars, it has been shown that the depth of penetration (the distance traversed by the cutter before separation takes place) is not proportional to the thickness of the metal, as it would be in case Kick’s law applied, but is proportionally greater in thin sheets than thick—about 75 per cent, of the thickness in the case of sheets 1/8 in. thick, and about 25 per cent, in the case of sheets 1 in. thick. On the face of it, this fact does not uphold the theoretical argument for Rittinger any more than for Kick, but let us look farther.
In a commercial shearing machine we do not get true shear, but a condition shown in Fig. 8. The material is compressed under the blades of the shear, which are themselves somewhat distorted during the operation, and failure is due to tension in a line inclined to the plane of the cutting edges. In the case of a thick plate there would be more deformation of the cutting edges due to the higher resistance of the material, and more of a width concerned than in the case of thin sheets. When a hole is punched in steel, there is a volume of material around it that must be removed for first-class work; this volume is probably full of minute fractures the area of which
cannot be measured. I am told that rock crushed for concrete, is seen upon microscopic examination to be full of minute fractures, due to the crushing, which cause each piece to be weaker than a natural pebble of the same mineral and size. If the rock were uniformly full of these invisible fractures; Kick’s law would apply in spite of all our theoretical reasoning. Just as in the case of the hole punched in steel, I believe that these minute fractures in the rock are close to the fracture planes.
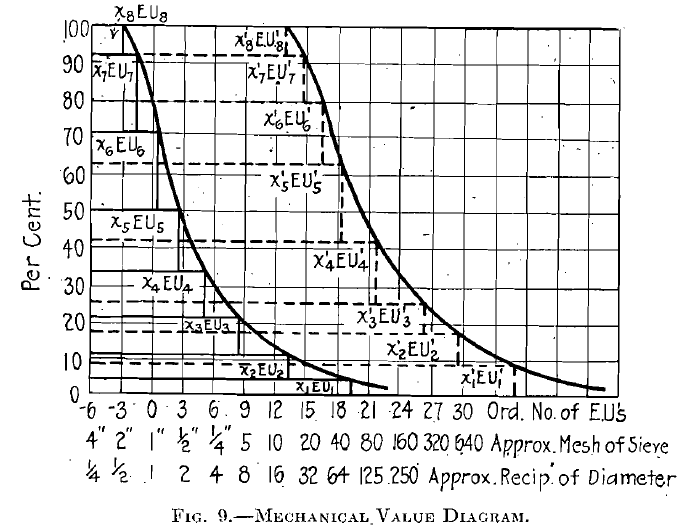
A. F. Taggart, has discussed Kick’s law thoroughly from the standpoint of its advocates and there is no reason for a repetition of his work. However, taking it at their valuation, and using data obtained from Stadler’s papers already referred to, we can by reasoning similar to that, already employed develop a diagram for energy absorbed similar to the crushing-surface diagram. (Fig. 9.)
With constant weight and similar shapes, Stadler allows one energy unit (E. U.) for each reduction to one-half the volume immediately preceding. Expressed mathematically,
(D/d)³ = V/v = 2(E. U.)
Or as more frequently expressed,
log V – log v = (E. U.) log 2
hence (E. U.) = (log V – log v)/log 2 = 3(log D – log d)/log 2
D and d being initial and final dimensions, V and v being initial and final volumes. For example: Reducing 1-in. cubes to one-half volume, 1 E. U. has been expended; reducing to one-fourth volume, 2 E. U.; to one- eighth volume, 3 E. U.; to one-fourth dimensions, 6 E. U.; to eighth dimensions, 9 E. U.; and so on. Reducing from 100 in. diameter to 1 in. the same number of E. U. are expended as from 1 in. to 0.01 in., or as from 0.01 in. to 0.0001 in. (all on quantities of’ the same volume, both here and in the previous sentence). Of course various sizes are produced in crushing, and each grade or size has a different value, the same reasoning applying as in section 4, above.
Suppose the mechanical value W be made up of x1 per cent of E. U.1, x2 per cent, of E. U.2, etc. xn per cent, of E. U.n; then
W = c ∑1n x E. U. before the crushing operation and
W’ = c ∑1n x’ E′. U′. after crushing
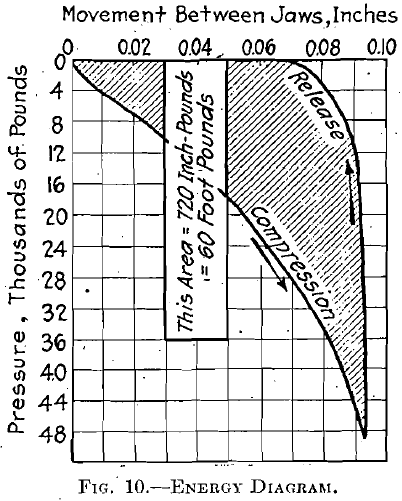
The new mechanical value, W – W′ = c ∑1n (x E. U. – x′ E. U′.). Plotting x against E. U., we have, when the limiting curves are drawn, a diagram (see Fig. 10) similar to the crushing-surface diagram, the area of which is a measure of the mechanical value of the crushing operation or the energy units (E. U.) absorbed. (Percentages should be expressed decimally in the above calculations.) The mechanical value of sands given in E. U. from the diagram is multiplied by the tonnage per day (or hour) and divided by the horsepower, giving the relative mechanical efficiency.
The E. U. per foot-pound applied upon 100 g. as found from these mechanical-value diagrams compared with mesh-grams’ per foot-pound as found from crushing-surface diagrams for the same crushing operation will, if covering a range of operations show which of the two laws under consideration is consistent with the facts. This is the method used in comparing my results. (In Fig. 9, it will be noted that the theoretical mesh or reciprocals of diameter are designated at the corresponding “Ordinal numbers of energy units,” which is self-explanatory, and perhaps permits easier comparison with the crushing-surface diagram for the same crushing operation.) The following comparisons based upon the experimental work performed show that the Rittinger theory applies to crushing operations and that Kick’s does not. There are discrepancies when we apply the Rittinger theory; but’these can be explained reasonably by considering the expenditure of energy upon the sizes finer than our screen permits our measuring, which must present considerable
surface, if we assume that the curve of the screen analysis continues to follow the same law into the finer sizes as among those already measured.
Method of Tests:
In this work one or many pieces of rock were compressed between the faces of the Amsler-Laffon hydraulic testing machine in the Laboratory for Testing Materials of Purdue University. (This machine is described in the appendix.) The movement between the faces (similar to those of a crusher) was measured by a deflectometer having a vernier on which movements of 0.001 in. could be read, while the pressures between faces was read upon a dial to a maximum of 150,000 lb:. The product of the average pressure (or rock resistance) by the distance through which that pressure was exerted is work or energy, and easily reduced to foot-pounds. I found it easier to plot my results as obtained, pressure against distance, as. shown in Fig 10, the area of the closed curve, completed by the record of pressure and distance when pressure was gradually released, being a measure of the energy in inch-pounds (divided by 12 equals foot-pounds). This energy as foot-pounds, or as horsepower-hours, can be compared with the surface produced as shown by the crushing-surface diagram of the screen analyses of initial and final products of the operation; and it can likewise be compared with the energy units (E. U.) of Stadler, as shown by mechanical-value diagrams similar to Fig. 9. By crushing the same amount of rock from coarse to medium, from medium to fine, from fine to very fine, etc. (coarse and fine being merely relative terms), the two laws may be compared through a sufficient range to detect any abnormal results or inconsistencies.
To each test, whether it involved one or several consecutive crushing operations, was given a letter by which it is designated throughout this paper. My records are in the form of crushing-surface diagrams with the weights marked to place as plotted. From these the mechanical- value diagrams must necessarily be derived, as this work was not undertaken primarily to settle the case of Kick vs. Rittinger. The pressure- deformation curves were plotted directly in a similar manner without recording numerical readings. The advantage of recording by plotting the observations directly upon co-ordinate paper is the speed at which it is done, and the check afforded by the shape of the curve. It is hoped that the work will be acceptable in its present form, as numerical tabulations would add nothing of value to this paper. So far as possible the results of calculations are given in the diagrams, and hence it will be unnecessary for the reader to refer back and forth from text to diagram to any great extent.
As the crushing-surface diagram does not depend upon any definite system of screens so long as the aperture be known, all the screens used were measured with a Bausch & Lomb microscope having a scale reading to 1/1500 in., and the reciprocals of diameter of these apertures were used in plotting.
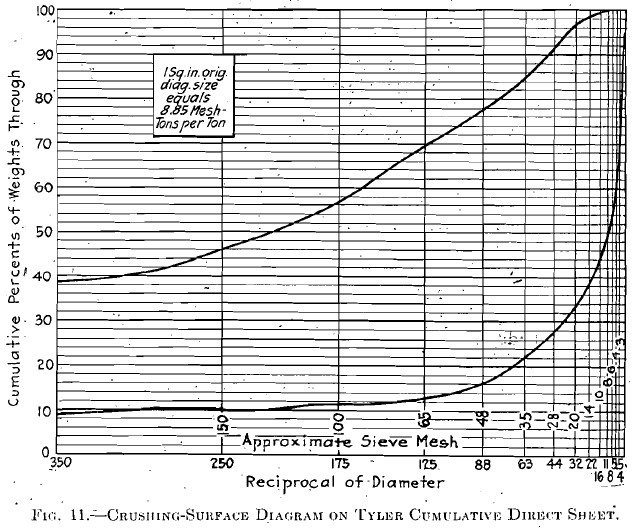
Certain of the finer sizes were screened through bolting cloth held in embroidery frames. I have suggested specially prepared plotting paper, i. e., with vertical lines drawn in at the reciprocals of diameter corresponding to the apertures of the screens used, for such cases as the Tyler standard screen-scale sieves, or the I. M. M. standard. Since this paper was first submitted to the Institute and of course since the work was done, I have discovered that cumulative direct diagram sheets with Tyler S. S. S.
sieves are desirable for this work and that there is no need of any other sheets for crushing-surface diagrams. Fig. 11 shows a crushing-surface diagram on this paper, the plotting running in the opposite direction from that for which it was designed; 1 sq. in. on the regular sheet, with, screen sizes located as indicated, representing 8.85 theoretical mesh-tons of surface per ton of ore crushed.
All results have been modified to a basis of 100 g., so that percentages required for use with E.U. are readily obtained, about one-third of the tests having been made upon a definite 100 g. In none of the
tests was any attempt made to account for the losses occasioned by fine dust floating away, or by coarser pieces shooting off as they were fractured. In no case could these be more than 2 per cent., which would not materially affect the results. Extreme accuracy was not particularly necessary in this work. It was rather a reconnaissance; and if more than three, significant figures are given at any point, too much importance should not be attached to the last figure. At the same time the work was carefully done and the record carefully made, but there is so much unknown that I would not care to defend the fine details of my results.
Record of Tests:
In Fig. 12, A and B are results obtained upon a tube-mill feed, a fairly siliceous gold and silver ore from Mexico, of which 100g. of — 5/16-in. + 4-mesh pieces were crushed by two movements of the machine, without
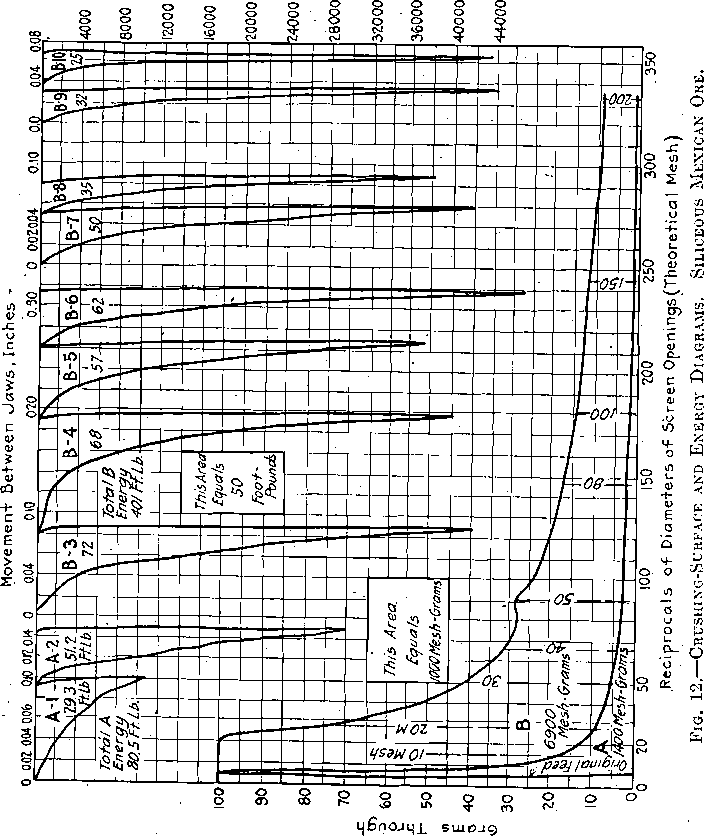
intermediate screening, the purpose being to crack every piece. The energy is represented by the areas A-1 and A-2. It is of interest to note how the release of maximum pressure is usually accompanied by some movement of the jaw, as in this case, indicating a return, of energy to the machine, shown in the diagram by the slight curve back to the zero-pressure line. After the particles adjusted themselves upon release of the pressure it took more movement between the crushing faces to get up to the previous pressure, as indicated by the gap between A-1 and A-2. After sizing and plotting the screen analysis in the form of a crushing- surface diagram A, the particles were re-crushed eight times, each time being screened through a screen of about 30 mesh to remove the fines and eliminate the condition of “choke crushing” as far as possible, the oversize only going back to the machine. The energy areas for these eight crushings are B-3, B-4, B-5, B-6, B-7, B-8, B-9, and B-10; the screen analysis is plotted as a new side of the crushing-surface diagram, B. The areas of the energy diagrams A-1 and A-2 were found by planimeter to be 1.40-and 2.38 sq. in. respectively, a total of 3.78 sq. in. One square inch, for the scales.used, being equal to 250 in.-lb. or 20.83 ft.-lb., 3.78 times 20.83 or 80.5 ft.-lb. of energy was expended in making the crushing A. By similar reasoning, the area of the crushing-surface diagram A, as found by planimeter (as far as screening was carried but, to the 200-mesh sieve), multiplied by the value of its unit area in mesh- grams, shows that 1,400 mesh-grams of surface was produced. From these two quantities, a value of 1400/80.5 = 17.3 mesh-grams per foot-pound (+200-mesh sieve) was obtained, as the constant to be used in calculating efficiencies, etc., for this rock. Note, however, that the mesh-grams entering into this constant are only those “plus” 200-mesh sieve, and that there are perhaps more mesh-grams in the “minus” 200-mesh than in the “plus,” and they must at some time be taken care of in calculations. It is these “minus” mesh-grams which will account for the discrepancies in results by Rittinger’s theory, and which will not account for discrepancies in results by Kick’s law.
For B, the total energy expended was 401 ft.-lb., producing 6,900 mesh-grams ( + 200-mesh sieve) giving a unit value of 17.21 mesh- grams per foot-pound “plus.” Fines were screened out after each jaw crusher movement, to reduce “choke crushing.”
Tests E, F, G, H, J, K, L, M, and N were made upon Bedford limestone, the first in July, 1912, and the rest in July and August, 1913. This is one of the best known building stones in the United States. It occurs in great beds in southern Indiana, is oolitic in texture (weathering brings out myriads of fossils) and, because of its apparent uniformity, is probably as good a rock as could be selected for a standard. (I reserve the right to change this opinion later.) The particular specimens came from stone furnished for the Purdue Library building.
The crushing surface diagrams of E and F (Figs. 5 and 4 in my original article in the Engineering and Mining Journal of May 24,1913) are not shown here. In E, practically all the material was broken in the machine, whereas in F, a great many pieces between 30 and 80 mesh were not broken, but simply had their edges rubbed off. My records as to F
do not clearly show whether I screened between crushings; this was done in the case of E.
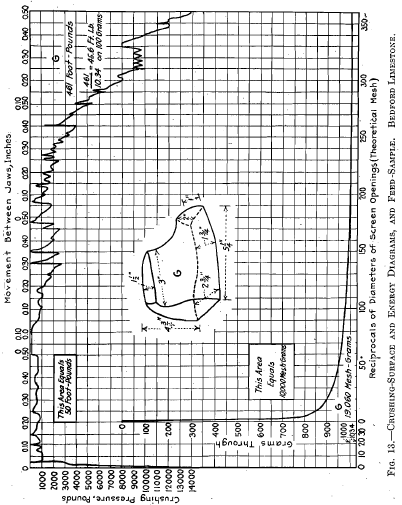
Test G was on a block of the dimensions shown in the small sketch in Fig. 13, having a superficial area of 63 sq. in. and a weight of approximately 1,031 g. The energy curve is rather long drawn out after the first break, and the irregularities in this curve may be explained
as due to frequent ruptures of fairly large pieces where the load drops back almost to zero. A total movement of nearly 2 in. is recorded: here only one or two pieces perhaps were resisting, while in some of the other cases a great many pieces were resisting at one time. At the end of the first ½ in. of movement the finer pieces were screened out, and the larger returned to the crushing zone; these pieces being rather flat; about 2 per cent, of —200 mesh being produced.
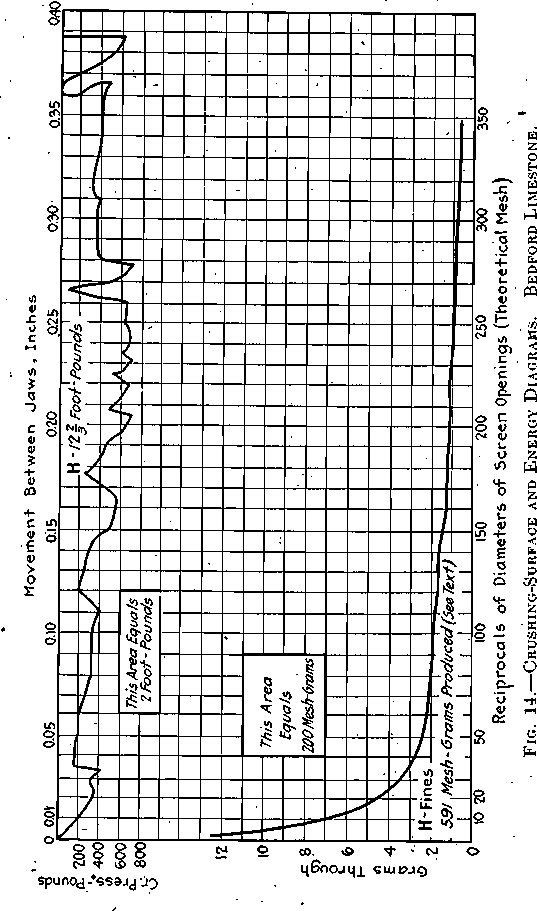
H, shown in Fig. 14, covers the results of crushing four pieces, having a total superficial area of 30.25 sq. in. and a total weight of 175.5 g. After crushing, eight pieces weighing 163 g. had an area of 30.25 sq. in., just, offsetting the original area, while the remaining 12.5 g. were screened, and the results were plotted as a crushing-surface diagram. 12.66 ft-lb. were expended in crushing the 175.5 g., equivalent to 7.2
ft-lb. per 100 g.; the eight pieces noted above were estimated to be the equivalent of 60 per cent, of 1 in., 32.5 of ½-in., and 7.5 of fines, as recorded in the crushing-surface diagram. The energy curve is irregular as in the case of G and for the same reason, movement was 0.4 in.; there was no intermediate screening.
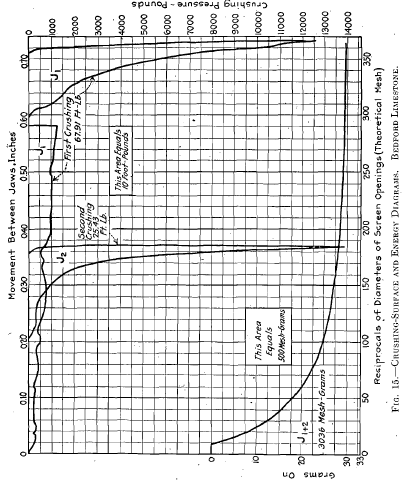
In J (Fig. 15) a single rectangular piece about 1 by 1.25 by 1.25 in., weighing 33 g., was crushed to pass a 10-mesh sieve, with one intermediate screening. After a deformation of about 0.6 in. was recorded
without great-pressure, the pressure goes up very rapidly, probably by reason of the packed condition of the particles, a great number resisting crushing. After screening out the —10 mesh, a similar energy curve is obtained on the + 10-mesh pieces. The crushing-surface diagram repre¬sents the combined product from both crushings. In both cases, the
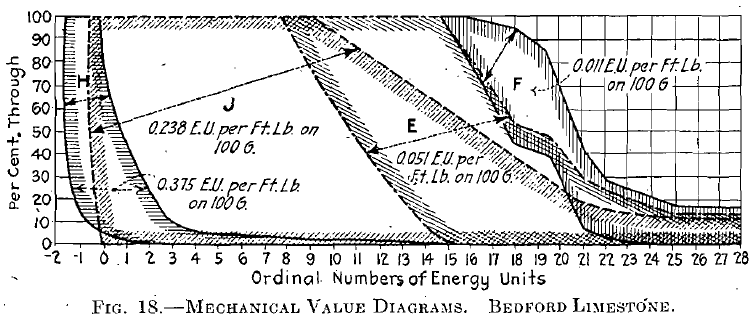
packed condition, in which the particles rub on one another and produce much —200 mesh, accounts for the low value of the mesh-grams per foot¬ pound.
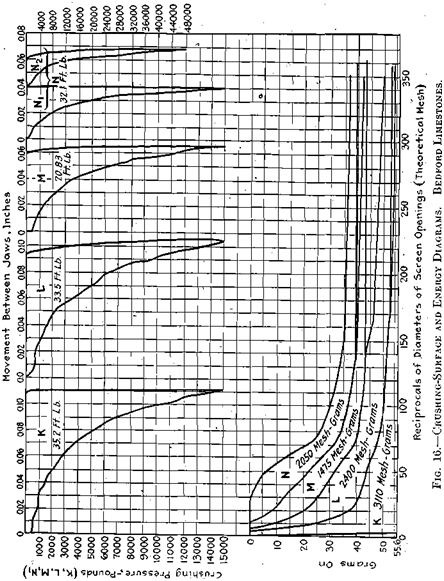
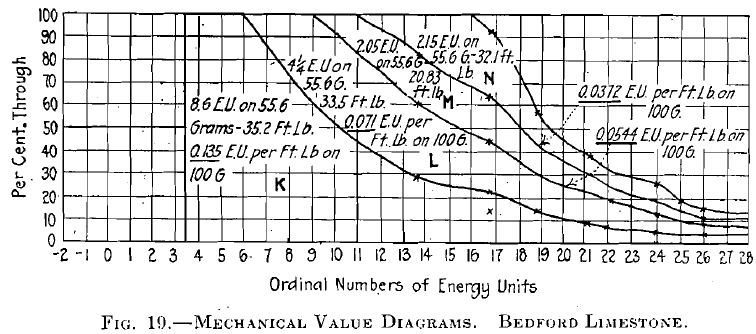
Fourteen very flat pieces weighing 55.6 g., with about 20 sq. in. of surface, averaging in size about 0.75 in. sq. by 1/8 in. thick, were subjected to four separate crushing operations, K, L, M, and N, as shown in Fig. 16. The first crushing K was continued until every piece was found to have been broken at least once; screen analysis was then made and recorded in the crushing-surface diagram, and the material +100 mesh was recrushed as L. M is the result of crushing in a similar manner the +80 mesh from L; and N is similarly the result from the +80 mesh of M. Each crushing was carried as far as the record shows without attempting to remove any fines, although in the case of N pressure was released once and then reapplied, as recorded, in an endeavor to apply more energy. The base lines of L, M, and N separate from the discharge or product lines of the preceding operations, showing the smaller quantities of material crushed in each case.
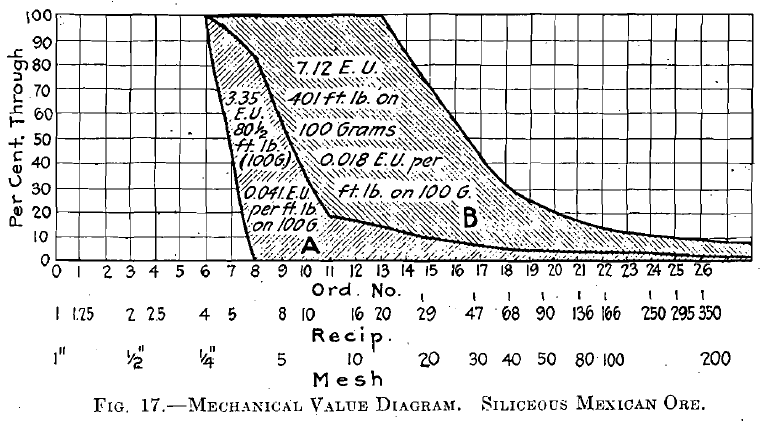
In Fig. 17 the results obtained in A and B on the siliceous Mexican ore have been plotted in a mechanical-value diagram. For the coarser crushing A, 0.041 E. U. per foot-pound-applied on 100 g. was the result,
while in the case of B only 0.018 E. U. (etc) resulted, 125 per cent, more being produced when the coarser crushing was done. If graduated crushing had not been done, more energy would have been expended upon the —200 mesh; and I believe this discrepancy would then be greater.
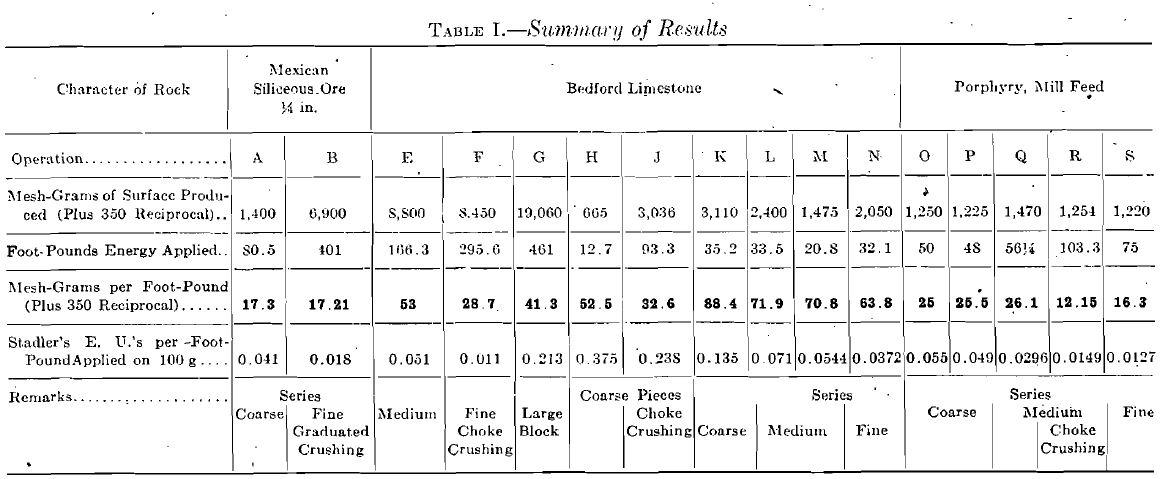
In Fig. 18, E, F, H, and J (Bedford limestone) have been plotted as mechanical-value diagrams. Note how the E. U. per foot-pound applied on 100 g.,decrease consistently from coarse to fine: H, 0.375; J, 0.238; E, 0.051; and F, 0.011. Similarly in Fig. 19, K, L, M, and N are plotted to E. U. diagrams with results decreasing consistently from coarse to fine: K, 0.135; L, 0.071; M, 0.0544; and N, 0.0372 E. U. per foot-pound-applied on 100 g.
On another ore, an Arizona porphyry, a series of crushings similar to K, L, M, and N, gave results from coarse to fine as follows: O, 0.055; P, 0.049; Q, 0.0296; R, 0.0149; S, 0.0127; all E. U. per foot-pound- applied on 100 g. The range of sizes was small; the initial feed averaged
about 4 mesh, while all five crushings resulted in the production of not more than 8 per cent, of -200-mesh sieve product. This work was done in December, 1913.
Fig. 20 shows the results of plotting an approximate average of feed and discharge for all tests against both the E. U. per foot-pound- applied on 100 g. and the mesh-grams per foot-pound (+350 reciprocal).
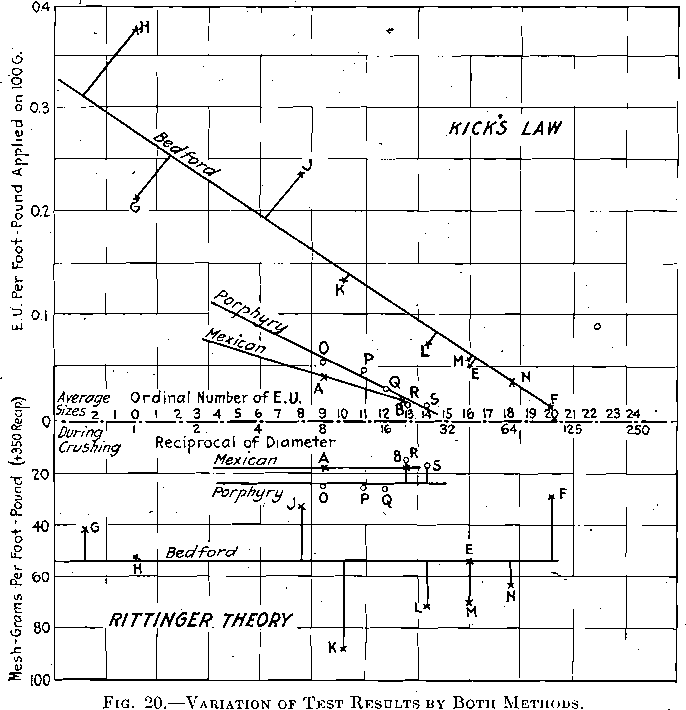
The estimated average, taken as near to the center of gravity of the mechanical-value diagrams as possible by ocular observation, gave the horizontal position of each point, while the calculated E. U. and mesh- grams gave the two vertical positions.
In the upper diagram the inclined line (Bedford limestone) connecting the various points shows that for different average sizes of material undergoing crushing, the production of E. U. per foot-pound-applied on 100 g. decreases from coarse to fine; according to Stadler’s interpretation of Kick’s law there should be no decrease, they should be the same at all sizes. From the values tabulated in Table I, which is a summary of all these tests and calculated results, it will be found that for the Bedford limestone, the coarsest crushing gave 34 times the number of E. U. per foot-pound-applied on 100 g. that the finest crushing gave. For the other materials, the graphs incline similarly and in sufficient degree to show the fallacy of Stadler’s application of Kick’s law.
In the lower diagram produce the same number of mesh-grams at all sizes, then the Rittinger theory is correct, and a horizontal line represents it in this diagram. If some of the discrepancies be explained as due to “choke crushing,” producing an excess of unmeasurable —200 mesh (— 350 reciprocal), the majority of points will come nearer to a horizontal line, and better confirm our belief in the Rittinger theory. The results clearly show that the Rittinger theory is so much more nearly correct for crushing operations, that I believe we can accept it and use it for the determination of crushing constants, for machine comparisons, for efficiency tests, etc.
Since it is obvious that the sizes finer than our ordinary screens will separate are important if the Rittinger theory be correct, finer screens or classification followed by microscopic measurements will probably be necessary for accurate determinations. To some extent at least, we can approximate the quantity of the finer sizes; there seems to be a law connecting the quantities of different sizes, that the discharge line of a crushing-surface diagram from a uniform crushing operation will be in the form of a hyperbola, and, when plotted on logarithmic paper, as in Fig. 21, will appear as a straight line. In Fig. 21 the product line of N indicates that it would have some 4 per cent, of 1,000-reciprocal size and some 0.6 per cent, of 10,000-reciprocal size; they have surfaces respectively equivalent to 40 per cent, of 100 reciprocal, and 60 per cent, of 100 reciprocal, taken separately; and if these values are correct, these sizes are fully as important in the consideration of energy disposal as all of the + 100-reciprocal material. The law of the finer sizes might be something of this form:
RWX = C
R being the reciprocal of the diameter (theoretical mesh) under consideration; W, the weight of the material passing through a screen of this diameter opening; and x, a constant depending upon the character of the
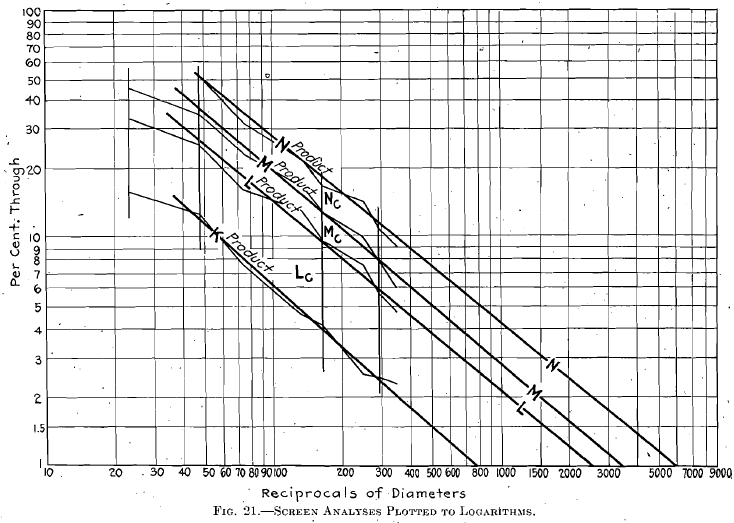
ore, the type of machine in which crushing is done, and possibly upon the screen analysis of the feed; and C, the number of crushing units.(mesh- grams, mesh-tons, etc.). in the undersize, considered as all of that one size, and proportional to the area between the co-ordinates of the point on the curve (intersection of C and W) and the zero lines.
This, however, is largely speculative, and is only suggested because it may be of some value to some future investigator.
Summary of Results:
Table I gives a summary of results. It will be noted that in most cases the high values for mesh-grams per foot-pound were obtained with low values in foot-pounds, and vice versa. This seems to indicate that the highest values and therefore the most efficient crushing would be obtained when each particle was just cracked; a thing that is generally understood to be true in connection with rolls, for example, free crushing being, within limitations, more efficient than choke crushing. Choke crushing here gave uniformly, low results, as might be expected. In the case of B, the several crushing operations involved small amounts of power, but they were lumped together for final screen analysis. If all the power had been applied at one time, without intermediate screening, there would not have been such a nice agreement in the mesh-grams per. foot-pound, between A and B.
As the writer sees the situation, after the acceptance of the substantially correct theory of crushing, there must be recognition of the fact that rocks of varying characteristics are met in crushing operations, that these rocks offer different resistances to crushing, and that it is unfair to compare the operations of two crushing machines upon dissimilar ores (even if they look alike) until some values are given to the resistance or energy absorption of these rocks under crushing conditions. Probably these units will be determined practically by applying a definite amount of energy to a definite weight of the rock, all of a predetermined standard size. The work of determining these constants should be done thoroughly by competent hands. The matter of checking my conclusions can be accomplished perhaps in several of the school testing laboratories of the country. No elaborate apparatus, and apparently no very high degree of accuracy, will be required to prove that Kick’s law is of no use to mill operators and engineers.
This paper has been prepared under some disadvantages which may account for the possible lack of logical arrangement. The matter was originally submitted to the committee of the Institute in May, 1914, and upon their suggestion the paper was enlarged, corrected, and rearranged. The writer acknowledges his indebtedness to their suggestions. Acknowledgement should also be made of the courtesies extended by Dr. W. K. Hatt, head of the department of Civil Engineering, and Professor Schofield, at Purdue University, who allowed the writer free run of the laboratories for Testing Materials.
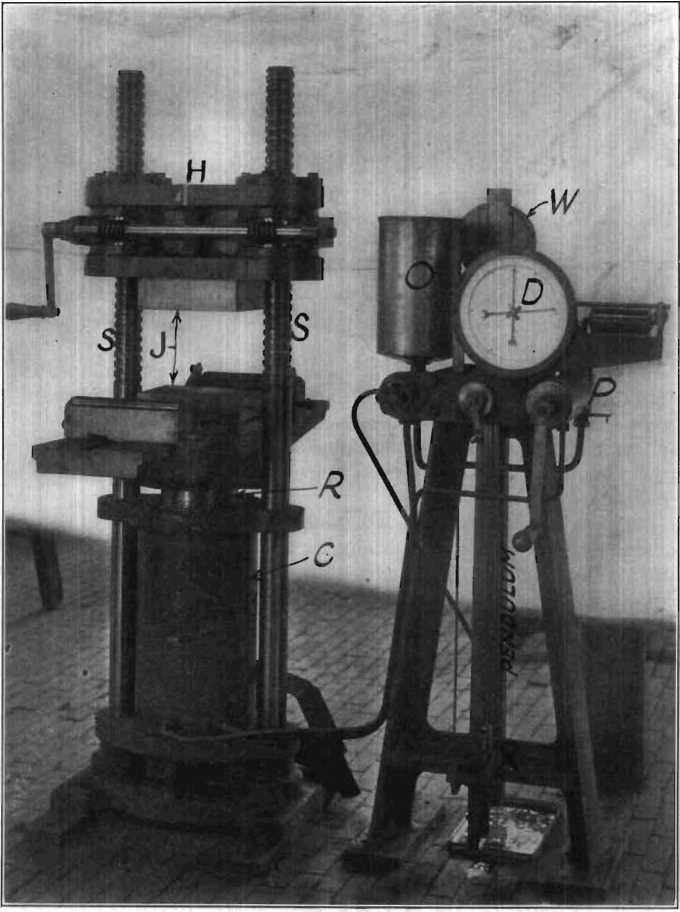
Fig.- 22 Amsler-Laffon Testing Machine
Appendix:
The Amsler-Laffon hydraulic testing machine, with which these experiments were made, is shown in Fig. 22.
The material is crushed between the faces of the jaws J by pressure applied against the ram R, contained in the cylinder C. The head H carrying the upper jaw can be moved up and down the fixed screws S by nuts having worm-wheel threads cut on their outer surface into which mesh two worms driven by the hand crank shown to the left.
The pump P for supplying the pressure to the ram cylinder C is operated by a hand screw on the side of the frame carrying the registering and auxiliary mechanism. Suitable piping connects the pump with the cylinder, the supply tank O and the registering cylinder X. From X suitable links and levers connect to the pendulum and adjustable weight W, the swing of the pendulum, which is proportional to pressure exerted, being recorded on the drum or indicated upon a dial D. In all of this work the readings of the dial were used. With different settings of the weight W, four different scales of pressures having maximum values of. 15,000, 50,000, 100,000 and 150,000 lb. may be used, suitable dials being provided.
The deflectometer, which is a part of the regular laboratory equipment, consists of a lever carried at its fulcrum in a suitable base. At the short end of the lever a fine-thread vertical adjusting screw can be brought into contact with the upper jaw J of the machine, while the long end of the lever fits against a vertical scale, and’moves a vernier with it’ as it moves up and down, thus permitting the measurement to 0.001 in. of the movement between jaws.
Kick VS Rittinger : An Experimental Investigation in Rock Crushing, Performed at Purdue University, BY ARTHUR O. GATES
