Effect of Mill Speed on the Energy Input
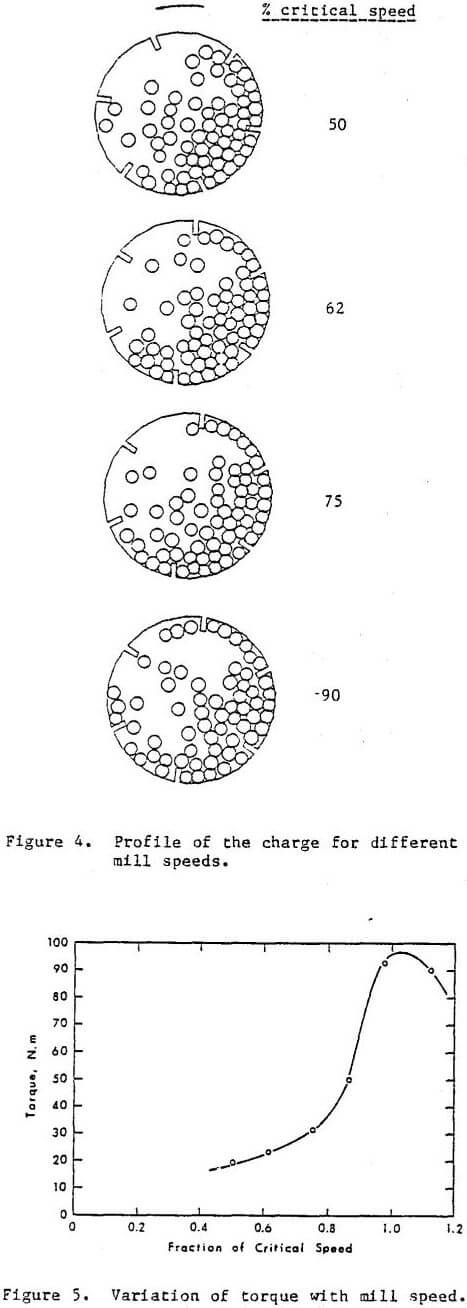
In this experiment the overall motion of the assembly of 62 balls of two different sizes was studied. The mill was rotated at 50, 62, 75 and 90% of the critical speed. Six lifter bars of rectangular cross-section were used at equal spacing. The overall motion of the balls at the end of five revolutions is shown in Figure 4. As can be seen from the figure, the overall motion of the balls changes with the mill speed inasmuch as the shoulder height shifts with the speed and the charge pressure reduced with the speed. At the highest speed the outer layer of discs tends to stick to the wall, showing a tendency to centrifuge.
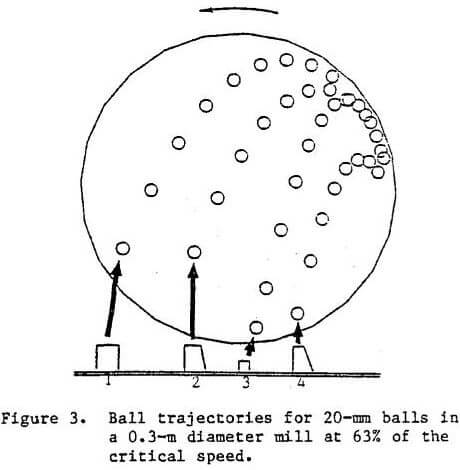
The effect of mill speed on energy input was studied in a mill of 0.3-m diameter and 0.25-m long with 40% charge filling. The total charge weight was 54 kg. The variation in torque with speed is shown in Figure 5. It is seen from the figure that the energy input increases with mill speed and then drops off; this behavior is also observed in laboratory experiments.

Effect of Liner Profile on the Trajectory
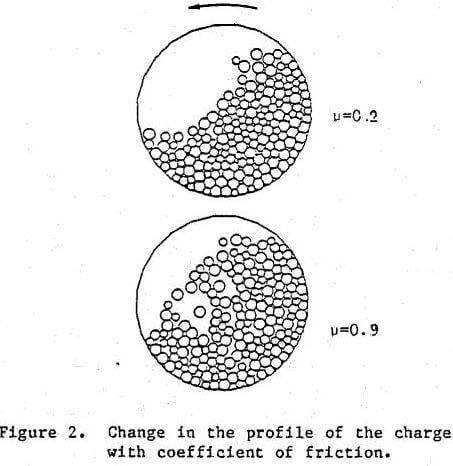
Figure 3 shows the trajectory of a disc as the face angle of the lifter bars decreases. The speed of the mill was kept at 63% of the critical speed. The face angle was varied from 90 to 111 degrees for the three types of configuration 1, 2 and 4, as shown in the figure. Also, the height of the lifter bar in configuration 3 was changed to observe the trajectory. It was observed that the ball trajectories could be controlled by the face angle and the height of the lifter bars.

Effect of Friction of the Wall on the Charge Profile
A smoothly lined mill consisting of 24 elements (walls) with 45% ball filling was simulated. The behavior of the charge was studied by changing the coefficient of friction at the wall. Three different disc sizes of equal proportion were used. The mill was rotated at 63% of the critical speed. The position of the balls at the end of five revolutions is shown in Figure 2. It is seen that, using a low coefficient of friction at the walls, balls tend to flow down the surface of the charge, and a “toe” begins to form. As the friction at the wall increases, cataracting motion is observed. A comparison of the energy input shows that for a coefficient of friction of 0.9 the energy input is about 1.5 times higher than for a coefficient of friction of 0.2.


