Table of Contents
Primary lead is commercially produced from lead sulfide concentrates by a smelting process consisting of sintering, blast furnace reduction, and refining. The pyrometallurgical method is low cost and requires relatively little energy, but generates gaseous sulfur dioxide and particulate lead, which must be controlled to prevent air pollution. Because of the difficulties in meeting regulations for lead exposure, there is considerable interest in developing an alternative to the sintering-reduction-refining process.
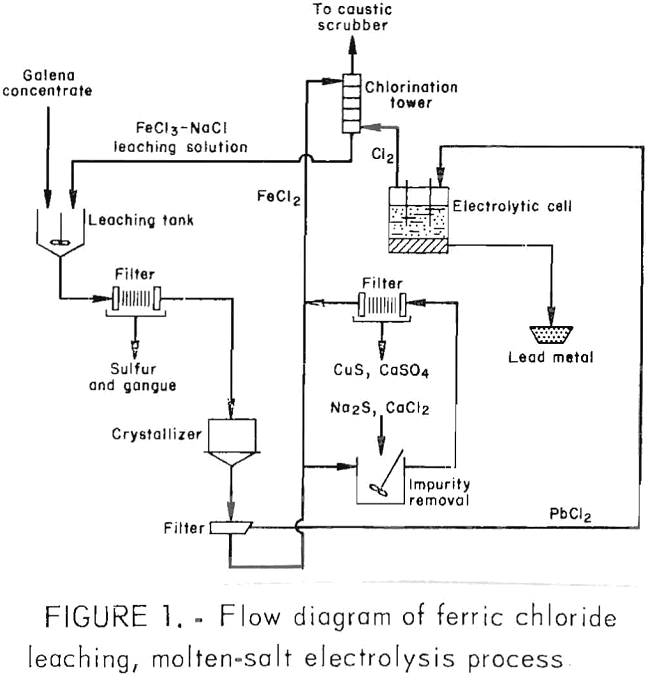
As a part of its effort to develop improved technology for recovering metals from domestic ores while minimizing un-desirable environmental impacts and workplace health hazards, the Bureau of Mines has investigated a leaching-electrolysis method for the production of lead. The method consists of leaching galena concentrate with ferric chloride-sodium chloride solution,

cooling the solution to crystallize PbCl2, electrolyzing the lead chloride in a molten-salt bath to produce lead metal and chlorine

and using the chlorine to regenerate ferric chloride in the leaching solution,
2FeCl2 + Cl2 → 2FeCl2.
Ferric chloride leaching of galena was investigated by Christiansen in 1923, later by Agracheva and recently by Cottam, Baker, Milner , and Demarthe. Molten-salt electrolysis of lead chloride was reported by Ashcroft in 1925 and later by Starliper. An integrated process has never been developed for commercial use, because of economics and material corrosion problems.
The present investigation of the leaching-electrolysis procedure for producing lead evolved from an investigation of ferric sulfate leaching of galena concentrates. Subsequent research on the leaching of chalcopyrite indicated that ferric chloride gave better results in leaching sulfide concentrates than ferric sulfate. Since lead smelting costs increased because of new pollution controls needed to meet environmental regulations and since new corrosion- resistant materials of construction became commercially available, the ferric chloride leaching, molten-salt electrolysis method for lead production became more attractive. A preliminary study of the method was made in 1973, and bench-scale investigations were performed on the leaching and electrolysis steps, followed by a preliminary evaluation on the process economics. The results indicated that the leaching-electrolysis process warranted further investigations. In 1978, four lead producers joined the Bureau in the cost-sharing research program to evaluate the method on an expanded scale.
The objective of the investigation was to identify possible problems in an integrated operation of the process. Specific areas of concern were corrosion, materials of construction, impurity buildup in the system, operation of the electrolytic cell, generation of wastes, lead levels in the workplace, and worker health hazards.
Acknowledgment
The authors acknowledge the financial support of St. Joe Minerals Corp., ASARCO, AMAX, and COMINCO, Ltd., and the technical advice of their representatives. Acknowledgments are given to F. P. Haver of the Bureau of Mines for his contributions in design and engineering during the initial phase of the project and to B. P. Herve, J. D. Marchant, B. R. Eichbaum, S. M. Olson, and S. G. Moyer, also of the Bureau of Mines, for their assistance in the operation of the experimental unit.
Materials Equipment and Operating Procedure
Lead Concentrate
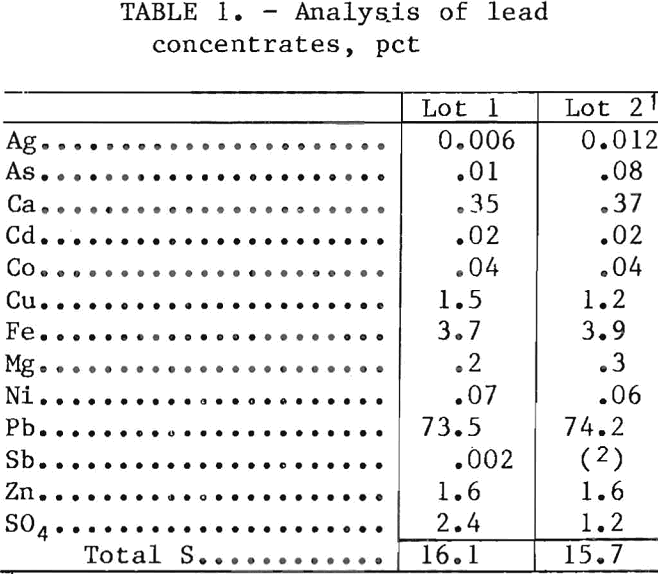
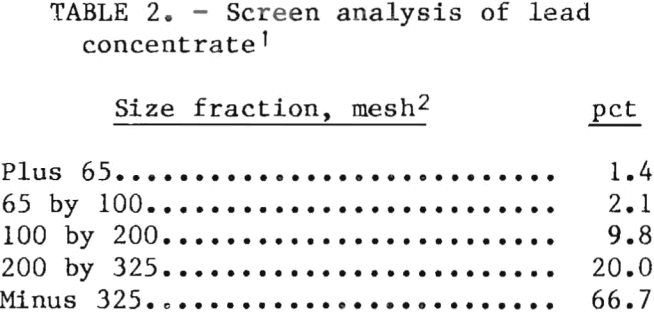
The two lots of lead concentrates were obtained from southeastern Missouri, the region that produces most of the lead in the United States,. Analyses of the concentrates are given in table 1, and a wet screen analysis is presented in table 2. The lead concentrates contained galena, chalcopyrite, sphalerite, marcasite, silver associated with zinc, cadmium in sphalerite, and nickel and cobalt in siegenite. The gangue material contains a small quantity of dolomite.
Equipment
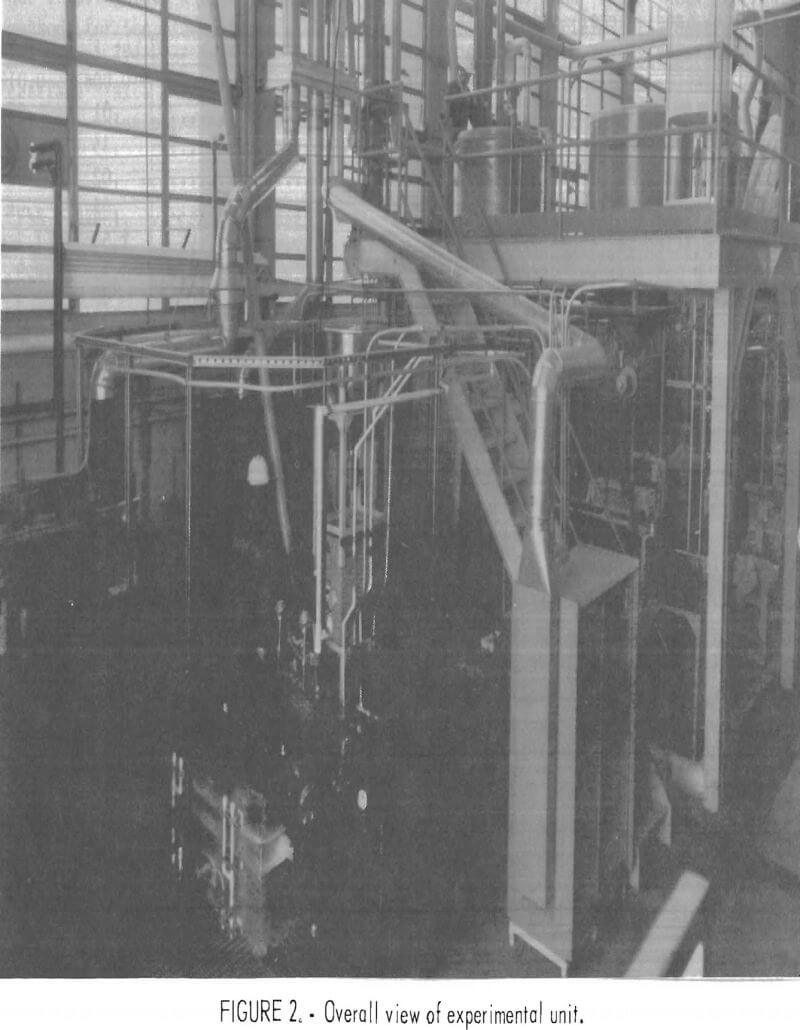
A schematic flow diagram for the integrated operation is shown in figure 1. The leaching circuit was sized to treat six 125-lb batches of flotation concentrate per day. The six leaching cycles produced enough lead chloride to yield about 500 lb of lead metal. An overall view of the experimental unit is shown in figure 2. The leaching section, which occupied two levels, is located on the right and the electrolytic cell on the lower left.
The leaching vessel was a 400-gal, coned-bottom steel tank lined with polyvinylidene fluoride, thermally insulated and equipped with a steam-heated titanium coil and a titanium stirrer. The concentrate was fed from a hopper by a screw feeder into the tank. The slurry was discharged through an air- activated, straight-through, pinch-type chlorobutyl-lined cast iron valve and was transferred by a spring-activated, fluorinated-rubber-lined diaphragm pump to a filter press. A Teflon expansion joint and a flexible stainless steel pipe section with a polyvinylidene fluoride liner were also installed in the line to absorb the vibrations of the spring-activated pump.
The polypropylene plate and frame filter press were dressed with polypropylene felt cloths. Hot pregnant solution from the filter was transferred through a chlorinated polyvinyl chloride (CPVC) pipe to a crystallizer, which was a 400-gal, coned-bottom polypropylene-lined steel tank equipped with a water-cooled titanium coil and a titanium stirrer. The slurry was discharged through an air- activated, pinch-type fluorinated-rubber-lined valve. The line connecting the leaching tank, filter press, and crystallizer was thermally insulated.
Lead chloride was recovered in a fiber-reinforced plastic (FRP) vacuum pan filter dressed with a polypropylene cloth. The spent solution was transferred to a preparation tank (not shown in fig. 1) by a magnetically driven, polypropylene centrifugal pump. The preparation tank was
a 400-gal, coned-bottom, polypropylene-lined, thermally insulated steel tank, equipped with a steam-heated titanium coil and a titanium stirrer. The crystallizer, pan filter, and preparation tank were connected by CPVC pipes, fittings, and ball valves. Liquor from the preparation tank was discharged into a 600-gal FRP surge tank (not shown in fig. 1) by gravity through an air- activated, polypropylene-lined, Teflon diaphragm valve.
The surge tank was equipped with a steam-heated titanium coil and a titanium stirrer. A stream of solution from the surge tank was circulated by a neoprene flexiliner pump through a chlorination tower. The lines between the surge tank and the chlorinator were made of CPVC, and the solution flow rate was measured by an ultrasonic Doppler flowmeter clamped on the line.
The chlorinator was a 12-in-diam by 10-ft-high FRP tower, packed with 14 in of 3-in polypropylene saddles and 4 ft of 1-in Glitch butterflies and equipped with a polypropylene mist eliminator and a polypropylene spray nozzle. Chlorine adsorption by the stripped solution was usually more than 98 pct. To ensure that the gas discharged to the atmosphere was free of chlorine, another tower of identical construction to the chlorinator was connected in series with the gas stream from the chlorinator and used caustic solution for scrubbing. The gas stream was drawn through both towers by a 1-hp blower.
All the tanks in the leaching section were covered and the fumes were vented through a water scrubber consisting of a 12-in-diam by 10-ft-high FRP tower packed with 5 ft of 3-in polypropylene saddles.
The PbCl2 from the pan filter was dried in sulfon-X trays in an electric oven with a stainless steel interior and a horizontal air flow of 10 ft³/min. A Burr crusher was used to break up the lead chloride lumps and a coned-bottom, 24-in-diam stainless steel container with a clamp-on lid and a polyvinyl chloride (PVC) ball valve at the bottom was used to transport the lead chloride to the feed hopper of the electrolytic cell.
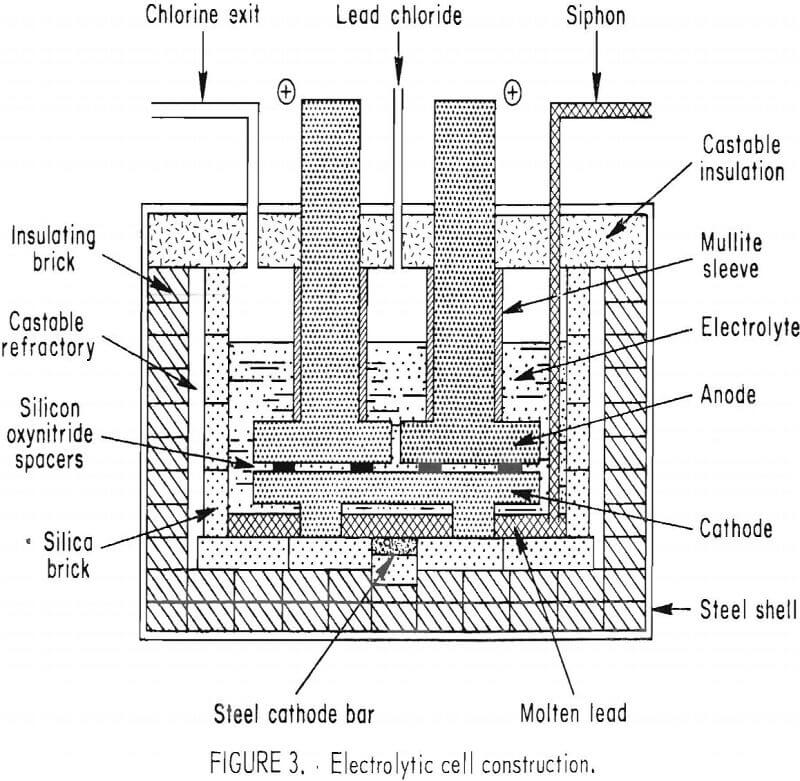
The electrolytic cell construction is shown in figure 3. The cell exterior dimensions were 53 in long, 44 in wides and 30 in high. The cavity was 34 in long, 25 in wide, and 18 in deep. The inside walls were constructed of silica bricks, and the lid was constructed of cement and low density aggregate. Two graphite plate anodes, 14 by 24 by 3 in, were threaded and were attached to two 6-in-diam graphite rods which were connected to a busbar. The graphite rods above the anode plates were protected from air oxidation by mullite sleeves. Another graphite plate 29- by 24- by 2-in, was supported by four graphite blocks which were partially immersed in a pool of molten lead metal. Under the molten lead metal pool, a steel bar protruding through the bottom of the cell was cathodically connected to a 5,000—amp rectifier. The anode plates and the cathode plate were separated by ¾-in silicon oxynitride spacers. The surfaces of the anode and cathode plates were grooved with six ¼-in-wide, slanted channels to guide the flow of chlorine to one side of the cell and lead metal to the opposite side.
Lead chloride was added to the cell from the feed hopper by a screw feeder. Chlorine from the exit port was diluted to 30 vol-pct with air through an adjustable draft outside the cell and drawn through an FRP pipe to the bottom of the chlorination tower. Chlorine from a bottle provided a backup source when needed and compensated for the losses of chlorine in the exhaust from the chlorination tower and extraction of metals other than lead in the circuit. Lead metal produced in the electrolytic cell was siphoned through a removable Pyrex tube connecting the cell bottom to a vacuum chamber in which a mold was used to collect the metal. Two removable graphite ac heating electrodes (not shown in fig. 3) were used to keep the electrolyte and lead metal molten when the cell was idle.
Operating Procedure
A 125-lb batch of lead concentrate (120 lb on dry basis) was leached at about 95° C in 300 gal of solution initially containing 73 g/l FeCl3, 254 g/l NaCl, and sufficient HCl to give a pH of about 0.3. After a 15-min leach, the slurry was filtered. Air was blown through the filter cake after each filtration The residues accumulated after three to four batches were washed with a steam-water mixture before being removed from the filter press. Each load of residue was washed with 20 to 30 gal of water at 1 gal/min.
Hot pregnant solution from the filter was transferred to a crystallizer in which lead chloride precipitated when the solution was cooled to about 20° C. The lead chloride crystals were separated from the solution in a vacuum pan filter and washed with about 20 gal of water followed by drying in an electric oven at 150° C for 6 hr. The dry PbCl2 was crushed and placed in a portable, closed container inside a fume hood. The container was connected to the feed hopper of the electrolytic cell.
The spent solution from the pan filter was transferred to a preparation tank, heated to 70° C, and then transferred to a surge tank. The solution was maintained at 70° to 75° C in the surge tank. Some water besides the water used in washing the residue and PbCl2 was added to the circuit to compensate for the water losses such as entrainments in the residues and PbCl2 and vapors from the tanks and chlorination tower.
The spent solution from the pan filter was periodically transferred to the leaching tank for copper and sulfate removal. Copper and silver were removed from the spent leaching solution with Na2S. Enough Na2S was added to give an oxidation-reduction potential of 260 mv (Ag-AgCl reference electrode). Copper and silver sulfides, precipitated as fine black particles, were removed from the solution by filtration in the filter press. The sulfides were washed with steam and water prior to being emptied from the filter press. Sulfate was removed from the spent solution with CaCl2. About 10 lb of CaCl2 was added for every 300 gal of solution at 25° C. The precipitated CaSO4 was removed from the solution by filtration in the filter press. This procedure was repeated until the sulfate was lowered to the desired level. Prior to emptying the filter press, the CaSO4 residue was washed with steam and water. Following precipitation of either the copper or sulfate, the filtered solution was returned to the preparation tank.
A stream of about 8 gal/min of solution from the surge tank was constantly circulated through the chlorination tower to convert ferrous chloride to ferric chloride. A total of 450 gal of solution was kept in the surge tank. The extent of chlorination was determined by monitoring the oxidation-reduction potential and/or determining the Fe+ in solution with a dichromate titration. The oxidation-reduction potential was measured with platinum and Ag-AgCl combination electrodes, using Ag-AgCl as the reference electrode.
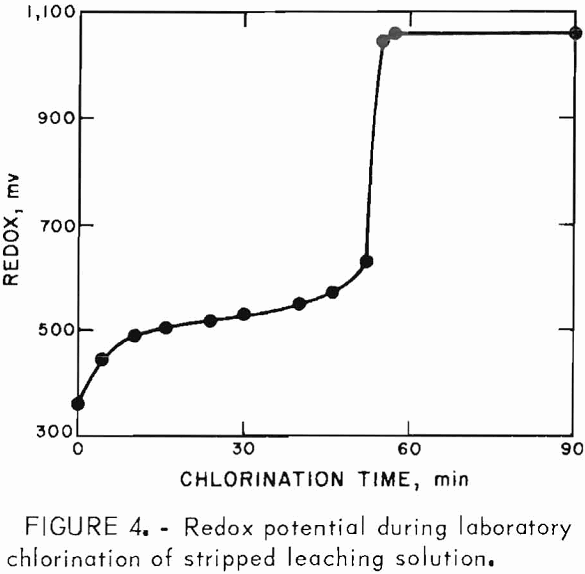
Figure 4 shows the redox potential behavior during laboratory chlorination of a sample of the spent solution at 70° to 75° C. The desired degree of chlorination was reached at a redox potential of 580 mv. When the desired chlorination was obtained, 300 gal of the solution was transferred to the leaching tank. When needed, additions of NaCl, FeCl3, and HCl were made to adjust the solution composition pH before the solution was heated to temperature for another cycle of leaching.
The lead chloride feeder, which was controlled by a timer, added lead chlo-
ride automatically to the electrolytic cell. The initial bath was composed of 834 lb of salt mixture containing 25 pct LiCl, 32 pct KCl, and 43 pct PbCl2. Heat from electrolysis maintained the electrolyte temperature at about 450° C, and the lead metal temperature was about 400° C. The lead metal produced was periodically siphoned through a removable Pyrex tube connecting the lead metal pool in the cell and the vacuum chamber. Lead metal was collected in a mold in the vacuum chamber.
Analysis of Samples
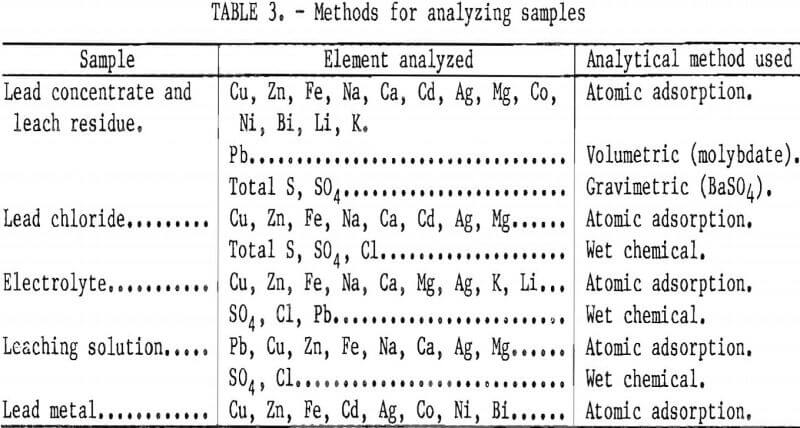
The analytical results obtained were periodically cross-checked with the lead companies cooperating in the research program. The methods used to analyze samples are listed in table 3.
Results and Discussion
Leaching
The experimental unit was operated on an 8-hr basis and in 5- and 10-day continuous campaigns. Altogether, 419 leaching cycles were made. After some initial modifications no serious problems were encountered with corrosion of construction materials. A variety of commercially available materials, such as fiberglass-reinforced plastic, chlorinated polyvinyl chloride, polyvinylidene fluoride, polypropylene, fluorinated rubber, and titanium, withstood the corrosiveness of the chloride solutions. Choice of equipment type was limited by the availability of equipment for the small-scale size of the operation. More efficient equipment for a larger scale operation should be tested.
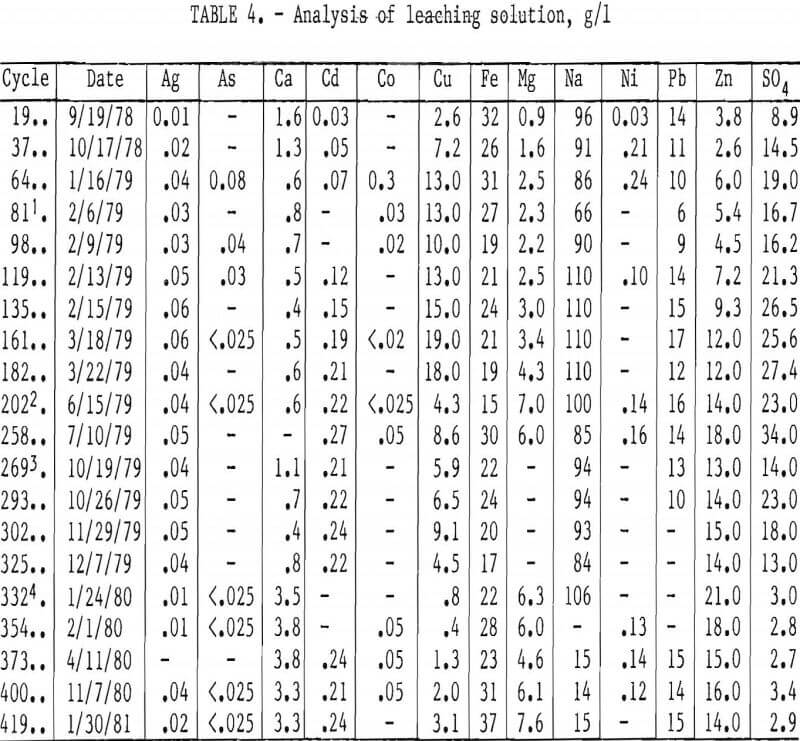
Table 4 shows the analysis of the leaching solution. The major impurities introduced into the leaching circuit were copper, zinc, and sulfate. Copper and zinc originated from the leaching of chalcopyrite and sphalerite, whereas the sulfate came from PbSO4 formed by oxidation of PbS during storage of the concentrate. For example, lot 1 concentrate contained 2.4 pct sulfate when it was obtained and this increased to 4.5 pct over a 2-yr period.
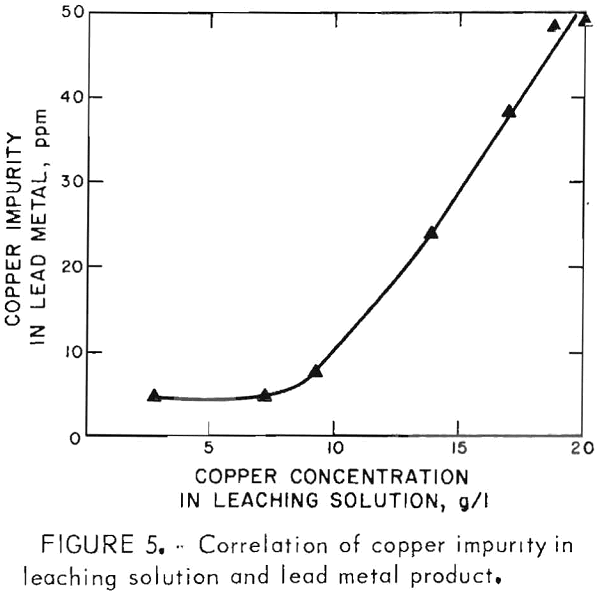
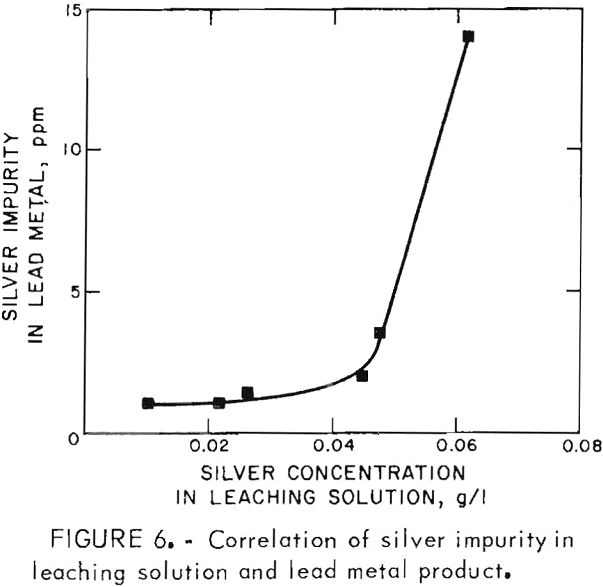
Buildup of copper and silver in the leaching solution did not adversely affect the leaching efficiency, but resulted in the contamination of the lead chloride and consequently the lead metal. The correlations of copper and silver in the leaching solution and the lead metal product are shown in figures 5 and 6. The presence of some copper in the leaching solution had beneficial effects on extracting lead from the concentrate and on the reaction rate of converting ferrous ion to ferric ion during chlorination.
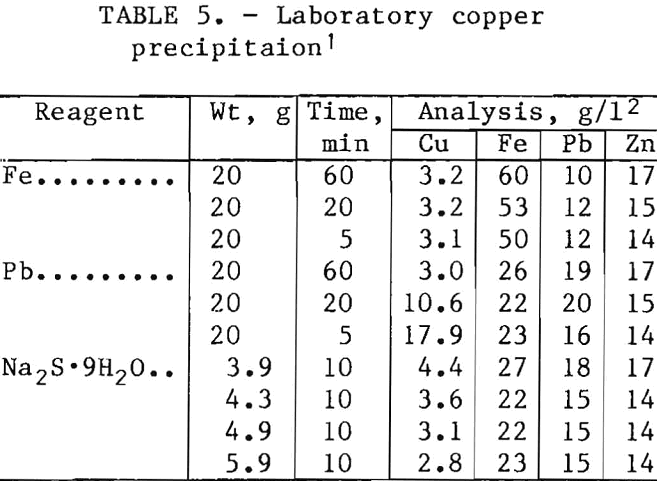
A laboratory investigation to remove copper from the leaching solution indicated several possible methods. The results of these tests are given in table 5. Although all methods were successful, sodium sulfide precipitation was selected because of the efficiency and ease of using this method. With a 4.9-g addition of Na2S·9H2O per liter of leaching solution, the copper decreased from 19 to about 3 g/l in 10 min.
Zinc concentration built up slowly and leveled off at about 15 g/l. Magnesium
and cadmium also showed a moderate increase. At the concentrations of zinc, magnesium, and cadmium shown, there was no apparent effect on the leaching operation.
Sulfate buildup in the leaching solution decreased the lead extraction, contaminated the electrolyte, and formed a precipitate in the chlorination tower that obstructed the gas and solution flows. An analysis of a sample of the precipitate removed from the chlorination tower showed, in percent, 20 Fe, 9.0 Ca, 5.2 Na, 3.0 Pb, 0.48 Zn, 0.19 Cu, 36 SO4, 3.3 Cl, and 0.50 S°. When the sulfate content of the leaching solution was about 34 g/l, serious precipitation of iron sulfate occurred during the crystallization of lead chloride.
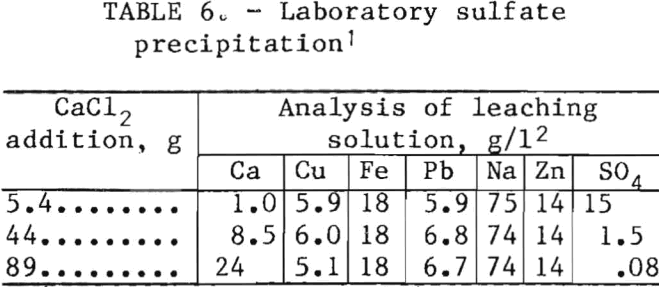
Precipitation of sulfate with calcium chloride was effective in removing sulfate from the leaching solution. The laboratory study shown in table 6 indicates that the sulfate can be removed to <0.1 g/l with calcium chloride. The precipitate after a water wash contained, in percent, 26 Ca, 62 SO4, 0.3 Cu, 0.3 Na, 5 Pb, 0.02 Zn, and 0.8 Fe. The sulfate level in the leaching solution of the experimental unit was controlled at about 3 g/l by maintaining the calcium content at 3 to 4 g/l (table 4).
To determine the effect of sulfate buildup, aged lead concentrate with a high sulfate content was used during the early part of the investigation to accelerate the sulfate buildup. The sulfate in lot 1 concentrate increased from 2.4 to 4.5 pct by aging in a 2-yr period. Fresh concentrate was used after leaching cycle 326. In an industrial operation using a fresh concentrate, the sulfate problem would not be as serious as that encountered in the experimental unit. Sulfate could be removed from the circuit by treatment of a bleedstream with, calcium chloride in an industrial operation.
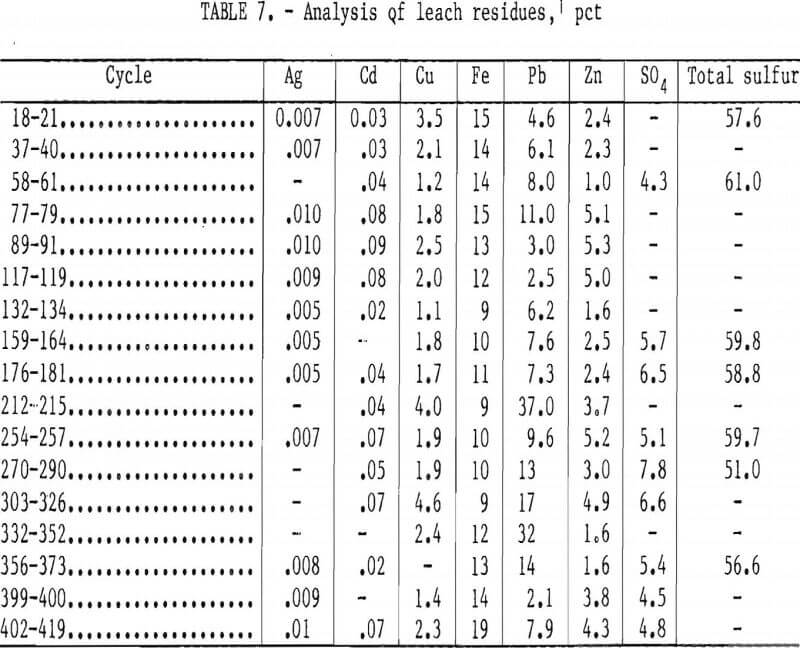
Table 7 shows the analysis of the leach residues. Prior to analysis, the residue samples from the filter press were re- washed with hot water in the laboratory. Thorough washing of the residues in the filter press was difficult. Generally the residue samples that were not re-washed in the laboratory contained up to 5 pct more lead sulfate and chloride and up to 1 pct more copper and zinc. Thirty pounds (dry basis) of residue was produced from leaching 120 lb (dry basis) of concentrate. The residue contained 40 to 50 pct elemental sulfur. The remainder of the sulfur was present as insoluble sulfates and unreacted sulfides of iron, copper, zinc, and lead. Microscopic and X-ray diffraction examinations of the residues showed a major amount of alpha- sulfur and minor amounts of pyrite, sphalerite, chalcopyrite, covellite, pyrrhotite, galena, and gypsum. Sulfur grains averaging 5 to 10 µm in diameter occurred in the matrix of the leach residue. Covellite, which was not detected in the galena concentrate, occurred as a coating on galena particles and galena pseudomorphs.
Elemental sulfur could possibly be recovered from the residue by filtration at temperatures above the melting point of sulfur and with steam or organic solutions. A mixed sulfide concentrate for subsequent recovery of the metal values would be obtained. Another possible method to recover the sulfur value would be to burn the residue to produce sulfur dioxide to manufacture sulfuric acid and a mixed oxide for subsequent recovery of the metal values.
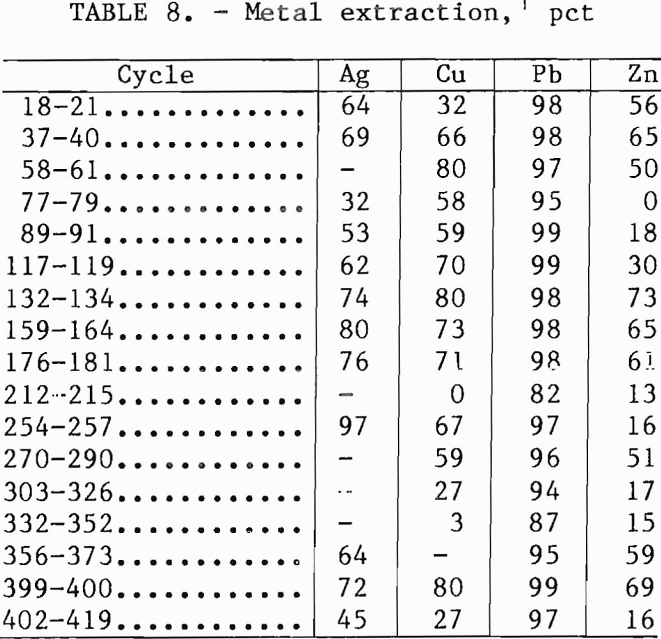
Metal extractions based on the analysis of the laboratory-washed leach residues are shown in table 8. The lead extraction was usually about 98 pct before the start of removing copper from the leaching solution by precipitation with Na2S (cycle 202). Subsequently, the lead extraction began to decrease. When the iron content of the leaching solution was increased to 30 g/l or higher after cycle 373, the lead extraction returned to the 98-pct level. Extractions of copper, zinc, and silver were higher than those obtained in bench-scale research, in which better control of leaching time was possible. Ferric chloride leaching can be made selective, and more than 99 pct lead extraction can be obtained in 15 min. Additional leaching time increases solubilization of chalcopyrite and sphalerite. Because leaching and filtration were performed batchwise in the experimental unit, the contact time between solution and concentrate was at least 30 min, thereby increasing the ex-traction of copper, silver, and zinc.
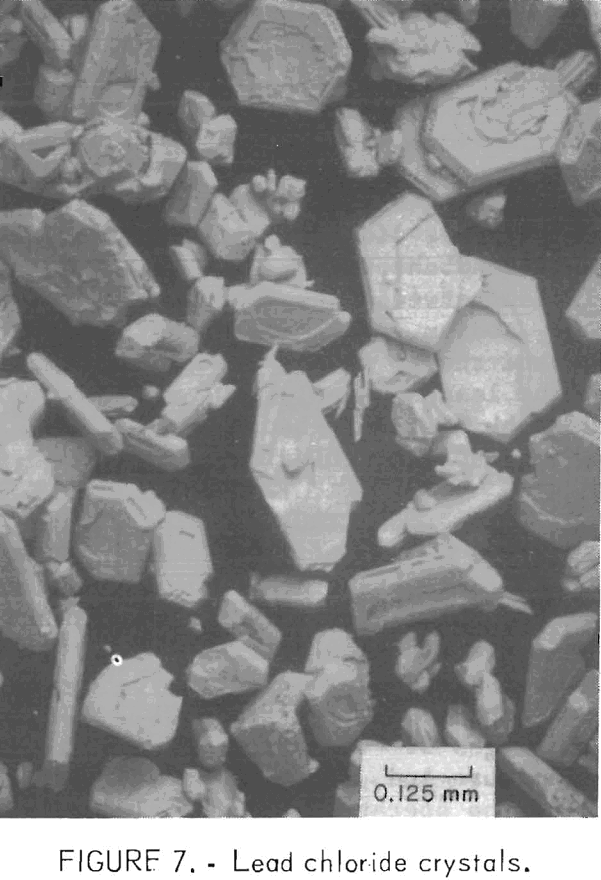
Lead chloride solubility was affected by sodium chloride concentration and temperature. During leaching, sufficient sodium chloride was required to keep the lead chloride in solution. After leaching, lead chloride crystallization occurred as the temperature was decreased in the crystallizer. The lead chloride produced was granular and had a bulk density of approximately 2.7 g/cm³. Figure 7 is a photomicrograph of the lead chloride crystals.
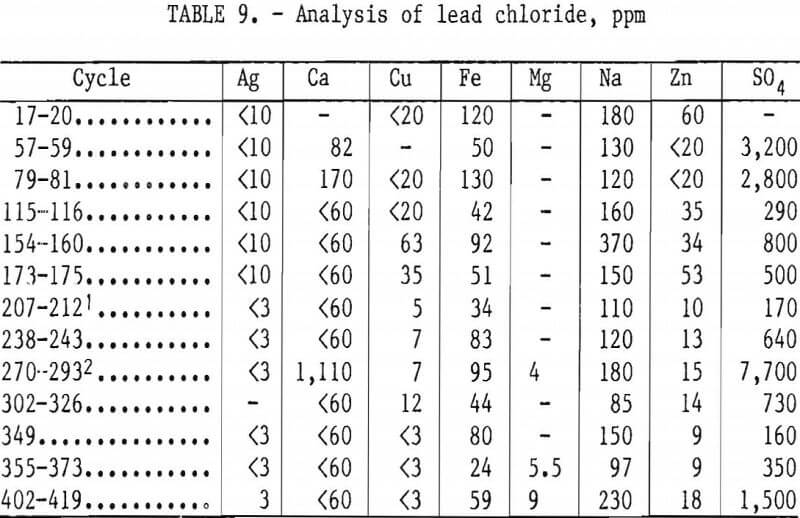
As shown in table 9, the impurities detected in the lead chloride were sodium, iron, copper, zinc, magnesium, calcium, silver, and sulfate. Copper and magnesium corresponded to the trends of their concentrations in the leaching solution. Sulfate and calcium occurred together in the lead chloride and most likely formed gypsum. Removal of sulfate from the leaching solution by precipitation with calcium chloride decreased, but did not eliminate, sulfate in the lead chloride. The lack of correlation between the concentrations of iron, sodium, and zinc in the lead chloride and their respective concentrations in the leaching solution was probably caused by batch-to-batch variations in washing the lead chloride.
Electrolysis
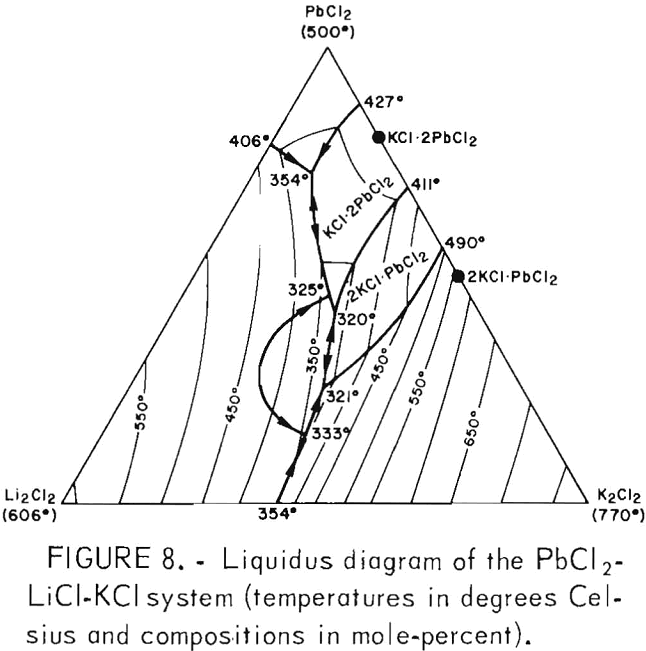
The liquidus surface diagram of the PbCl2-KCl-LiCl system (fig. 8) shows that operation at about 450° C permitted a wide variation of electrolyte compositions, particularly the PbCl2. Within the ranges of variation of electrolyte temperature and compositions encountered during the operation of the electrolytic cell, the electrolyte was always fluid.
Table 10 shows the operating data of the electrolytic cell from startup in November 1978 to April 1980. Heat from electrolysis maintained the cell at the desired temperature. The cathode current efficiency was lower, and the cell voltage was higher than those obtained in previous bench-scale research. Variations in cell resistance (table 10)
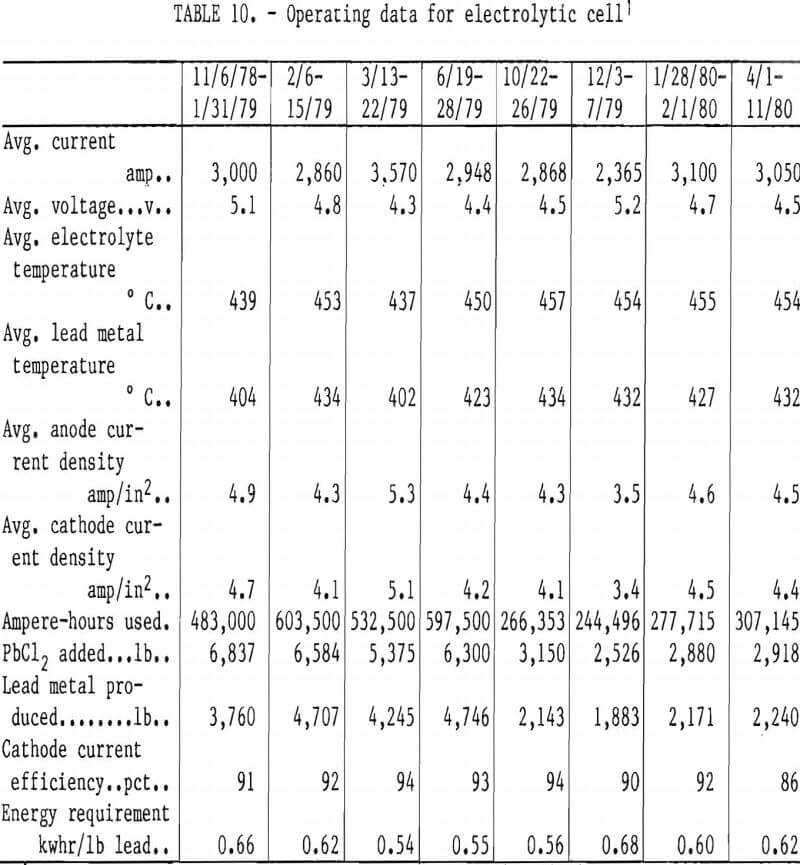
were probably due to changes in melt composition, temperature, and buildup of impurities such as calcium and sulfate. The changes in bath composition could result in the change of electrolyte density, viscosity, and surface tension. This could affect the gas fraction and the anode coverage by bubbles, with a resulting increase in cell resistance. The presence of a significant gas fraction in the electrolyte could also increase recombination of lead and chlorine, which would decrease the current efficiency. Haupin reported that in aluminum processing, bubbles on the anode and in the electrolyte significantly increased the electrical resistance of the cell and that careful design of the anode configuration and adequate bath circulation would be required to minimize this effect.
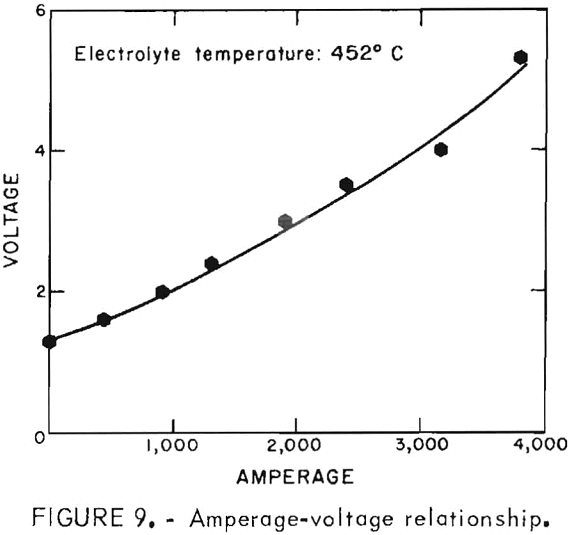
The voltage-amperage relationship of the electrolytic cell is plotted in figure 9. The amperage is essential zero until the voltage is about 1.3 v.
The electrolytic cell was not a prototype. Scaleup to commercial size from the data obtained is not practicable. Additional development work on cell design and scaleup to a commercial cell size is needed.
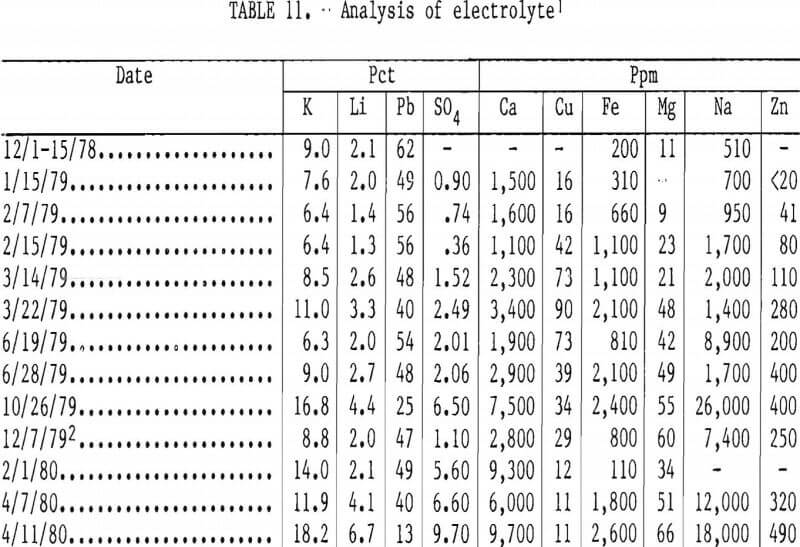
The analysis of the electrolyte is shown in table 11. The impurity elements that are less noble than lead, such as Ca, Na, Fe, Zn, and Mg, increased in the electrolyte. The Zn and Mg increased very slowly. Copper in the electrolyte co-deposited with the lead metal and had to be removed from the leaching solution to prevent contamination of the lead chloride. Sulfate in the lead chloride feed accumulated in the electrolyte. During the latter part of the cell operations, a layer of brownish foam, which was high in sulfate, was observed on the bath surface. This layer may have caused the decrease in current efficiency recorded during the final electrolysis test. Iron in the electrolyte was present as Fe2SO3 (black salt) and at the levels encountered had no effect on cell performance. The fluctuation in Pb, K, and Li concentrations was caused by periodic addition of KCl and LiCl to the cell.
Copper and silver were the only detectable metallic impurities in the lead metal product (table 12). When copper built up in the leaching solution, a corresponding increase was observed in the lead chloride, electrolyte, and lead metal product. Silver behaved in a similar manner to copper. The content of copper and silver in the lead chloride must be controlled to maintain a high-purity lead product. When copper was removed from the leaching solution, 99.999-pct-pure lead metal was produced.
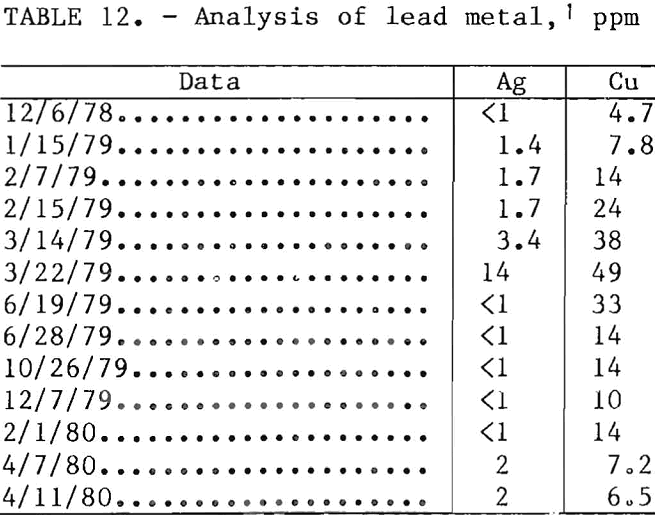
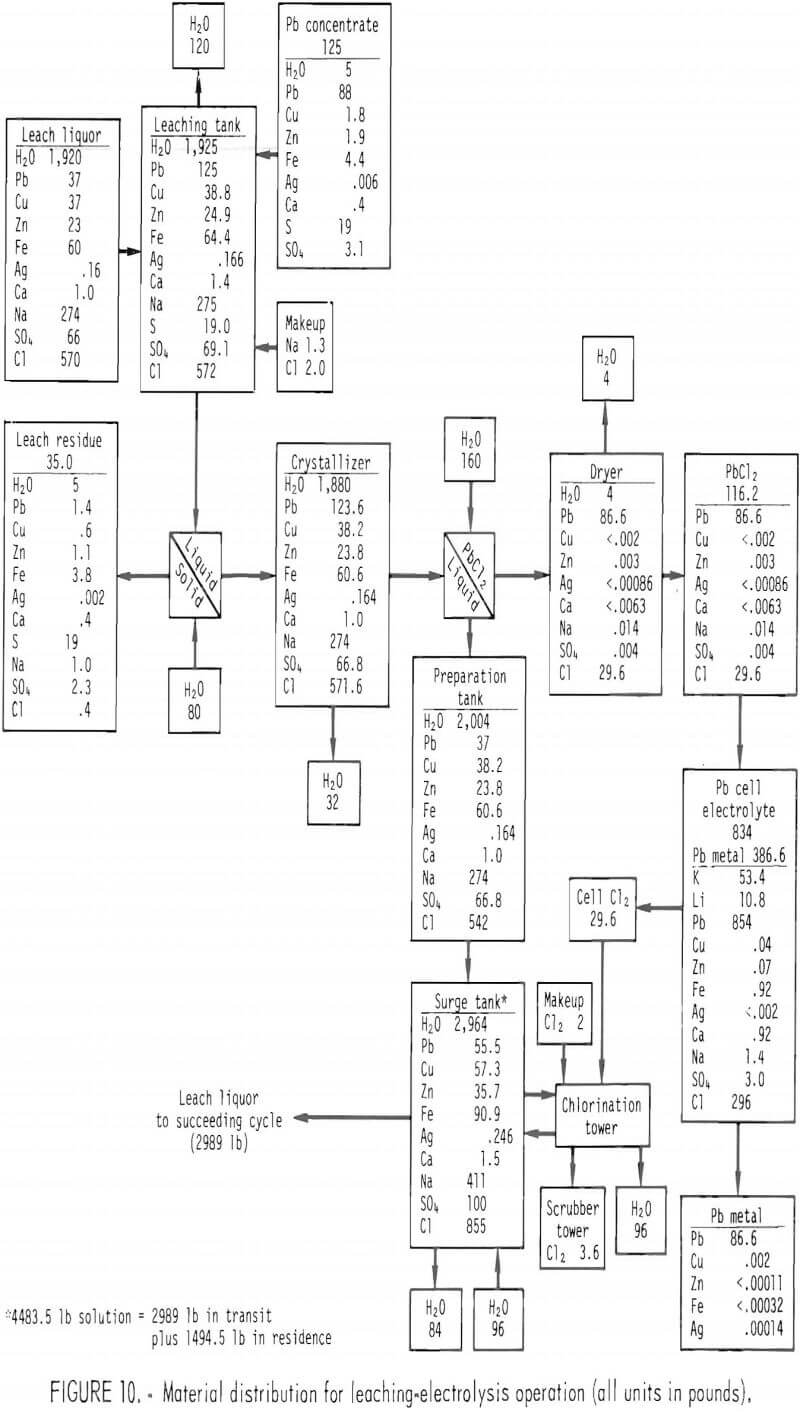
Figure 10 shows a material distribution of the leaching-electrolysis operation based on the data of cycles 108-136. This was the latter part of a 10-day continuous operation before copper and sulfate impurities were removed from the leaching solution.
After more than 19 mo of electrolytic cell intermittent operation, one of the alternating current heating electrodes failed and caused the electrolyte to freeze. When the cell was opened for inspection, the lid and bricks above the bath showed no sign of attack. Sublimate on the lid was mostly PbCl2 and contained 5.3 pct sulfate. The mullite sleeves on the graphite anode leads were not affected. Salt had penetrated ½ to 1 in into the graphite, indicating that
protection of the graphite from air attack at the electrolyte-air interface was effective. A salt crust on the cell walls was observed about 3-½ in above the frozen bath surface and was located at the PbCl2 feed and Cl2 exit ports. The salt crust was 48 to 59 pct sulfate, contained chlorides of sodium and lead and was formed from the foam which rose to within 2 to 3 in of the lid. Foaming occurred occasionally during the latter part of the cell operation. The concentration of sulfate in the foam suggests the possibility of sulfate removal by skimming.
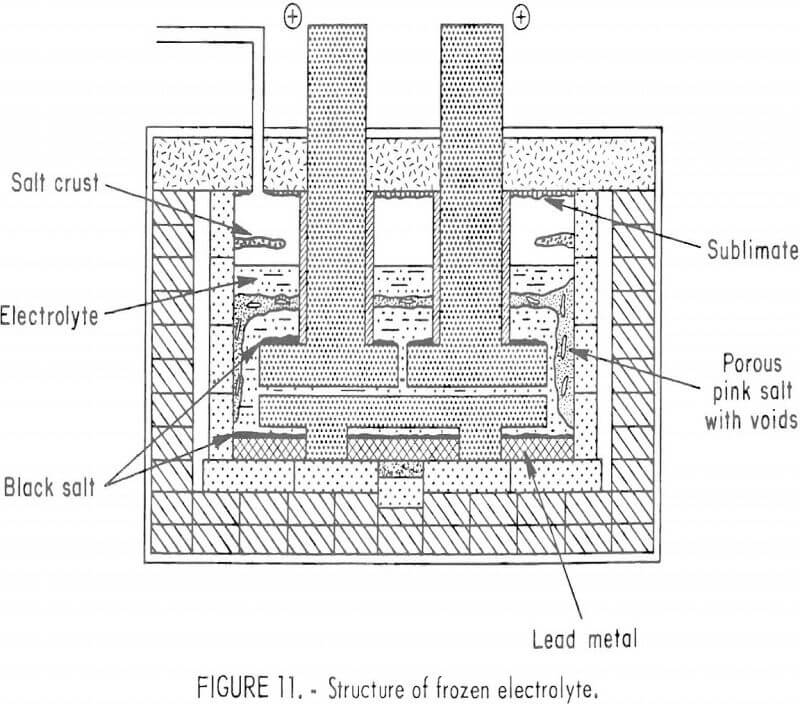
Core samples were taken of the bath at different locations. Sections of the electrolyte and graphite electrodes were removed from one end of the cell to permit dismantling of the bricks and insulation for examination. The structure of the frozen electrolyte is shown in figure 11.
The bulk of the electrolyte was white; its color became grayish at the lower part of the cell. A zone of porous pink salt with small voids was observed near the walls and in the middle of the bulk of the electrolyte (fig. 11). Salt in this zone was the last to freeze because heat from the cell was dissipated more rapidly through the electrodes and top of the bath than through the walls.
A layer of black salt was observed on the top of the anode plates and on top of the lead metal as shown in figure 11. The black salt showed a higher iron content than the white salt (<0.5 pct versus 190 ppm). Residue from a black salt sample after leaching the soluble salts was identified as Fe2O3. A small amount of iron oxide would discolor the electrolyte.
The electrolyte was removed from the cell by leaching with hot water. The anodes and cathode were removed for inspection (figs. 12 and 13, respectively), and the lead metal was stripped to permit examination of cell bottom brickwork.
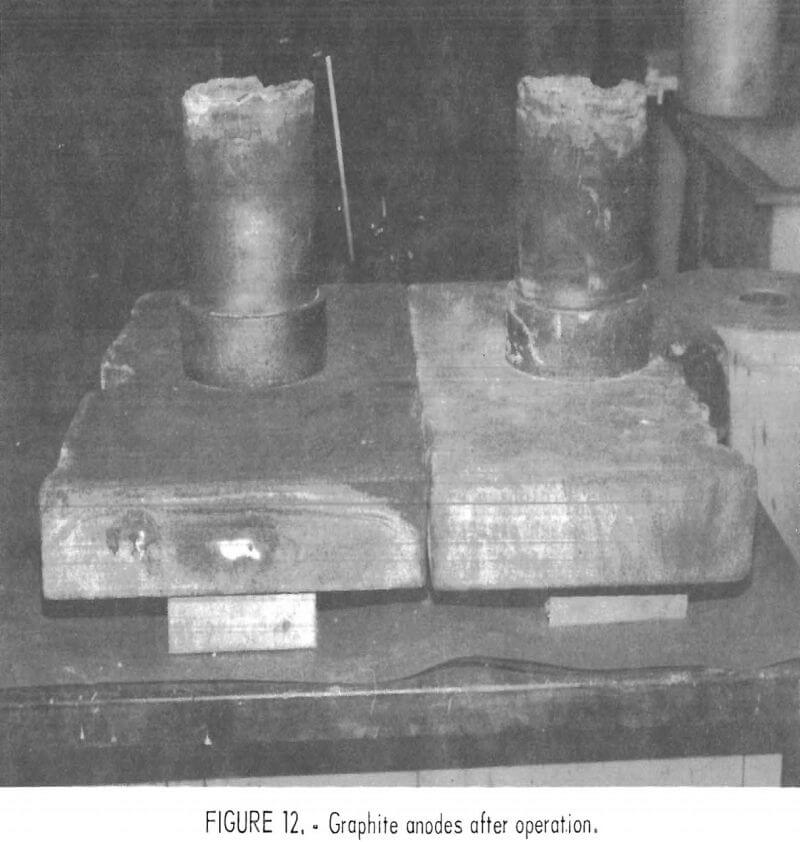
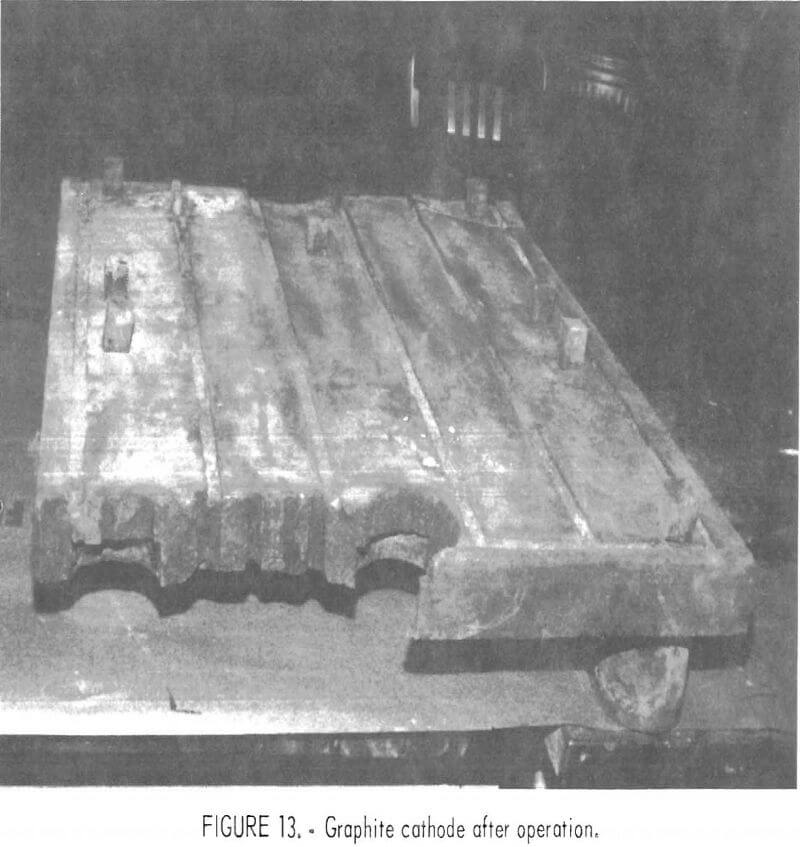
The attack on the anodes and cathode was minimal. Although the surfaces of the anodes were roughened and the edges slightly rounded, there was only a 1/16— to 1/8-in decrease in the overall thickness of the anode plates. The most noticeable erosion (about ¼ in) took place at the end of the grooves, where the chlorine escaped. Wear on the graphite anodes was due to two sources: reaction with oxygen from feed material and air, and erosion from movement of the electrolyte and chlorine gas.
Although the cathode shown in figure 13 (photograph taken before prolonged exposure to air) indicated no sign of attack, the upper surface crumbled after it was removed from the cell and exposed to air for a few months. This suggested that alkali metal had probably intercalated into the graphite interstices. The bottom surface of the cathode plate did not disintegrate, and the surfaces of the graphite anodes were not affected.
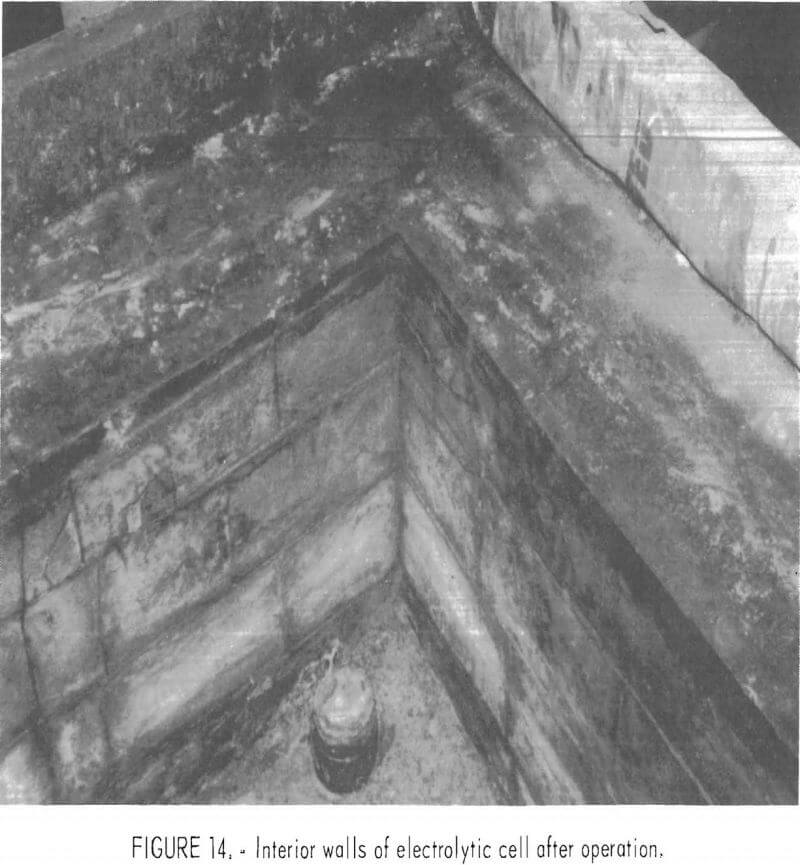
The oxynitride spacers between the anodes and cathode showed no sign of deterioration, and the wall bricks were in excellent condition (fig. 14). Since the upper surface of the lead metal was smooth and no accumulation of lead metal globules occurred, a clean cathode was maintained. The condition of the brick-work under the lead metal was similar to that of the walls. No attack was apparent. Salt and lead metal penetrated the mortar joints in a few places, froze on reaching the steel shell, and effectively sealed the leak. No problems were observed with materials of construction of the electrolytic cell, but the graphite cathodes could be a potential problem.
Lead Monitoring
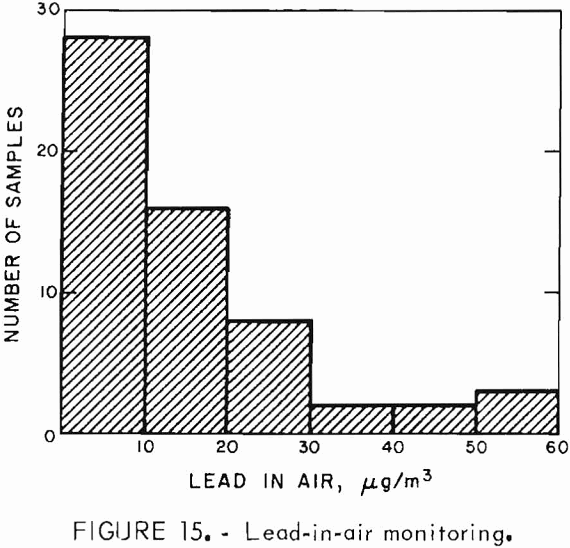
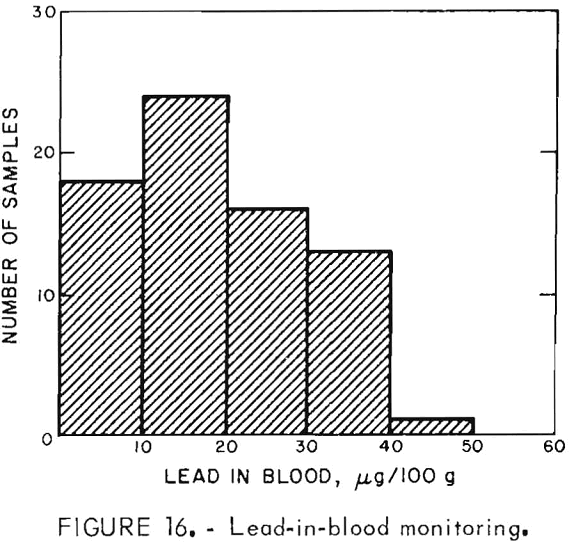
Exposure of personnel to lead was monitored during the operation of the experimental unit. Air samples taken by samplers carried by operating personnel were used to determine lead-in-air levels. Lead analyzers used to determine the concentration of lead in the air were a Bendix model 44, and an MSA Drager-type Multi-Gas Detector model 21/21. Blood tests for lead were administered to monitor lead-in-blood levels of operating personnel. Figure 15 shows that most of the lead-in-air results were <30 µg Pb/m³ of air. Figure 16 shows that the majority of the blood samples contained <40 µg Pb/100 g of whole blood. Lead monitoring data indicated that lead exposured associated with operation of the experimental unit were within Occupational Safety and Health Administration standards. It should, however, be pointed out that the lead monitoring data were obtained from an intermittent operation, and a very small amount of lead was involved compared to the quantities handled in a commercial production plant.
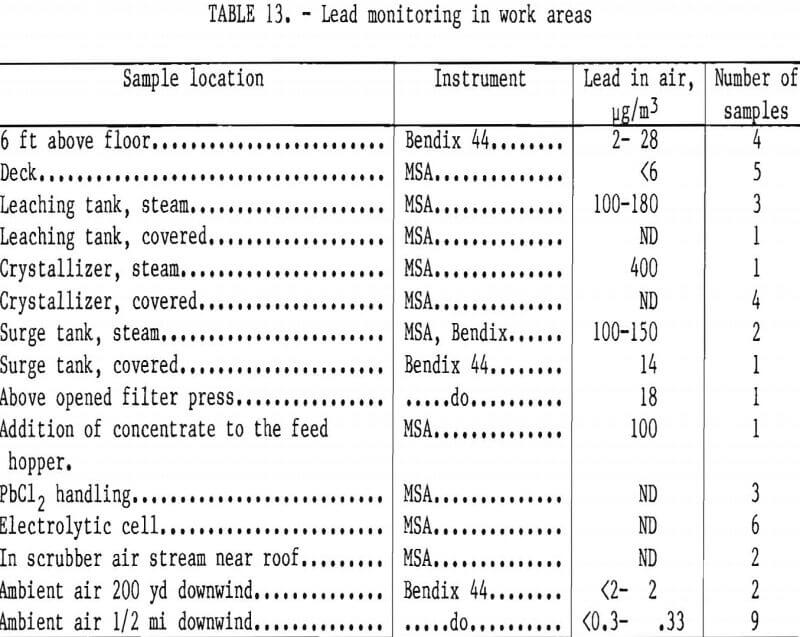
The results of lead monitoring in different locations of the workplace are given in table 13. Air samples taken near the covered tanks, filter press, electric oven, electrolytic cell, and the fume hood in which the dry lead chloride was handled showed that the lead concentration was not significantly higher than in ambient air. The highest lead concentration of 800 µg was in the vapors inside the leaching tank, indicating that all tanks should be covered and that vapors from hot lead-containing solutions should be vented and scrubbed.
Analyses of the blood samples were performed by commercial laboratories and by the Reno Research Center analytical group. Analysis of air samples was per-formed by the Reno Research Center analytical group.
Conclusions
The process has potential for producing lead with minimum pollution, but larger scale developmental research by industry is required for it to achieve commercial utilization. Also, several technological problems that need further attention were identified in the investigation of the process in the experimental unit.
Problem areas requiring research and development are as follows:
- Improve the leaching method to minimize introduction of impurities in the pregnant liquor.
- Improve the methods for removing copper, sulfate, magnesium, calcium, and possibly zinc from the pregnant solution.
- Ensure that methods for treating the leach residue, spent electrolyte, and waste liquid complies with Environmental Protection Agency requirements.
- Obtain data on the properties of the electrolyte such as electrical conductivity, density, viscosity, and surface tension, so that the cell behavior can be better understood. Other electrode configurations should also be tested, as should an electrolytic cell that is large enough to permit scaleup to commercial size.
- Investigate the process on a continuous pilot plant scale to obtain engineering, cost, and lead exposure data and to evaluate the technology for a commercial plant.
