Batch Ball Mill Grinding
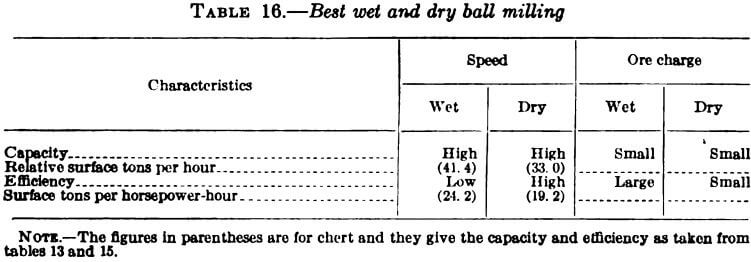
Capacities and efficiencies in wet and dry ball milling at different speeds and ore charges have been discussed in the foregoing pages. The results are summarized in table 16, which shows that in both capacity and efficiency grinding was at its best with small ore charges and high speed. Likewise, in wet grinding the capacity was best with a small ore charge at high speed, but the efficiency was best with a large ore charge at slow speed. The numerical values inserted in the table are about 25 percent higher for wet grinding than for dry grinding. The values for capacity are more significant than those for efficiency. In considering efficiency values, it must be recognized that at a given speed and ore charge either the wet or dry grinding might not have been at its best. That is, it is not correct rigorously to compare the efficiency of wet and dry grinding without giving the mill the correct setting for each job.
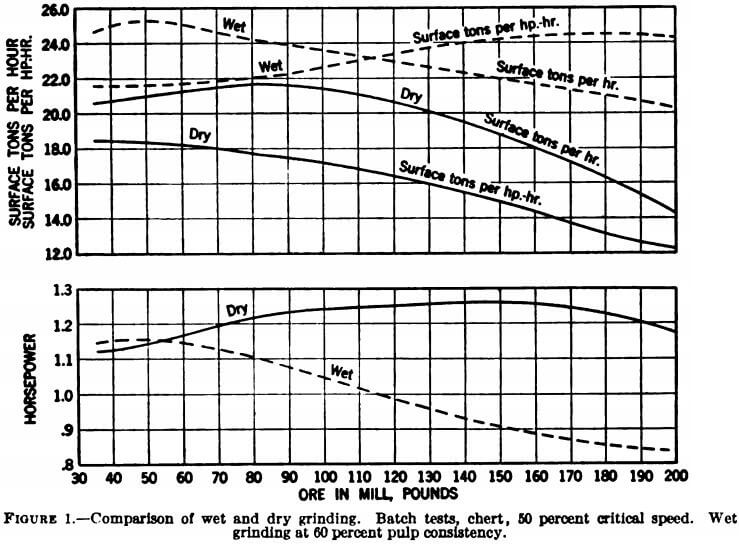
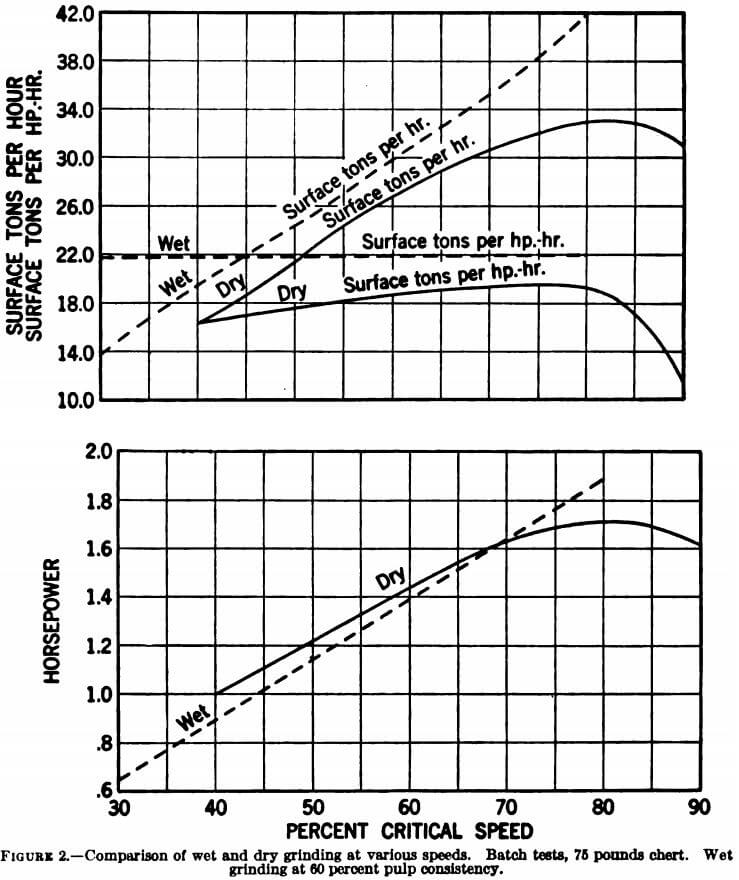
The study of characteristics given in table 16 may be carried farther in figures 1 and 2. The upper part of figure 1 shows that in dry grinding, capacity and efficiency were best with a moderate ore charge; hence, a large discharge is required. In wet grinding, also, capacity was best with a moderate ore charge, but a large ore charge was required for efficiency. The lower part of figure 1 shows that in wet grinding the power decreased with increased amount of ore charge but in dry grinding the power increased.
In figure 2, in which the speed varied, of course the capacities increased with speed. The efficiencies changed only moderately. As said before. the efficiency in dry grinding was a little better at high speed.
The power curves at the bottom of figure 2 are typical of what has been shown before about power curves. The break of the power curve in dry grinding could have been predicted without completing the test at high speed; the relatively high powers in dry grinding at 40, 50, and 60 percent speeds gave evidence of the excellent keying, which caused the balls to be thrown high. Hence, they reached the 8-o’clock position at a lower speed than in wet grinding. In dry grinding the balls reached the 8-o’clock position at 80 percent speed and thereafter the power dropped
Wet and Dry Open Circuit Ball Milling
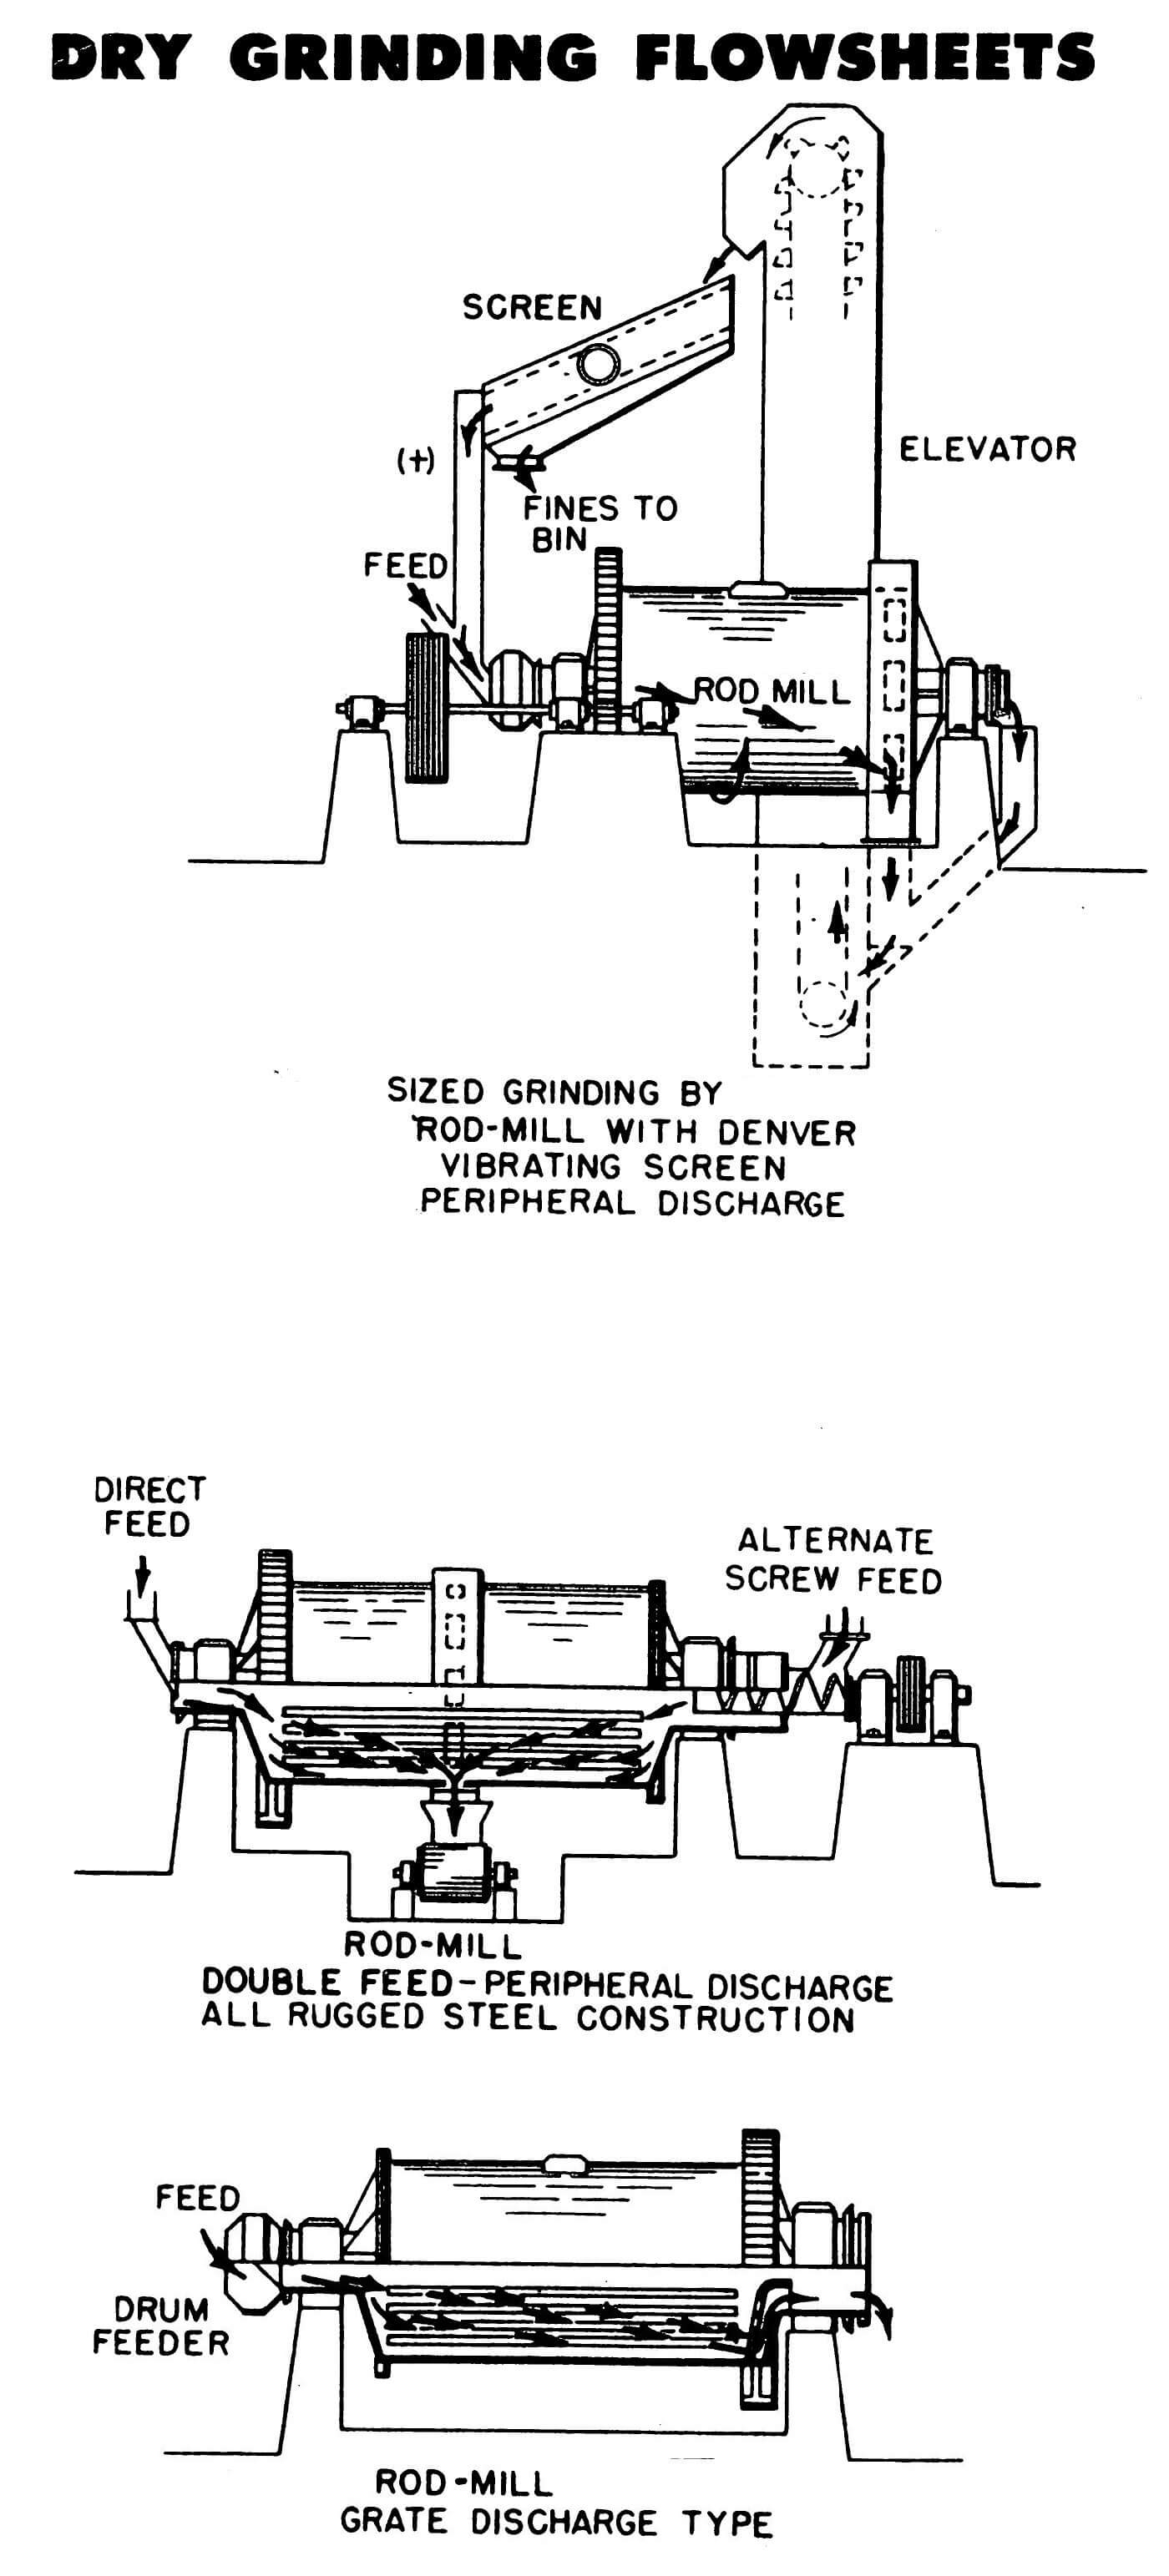
Continuous grinding will have a more prominent place in the remaining part of this paper. Dry grinding has been introduced already and more will be said about it.
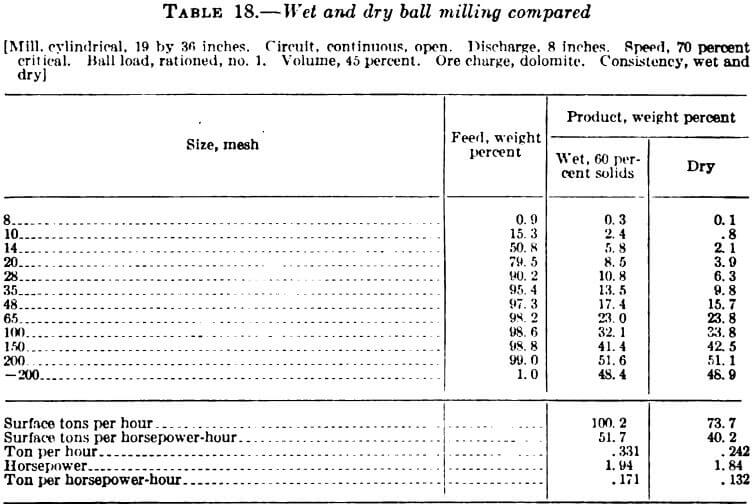
The results shown in table 18 are from continuous open-circuit work done to compare wet and dry grinding. First, it must be said that by choice the grinding was more intense than in former work— only 0.171 and 0.132 ton per horsepower-hour, wet and dry, respectively, whereas in much of the earlier grinding of dolomite it was about 0.60 ton per horsepower-hour. The small tonnage treated per unit of power accounts for the large amount of the subsieve sizes. The feeds were adjusted for the close correlation of the minus 200-mesh sizes and the feed rates determined. Only a slight difference is shown between the type of the wet and dry grinds; the selective grinding was a little better in the dry work. The difference is in accord with the right side of table 17, where a small ore charge received the better selective grinding when the feed was dry. The ore charge in the tests shown in table 18 would probably be small because the mill, which was 19 inches in diameter, had an 8-inch discharge. Wet grinding gave 39 percent, more capacity and 26 percent more efficiency than dry grinding. These values supplement those shown in table 16.
Type of Grind with Different Amounts of Ore Charges in Wet and Dry Ball Milling
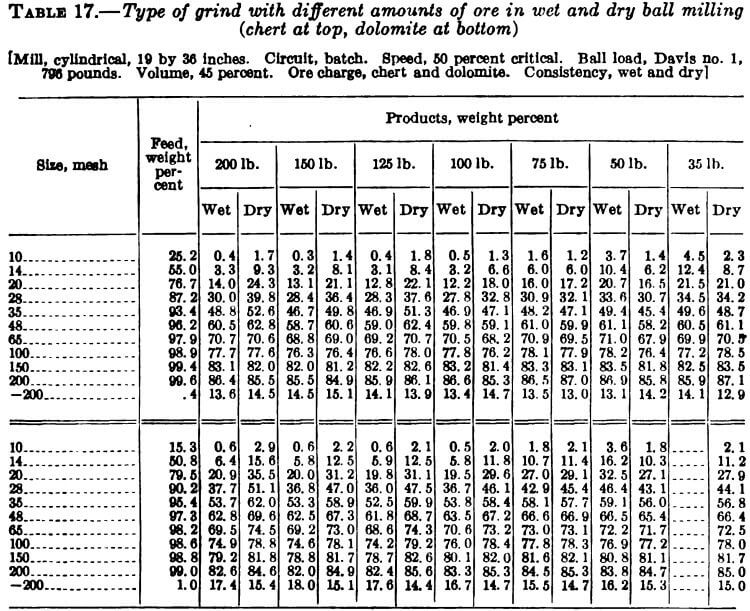
Table 17 is compiled from tables 13 and 14, the object being to facilitate a ready comparison of types of grind in the wet and dry work. The conclusions to be drawn are not in harmony with some of those in the literature where experimental evidence was too scanty to justify the broad statements that were made. Such statements have prompted the compilation now to be discussed.
The sizing analyses of wet grinding at 50 percent speed in table 13 have been brought together with those of dry grinding in table 14 at that same speed. The upper part of the table is for chert and the lower part for dolomite. Throughout the table it holds true that with the heavy ore charge the coarse particles were reduced more in wet than in dry grinding. The reverse is true when the ore charge is light. Midway, that is at about 75 pounds of ore, the degree of selective grinding was about the same. With that charge, closed-circuit work would be expected to develop the same type of circulating load, whether wet or dry.
In wet grinding the heavy ore charge in the mill would give a closed-circuit product with the minimum amount of coarse particles, but in grinding the advantage would be in favor of the small ore charge. Hence, it is seen that the writer who said that “the median diameter of the circulating load is larger when grinding wet than when grinding dry” did not realize that the median diameter might depend on the amount of ore in the mill.
