Acid leaching has been used in the uranium milling industry since the mid-forties and has accounted for a majority of the production since that time. It is preferred over carbonate leaching because of its greater efficiency in recovering uranium. Consequently much research has been done on the factors which influence the kinetics of the oxidation of uranium, as well as those which influence the leaching process as a whole. This knowledge can be applied to the study of in situ leaching. The following is a survey of the uranium kinetics literature with particular regard to the oxidation of uranium by iron Fe(III) in acidic solutions, and of literature pertaining to acid leaching in general. The kinetics literature for pyrite and molybdenite, minerals commonly found in uranium-bearing ores, is also briefly reviewed. A more comprehensive review is available elsewhere.
Uranium occurs in reduced ores in the tetravalent form in oxide minerals such as uraninite and pitchblende (mainly UO2). In order to be dissolved by acid, the uranium must first be oxidized to the hexavalent form, which then dissolves as various uranyl sulfate species such as UO2SO4 UO2(SO4)2²- , UO2(SO4)3 4-, and UO2²+. Ferric iron has been found to be an effective oxidant for this purpose. The stoichiometry of the reaction is universally agreed to be
UO2 + 2Fe(III) → UO2²+ + 2Fe(II)………………………………………………….(1)
Rhees found that other oxidants such as sodium chlorate and manganese dioxide were ineffective in dissolving UO2 except in the presence of iron. Thus most of the research concerning the oxidation of tetravalent uranium in acid solutions has focused on the use of Fe(III) as the oxidant. In prior studies the acidic media have been acidic perchlorate and sulfate perchloric and sulfuric acid, and sulfuric acid alone.
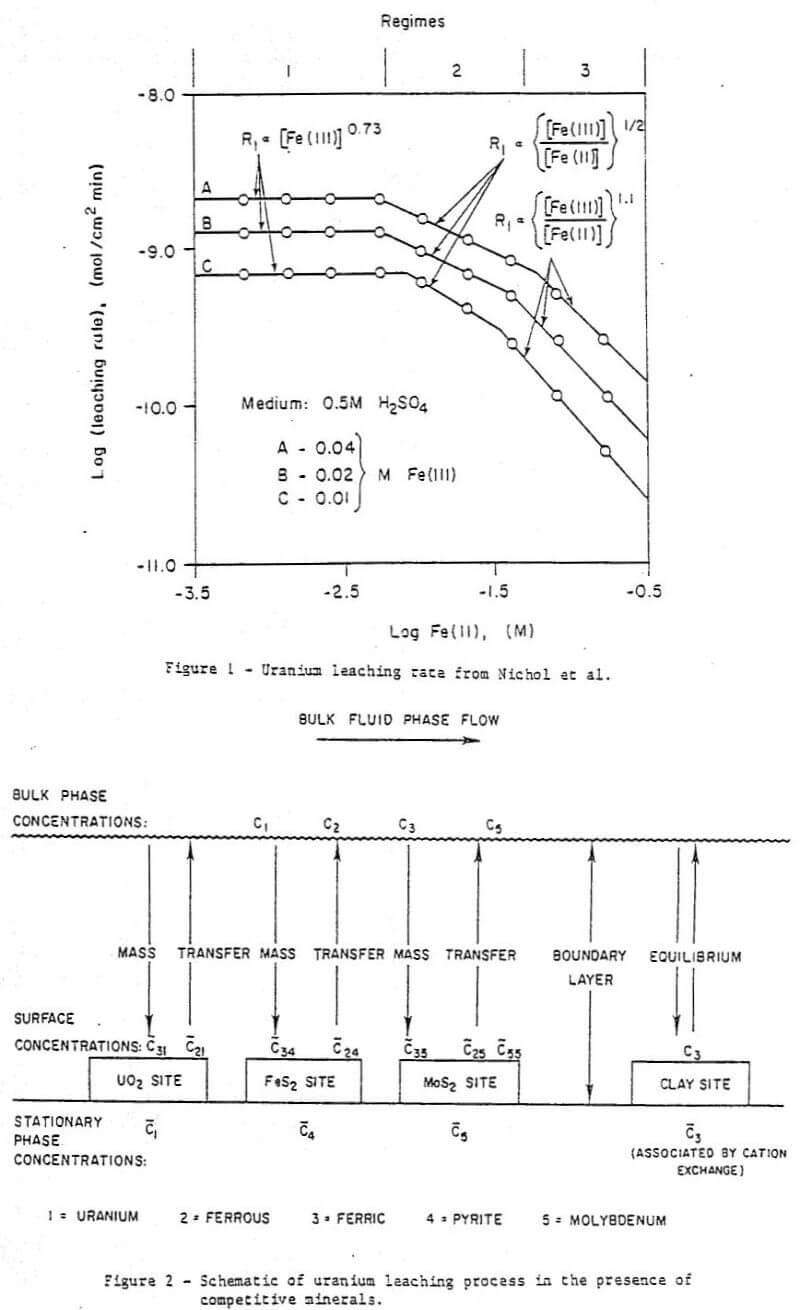
Of the above-cited works that of Nichol et al is particularly relevant here as these authors studied the effect of Fe(II) as well as Fe(III) on the uranium oxidation process. The uranium oxidation rate was found to have three regimes depending on the Fe(III):Fe(II) ratio and the absolute Fe(III) concentration. The regimes were explained in electrochemical terms as follows (see Figure 1) :
Regime 1 – At very low ferrous Fe(II) concentrations the rate of oxidation of Fe(II) at a solid surface is small and the UO2 oxidation rate is dependent on a fractional power of Fe(II) and independent of the ferrous concentration.
Regime 2 – At higher ferrous concentrations the Fe(II) oxidation becomes significant, and the UO2 oxidation rate becomes dependent on the ½ power of the Fe(III):Fe(II) ratio.
Regime 3 – At very high Fe(II) concentrations the UO2 oxidation rate becomes dominated by the Fe(II) oxidation and becomes a function of the Fe(III):Fe(II) ratio to the power of 1.1.
The three regimes are predicted by an electrochemical model. The reader is referred to the original paper for a detailed explanation of the mathematical treatment.
In addition to the above, Fe(II) can affect the heterogeneous oxidation of UO2 in two other ways:
- absorbing on the solid surface, as do other cations, and
- inhibiting the desorption of reaction products (which are present at the most reactive sites) as proposed by Laxen.
Since Nicol et al explained the behavior of a system containing Fe(II) using only the effect shown in Fig. 1 it would seen probable that this is the more important effect. It is the only effect considered here.
The apparent activation energy for reaction (1) ranges from 16.2 to 22.7 kcal/mole, with the larger figures generally believed to include a contribution from the heat of hydrolysis.
The chemical leaching of pyrite FeS2 by an oxidant has been applied to the production of sulfuric acid (and simultaneous leaching of uranium ores) in a pressure reactor and to the desulfurization of coal containing pyritic sulfur. Since these are high pressure and/or high temperature applications which usually involve oxygen, they are not very relevant to the study of in situ leaching of pyritic uranium ores by acidic ferric sulfate solutions. Garrels and Thompson conducted a study of the oxidation of pyrite in conditions closer to those existing for in situ leaching. The reaction equation is:

Garrels and Thompson studied the rate of oxidation of pyrite in acidic ferric sulface solutions and postulated a reaction mechanism whereby (2) is preceeded by an adsorption step-in which both Fe(III) and Fe(II) are adsorbed on the pyrite surface. The reaction rate would then be proportional to the fraction of the surface occupied by ferric ions. The resulting reaction rate was found to agree with experimental data from three sources.
Molybdenite (MoS2) probably reacts with ferric iron according to the following equation:

As with pyrite, most of the oxidizing capacity of the solution goes to oxidize the sulfur to sulfate. The literature of molybdenite oxidation is sparse and indicates an as yet unquantified tendency for Fe(II) to inhibit reaction (3).
Preliminary calculations – Quantitative characterizations of the physical effects of dispersion, and mass transfer are required so that these may be included in the model described above.
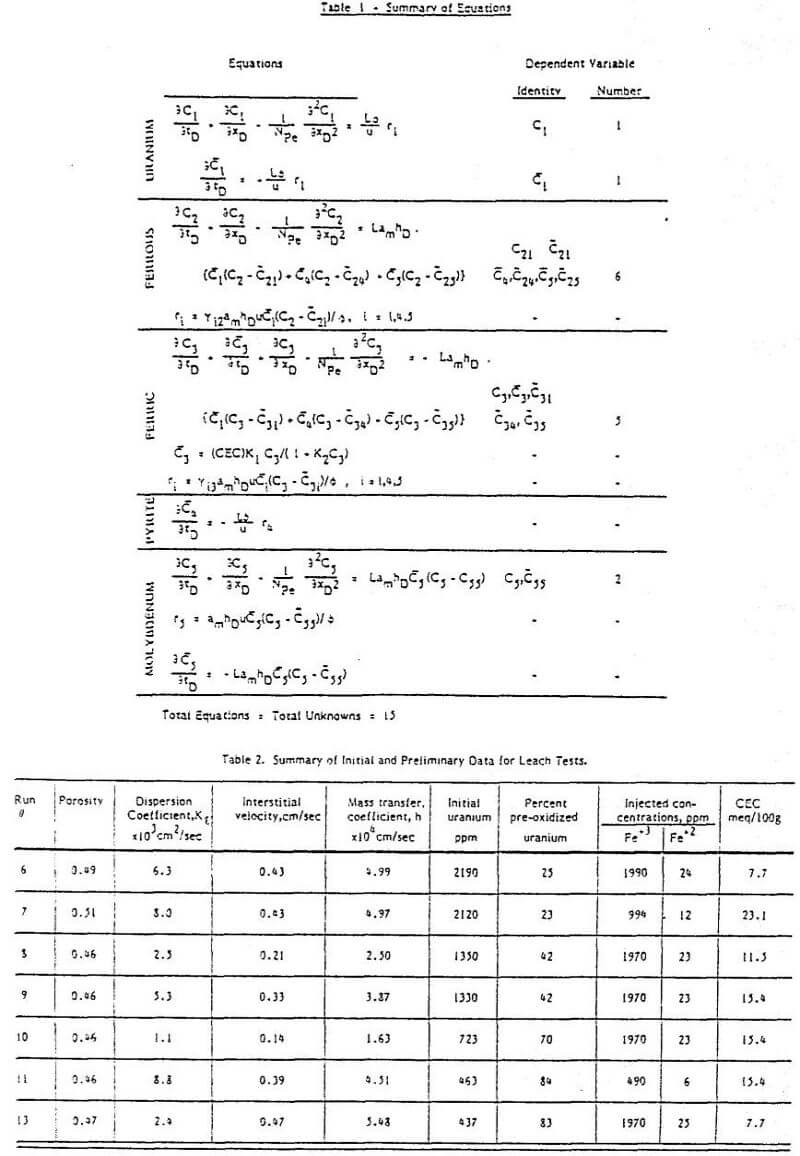
Dispersion coefficients were determined at the end of each run under the conditions of the leach experiments. For the six laboratory leaches described here the dispersion coefficients ranged from 1.1 to 8.8 x 10-³ cm²/sec (see Table 2) with Peclet numbers from 25 to 100. These values are in agreement with published correlations for unconsolidated porous media.
The summary of low Reynolds’ number mass transfer data given above was used to estimate mass transfer coefficients for the various runs. Based on a measured BET surface area of 2.5 m²/gram, a average particle diameter of 326 µ, and an assumed diffusion coefficient of 10 -5 cm²/sec, we determined that Equation (12a) was appropriate for the leach tests. From Equation (12c), therefore, we may calculate the mass transfer coefficient only from the interstitial velocity and the porosity. These values are in the fifth column of Table 2.
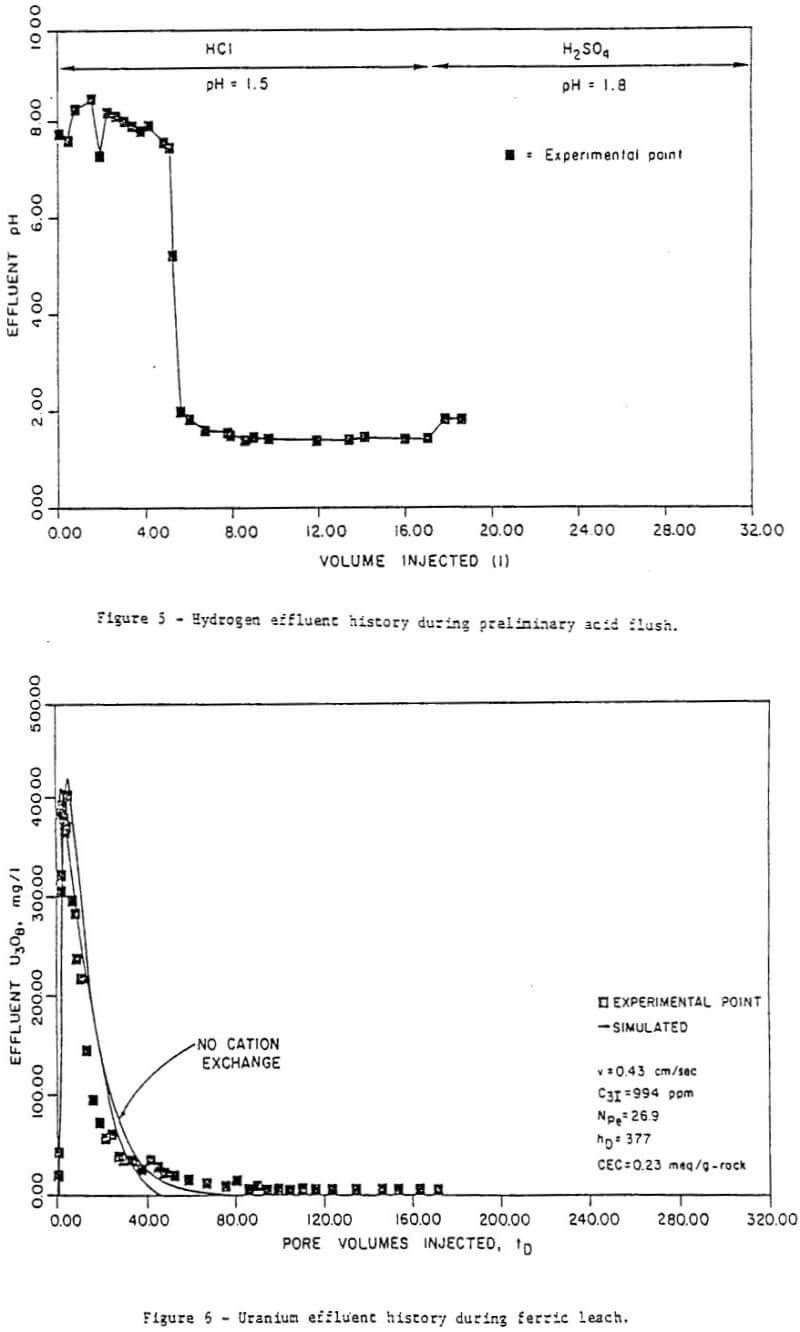
Preliminary acid flush – The purpose of this part of the leach was to acidify the column by dissolving acid-consuming materials. Figures 3 to 5 show effluent concentration histories for uranium and calcium, as well as effluent pH histories, for run 7. Run 7 is the run used for illustration throughout this paper because it had the smallest amount of pre-oxidant uranium production (column 7, Table 2), and because its results were typical of all the runs.
The uranium histories (Fig. 3) indicate an initial small production of uranium which is thought to represent the uranium already solubilized in the groundwater. Once the groundwater is displaced, no more uranium is produced until the pH drops to 2. At this point, considerably more uranium was produced as oxidized uranium dissolves in the acid solution. This pre-oxidant uranium production was a feature in all the runs and indicated some uranium oxidation prior to the acid flushes, probably in the ore handling processes. The percent pre-oxidation ranged (Table 2) from 23 (run 7) to 84 percent (run 11). Note that the “initial” uranium concentrations given in Table 2 and used in the history matching are after the preliminary acid flush.
The calcium histories (Fig. 4) indicate a high level of calcium in the effluent which drops off rapidly as calcium carbonate is dissolved. The drop occurs at approximately the same rime as the drop in pH. However, high levels of calcium in the effluent, and therefore significant amounts of carbonate in the ore, still remain even after the effluent pH has dropped. For this reason, injection of ferric iron cannot begin until the calcium concentration has reached acceptable levels, which as seen in Figure 4, requires about 14 liters preflush.
Leach runs – Table 2 gives the experimental conditions for each of the seven runs. The variables were initial ferric concentration and fluid velocity. Unfortunately, due to the considerable pre-oxidation of the ore, uranium concentrations at the start of a leach were also variable. These were determined from material balance by integrating under the uranium production curves and given in Table 2. Very little iron was produced in this step, indicating insignificant pre-oxidation of pyrite. Thus, its concentration at the beginning of a leach was taken to be the originally measured concentration.
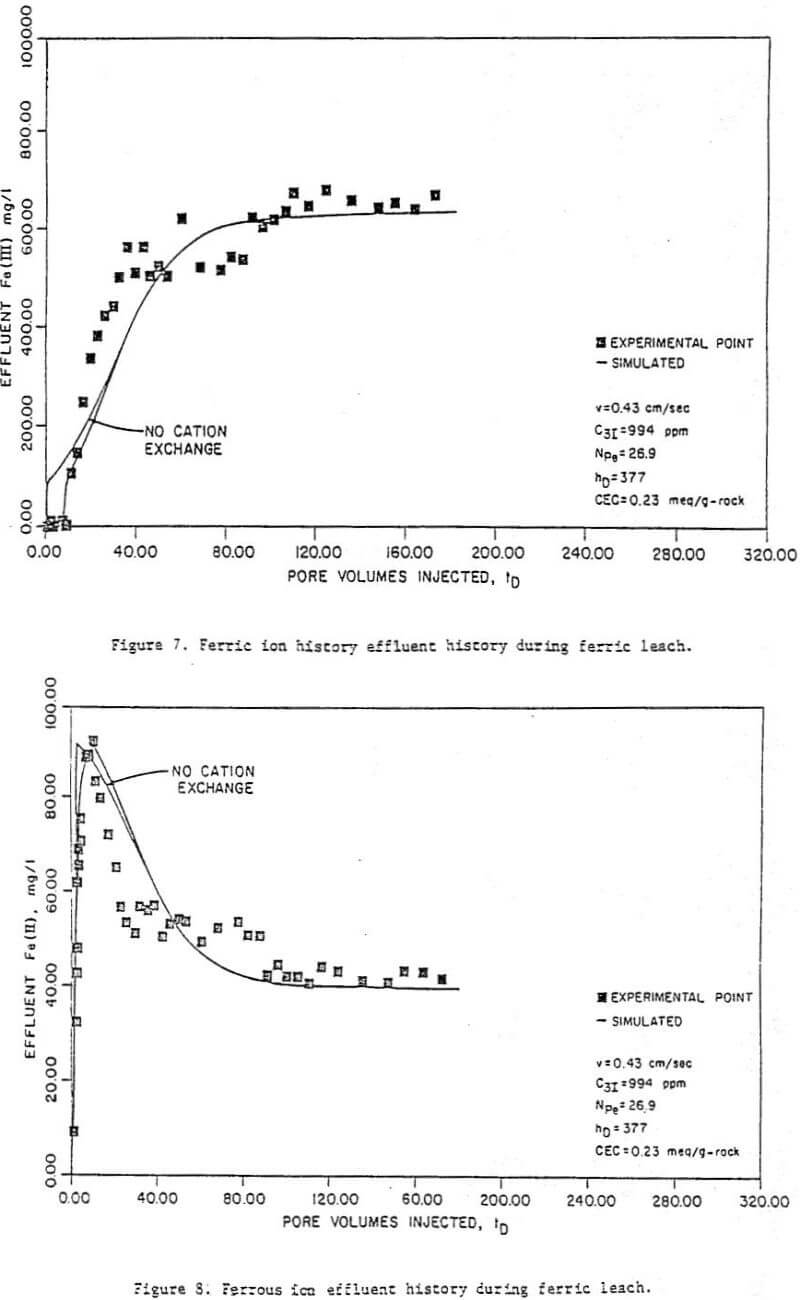
From each leach experiment, concentration histories for uranium, reported as U3O8, molybdenum, and ferric and ferrous iron were obtained. The computer model was then used to generate concentration histories which were matched to the experimental ones by manipulating the parameters which affected their behavior. These were cation exchange capacity, mass transfer coefficients, and kinetic constants. The dispersion coefficients were set by the results of the dispersion runs given in Table 2.
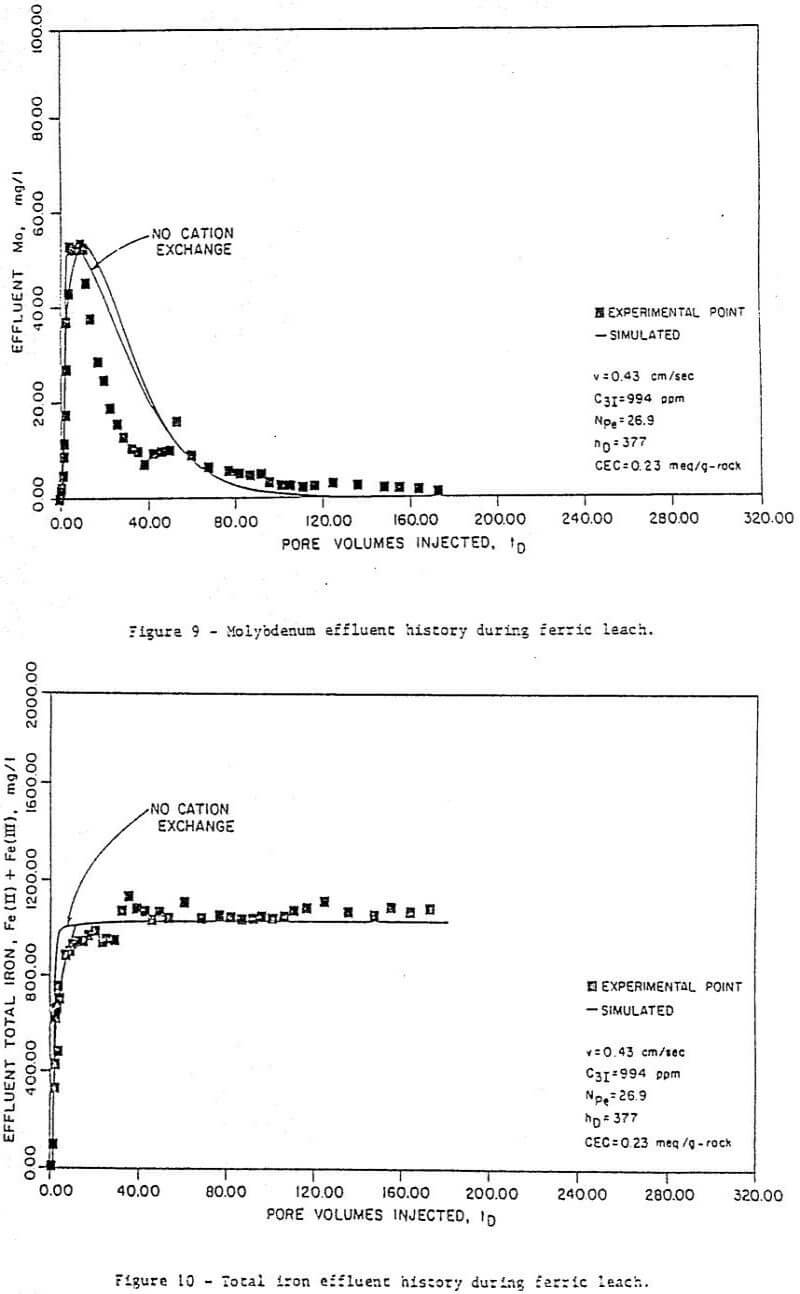
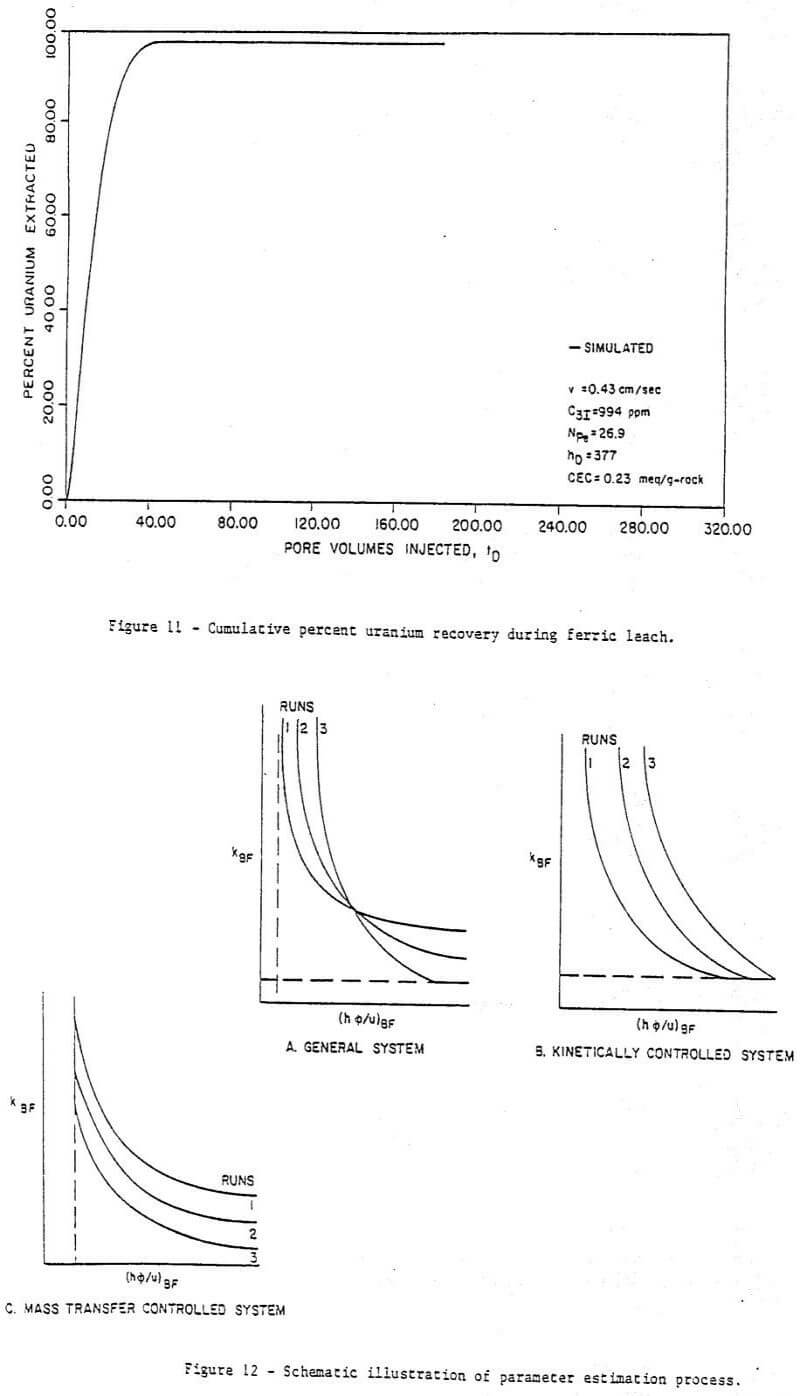
Figure 6 to 11 are a series of plots showing the experimental data (points) and the best fit obtained (by inspection) with the model for run 7. These are concentration histories for uranium as U3O8 (Figure 6), ferric (Figure 7), and ferrous (Figure 8) iron, molybdenum (Figure 9), and total iron (Figure 10), as well as cumulative percent recovery of uranium (Figure 11 – experimental points not shown) with time. The manner in which the parameters corresponding to a “best fit” were obtained is described below.
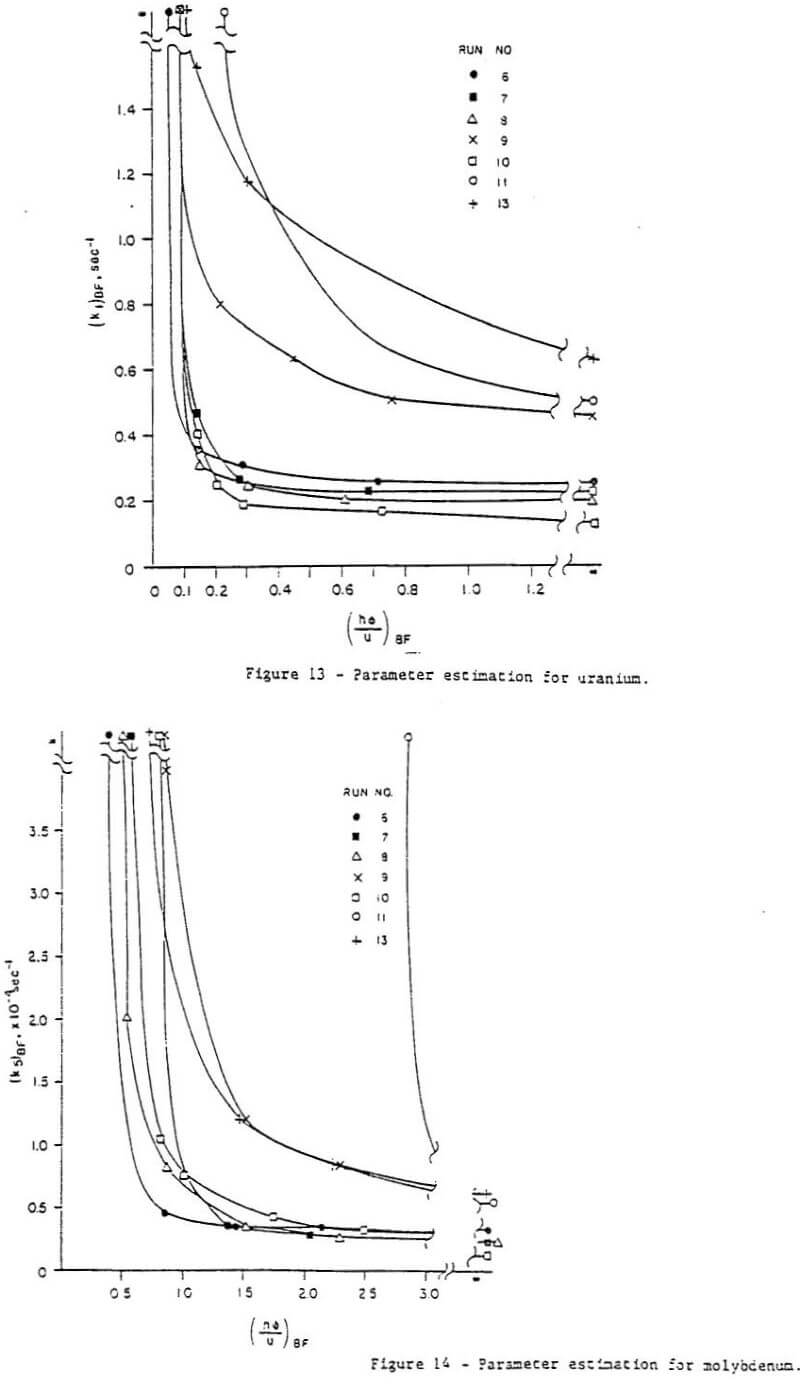
Parameter fit – It was determined from manipulation of the parameters in the computer model that the data could be matched reasonably well whether mass transfer control (k” large) or kinetic control (h large) was assumed. Simply matching the experimental data did not ensure that the mass transfer coefficients and kinetic constants so obtained were reasonable or even represent a unique solution. Thus another criterion was needed – consistency among the runs. Such a requirement dictated that the kinetic constants obtained from matching all the runs be equal (recall that temperature and pressure is constant for all runs). Moreover, the mass transfer coefficients obtained must be consistent, i.e., they must have been calculated in the same manner. It can be seen from Equation (12c) that the group hD should be constant for all runs.
