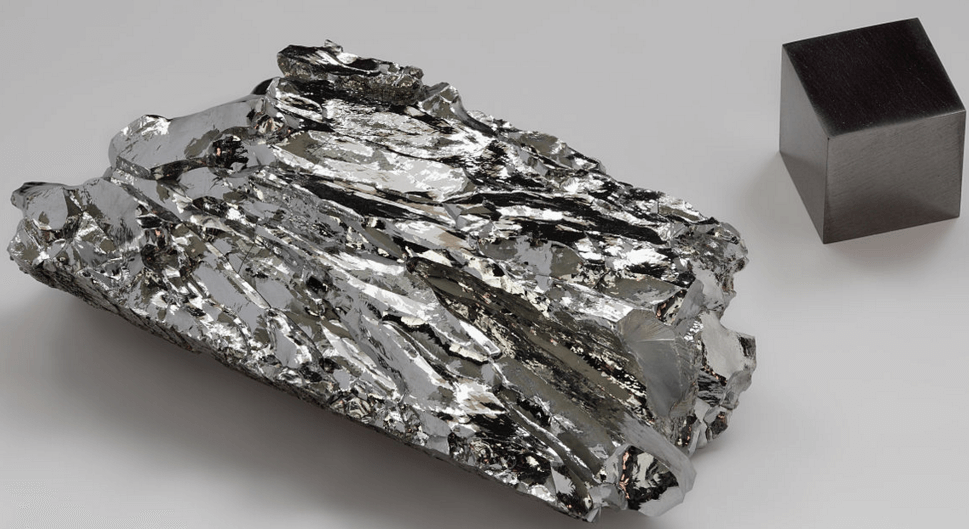
A complete list of the elements includes 18 that melt above 1,700° C. There does not exist one complete thermal equilibrium diagram for any pair of these 18 elements. Several of these elements have been combined, in relatively small proportions, with metals of lower melting point: e.g. tungsten, molybdenum, and vanadium, in steels, or with nickel and cobalt; but of this refractory group, platinum is the only one that has been extensively studied in this connection.
When one considers that, with few exceptions, the industries have made use of alloys to the exclusion of pure metals, it is reasonable to expect that alloys of this refractory group will invade fields in which the pure metals have found little application. The past neglect of this class of metals has, no doubt, been partly due to the rarity of some of them, for even though alloys of very valuable properties should be developed, their cost, unless in exceptional applications, would be prohibitive.
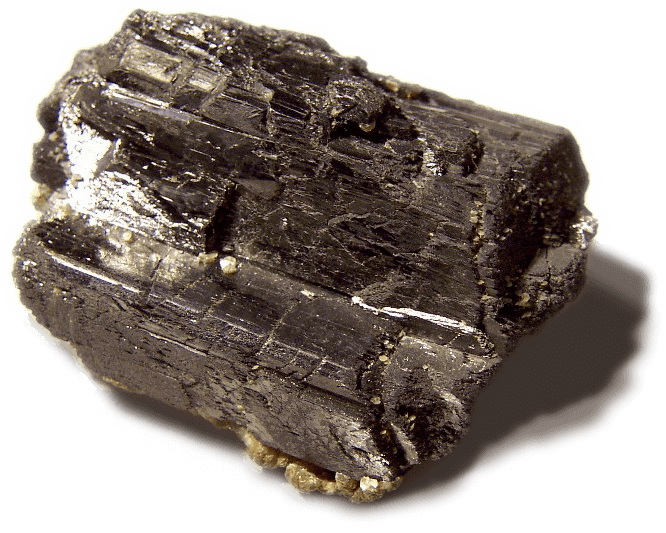
There is also a well-founded reluctance to undertake research involving very high temperatures which, in the case of most of these elements, must be accompanied by an inert atmosphere as well. This combination of high temperatures and control of atmosphere within the heating chamber of any furnace of present design is a difficult problem.
It is the purpose of this paper to give results, of an investigation of one binary series of this group, in which methods were employed that avoided the usual difficulties accompanying high-temperature alloy investigation.
Historical—The alloys of tungsten and molybdenum have received very little consideration during the past. A review of available literature reveals very little regarding this system, and that which has been recorded seems to be at fault. Mennicke writes, “Die bekannteste Verbindung entspricht in ihrer Zusammensetzung der Formel W2M03. Es sind dies Kristalle von debeutender Harte und Festigkeit mit grossen Flachen. Die Farbe ist silberweissglanzend, die Dichte 14.8” “(a) W2M03: Wird durch Reduction des Molybdanbioxides mit Wolframsilizid in Gegenwart von Kalks dargestellt nach
W2Si3 + 3MoO2 + 3CaO = W2Mo3 + 3CaSiO3
(b) WMo: Dies Komposition ist weniger bekannt. Sie ist von”Stavenhagen und Schuchard durch aluminothermische Reduction einer Mischung von Molybdan- und Wolframsaure nach bei Weissglut im Schamottetiegel dargestellt worden.”
WO3 + M0O3 + 2AI2 = WMo + 2Al2O3
These two references are practically the sum of recorded experiments on tungsten-molybdenum alloys, as revealed by available literature. Referring to the original work of Stavenhagen and Schuchard, there seems to be small ground for the assumption of a definite compound as expressed by Mennicke. My own studies on this series have not revealed a compound of any formula.
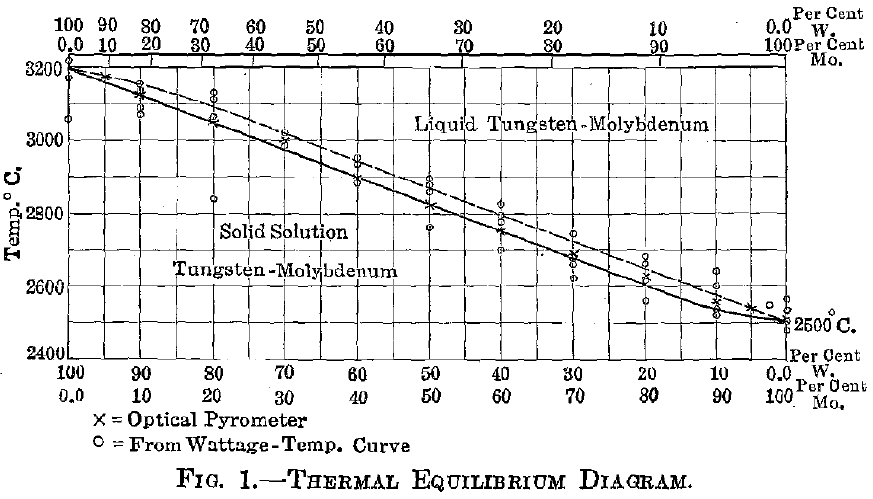
Experimental—A preliminary account of this series has already appeared, but since that time more detailed work has been done in order to definitely locate the melting-point curve, and also to verify the equilibrium constituents for various percentage ranges. The materials, methods, and apparatus used in these experiments are those which have been described in my earlier paper. The fusing-point curve shown in Fig. 1 was located by means of an optical pyrometer. This was roughly checked by measuring the electric current necessary to fuse specimens of standard cross-section and of uniform length. The test specimens were prepared by compressing the mixed powders (reduced from the mixed and ground chemically pure oxides) into briquets, under standard pressure, which were then heated to near the melting point and afterward ground on an emery wheel to standard dimensions. These test-pieces were then mounted between tungsten electrodes in a chamber filled with hydrogen. The amperage and voltage in each case was accurately recorded, and the amperage was advanced in increasingly small steps until the circuit was broken by fusion of the specimen. From these figures the resistance of the specimen at the melting temperature was calculated.
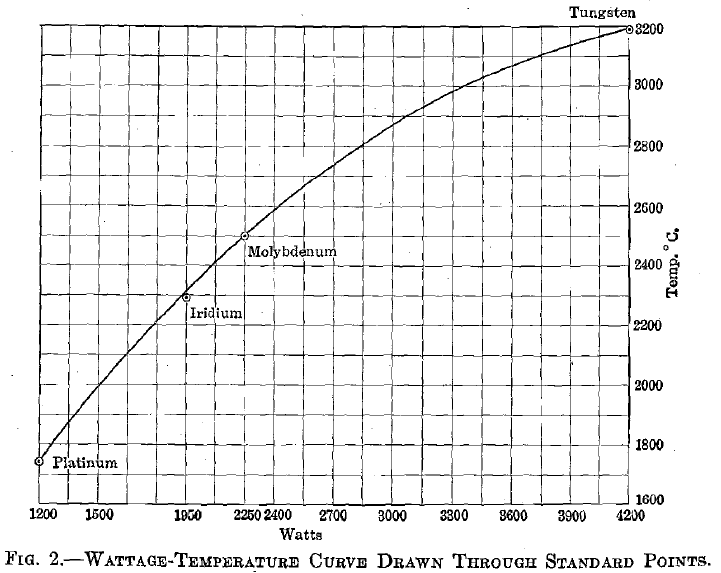
The heat generated in a closed circuit by an electrical current is independent of the resistor and. is directly proportional to the square of the current and the first power of the resistance; while the heat lost varies according to a higher power of the temperature. The method of determining temperatures from wattage-temperature curves is common. It is often employed in temperature control of resistance furnaces; it is used to determine temperatures of incandescent lamps; and forms the principle upon which certain optical pyrometers are constructed. It is also used in the preparation of certain high melting-point industrial alloys. As used in the present work, a standard wattage-temperature curve was first located by fusing specimens of platinum, iridium, molybdenum, and tungsten, respectively, under conditions identical with those to be employed for the unknowns. The heat losses by conduction to the electrodes and by convection with the reducing gas, are assumed to have been equal for standards and unknowns, throughout similar temperature ranges. Energy losses due to radiation are dependent upon the emissivity of the hot body, which is different for each substance, varying also with
the physical nature of the radiating surface. It is thought, however, that the range between 2,500° C. and 3,200° C. is very closely located for the varying percentage alloys when each limit has been fixed by the corresponding end-member of the series.
Fig. 2 shows a curve drawn through points representing the melting temperatures of the standards as ordinates, and the current necessary to fuse each, as abscissae. The dimensions of test specimens, the flow of inert gas, and other conditions, which might cause fluctuations, were kept as nearly constant as possible. The rather erratic results obtained by measuring the current required to fuse the alloys are due, not to a basic fault in the method, but to the improper conditions under which it was employed. In a proper application of this method of alloy investigation, the specimen should be of such dimensions as to furnish considerable resistance to the heating current and to have comparatively small carrying capacity, so as to simplify the accurate reading of volts and amperes.
In the experiments here described briquets were used of 20.7 sq. mm. cross section and with a uniform length of 2 cm. between electrode faces. The tungsten electrodes were, in turn, imbedded in heavy copper bars, which gave ideal conditions for large conductivity losses. Under these conditions a current of 525 amp. and of only 8 volts was required to fuse specimens of pure tungsten, thus bringing both of these factors into the range of difficult reading with the wide-range instruments available.
Table 1 gives average wattage data for a typical series of these alloys.
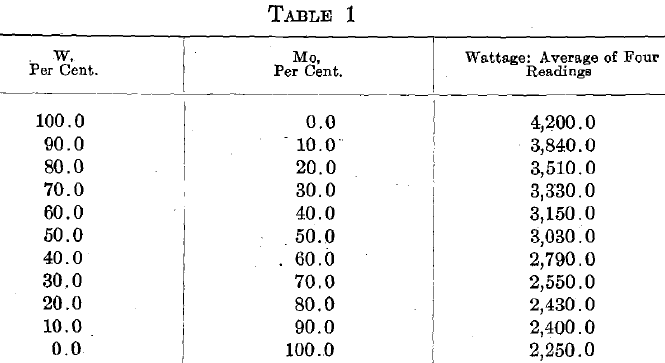
A brief description of this “electrical” method of investigating alloys is included with this report on the tungsten-molybdenum system despite the rather erratic results given by it (which are due to improper working conditions), because the entire high-temperature alloy field is thus brought within the range of comparatively easy investigation. The writer is at present employing it in the investigation of several alloy series of the refractory metals, and under such conditions that it reveals temperature fluctuations of a more delicate nature than will the optical pyrometer. The electrical resistance readings of any specimen furnish the points of a curve on which any sudden change due to the separation of a new constituent may be detected.
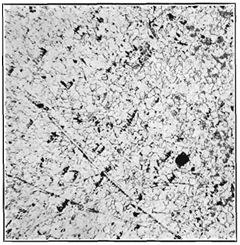
Fig. 3- Alloy 50 per cent Mo, 50 per cent W x 250. (Black spots are due to residual porosity of compressed briquet.)
In the tungsten-molybdenum series no attempt was made to define the liquidus curve; for as yet no method has been devised for this purpose. The rather narrow solid-liquid range indicated on the equilibrium diagram, Fig. 1, has been tentatively constructed from observation of the suddenness with which fusion took place, and of the lack of definable segregation, or “coring,” within the crystal grains. It is quite probable that the fusion-point curve corresponds to the liquidus for a short distance near the tungsten end and to the solidus throughout the remainder of the curve; for near the upper end the amount of liquid (molybdenum) first formed may be slight, while near the lower limit the amount of liquid is large. However, this condition could exist only momentarily, if at all; for with even rapid heating equilibrium takes place very quickly. There might be sufficient lag, however, to cause the circuit to break at the solidus near the molybdenum end and at the liquidus near the tungsten end.
No critical point of any kind was observed within the series, which is evidence in favor of the complete isomorphism of tungsten and molybdenum. Breaks of a delicate nature could not have been detected under
the described conditions, by noting any change in resistance during heating, but those caused by the formation of a separate constituent are not likely to have been overlooked.

Microscopical examination of the alloys gave final evidence of the complete isomorphism of these metals, for no new constituent was observed at any percentage composition. Fig. 3 shows a typical solid-solution structure and is representative of the entire series.
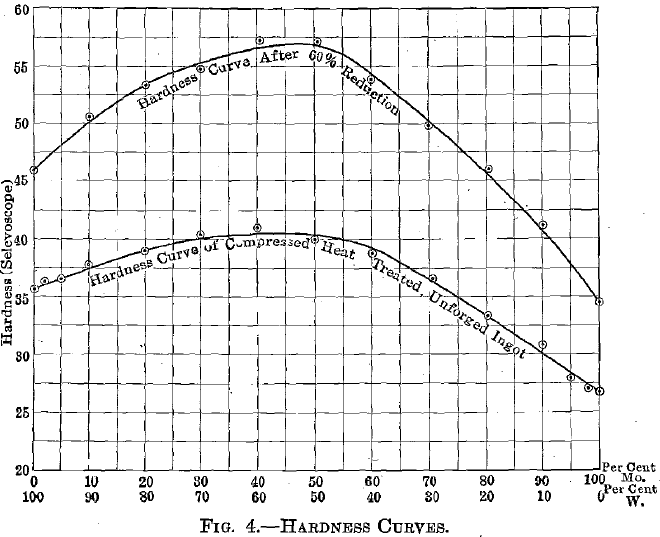
Fig. 4 shows the hardness (Scleroscope) curves of this series. This cannot be taken as giving exact figures for either ingot or wrought tungsten, for in making these ingots a certain amount of porosity is unavoidable and is eliminated only after considerable working. The upper curve, however, should closely check values for the dense-wrought alloys.
Fig. 5 is a curve giving the temperatures at which specimens that had undergone about 60 per cent, reduction, would equiaxe in 10 sec. The position of this curve will vary, of course, with the different degrees of cold working, but it indicates an advantage of higher annealing temperature for the alloys over the pure components.
Summary:
- By compressing the mixed reduced powders of tungsten and molybdenum into briquets and then heating with an electric current in an atmosphere of hydrogen, alloys of this series were prepared varying in composition from 100 per cent, tungsten to 100 per cent, molybdenum.
- The solidus curve for the series was located by means of optical pyrometer temperature measurements and checked by comparing the fusing current with a standardized wattage-temperature curve.
- The equilibrium diagram for this series shows no critical points, appearing as resistance fluctuations, corresponding to a separation of a new phase. Its construction has been based upon this fact and upon results of microscopical analysis.
- Curves for hardness, and for equiaxing temperatures, are smoothly convex, being typical of an uninterrupted series of solid solutions (mixed crystals).
- As a result of thermal and microscopical analysis, the metals tungsten and molybdenum are reported to be completely isomorphous.
- All alloys of this series are malleable and ductile under proper conditions.
Discussion:
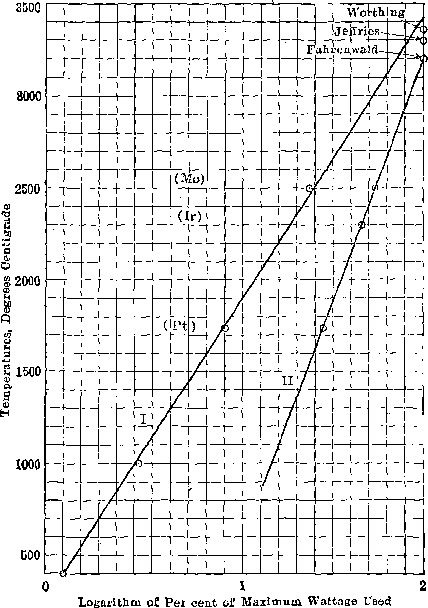
J. W. RICHARDS, South Bethlehem, Pa.—I think that the diagrammatic results can be much more clearly set forth if they are plotted as follows: The present diagram, shown on page 602 of Mr. Jeffries’ paper, plots the variation of wattage with temperature in a very inconvenient and uncertain way. If, however, you plot as abscissas the logarithms of the wattage, you get very nearly a straight line, so that you can interpolate the values with much greater accuracy than you can by using simply the wattage. In the accompanying diagram the abscissas run from 0 to 2, representing the logarithms of 1 to 100 per cent, of the wattage employed. The ordinates are the melting points. Line I represents Jeffries’ results, which extrapolated from 2,500° C. seem to point to 3,430° C. as the melting point of tungsten. Line II gives Fahrenwald’s results, which register perfectly for the melting points of platinum, iridium and molybdenum, and also with Fahrenwald’s assumed melting point of tungsten, 3,200° C. Worthing gives the latter temperature as 3,360° C.
ZAY JEFFRIES.—I would like to say that that is a very helpful suggestion.
THE CHAIRMAN (H. M. BOYLSTON, Cambridge, Mass.).—I notice that Prof. Jeffries draws a full line for the liquidus in the equilibrium diagram and dots the solidus, and that Mr. Fahrenwald does just the reverse, I wonder if there is any explanation of that.
ZAY JEFFRIES.-—The points as actually observed are indicated by little circles, and I noticed, by microscopic examination, a little coring. By coring is meant the separation of the tungsten-rich material from the molybdenum-rich material. Coring indicates that there is a difference in temperature between the solidus and the liquidus; what that difference is, I have no means of knowing, so I suppose that I really should not have put in the indicated difference in temperature between the liquidus and solidus. If I am not mistaken, however, I mentioned the fact in the paper that the liquidus and solidus curves were only tentative.
The System Tungsten-Molybdenum BY FRANK ALFRED FAHRENWALD, E. M., Phd. Cleveland, Ohio
