Table of Contents
I am going to discuss only one more variable that has to do with grinding media and that is CRITICAL SPEED of Tumbling Mills. The throughput of a mill may be increased by increasing the revolutions per minute of the mill. This will give the ore the necessary increase of available media surface needed to accomplish the grinding. Unfortunately, there is a point that is reached where, the CENTRIFUGAL FORCE being exerted on the grinding media will cause the media to enter the CASCADE ZONE too high.
The speed of the mill will also cause the ARC of the cascade to be too large. This means that the TOE ZONE of the media will be out of the POOLING AREA of the mill. This results in a loss of impact on the new feed as it enters the grinding cycle. The CRITICAL SPEED is the maximum revolutions per minute that the mill can revolve and still maintain performance.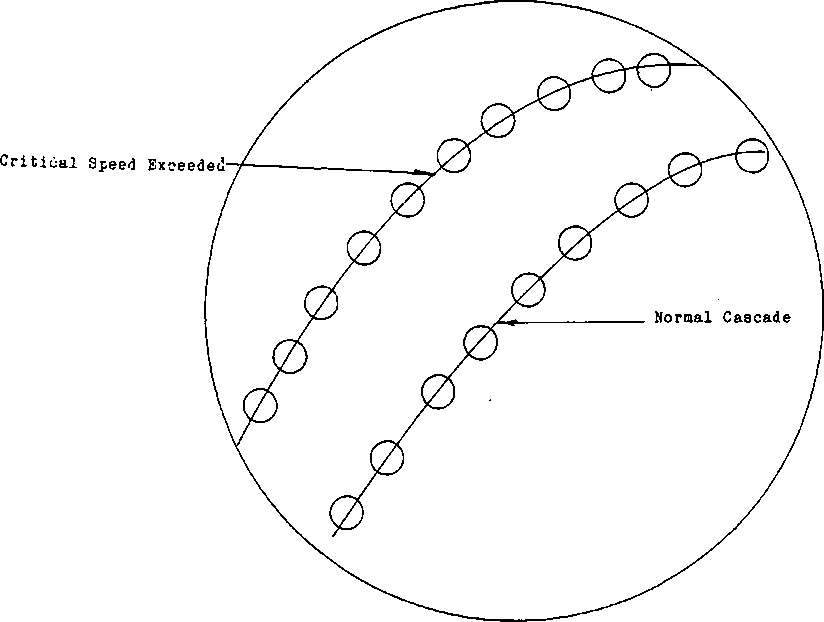
Naturally, the opposite is true as well, if the speed, is too slow the material will cascade too soon losing both impact energy and grinding motion. The size of the grinding media and the speed of the mill will have to be balanced to obtain the maximum grind.
Cascading rods or other types of grinding media over and through the ore is the method that is used to obtain the grind necessary to recover the mineral from the ore. However it is the LINERS that give the grinding media the cascade motion that is required. The design of liners will vary depending on the type of grinding media, the size of the media and the material to be ground.
How to Analyse the Power Draw in Tumbling Mills
Size-reduction or comminution by grinding mills is a power intensive process accounting for the bulk of the power draw of the entire plant. Accurate prediction of power draw has been difficult since a host of operating and design factors need to be considered whose effects are not well understood. For example, it is difficult to predict the ball size distribution effect on the power draw for a given ball load.
T = Mbrgsinα………………………………………………………………………….(1)
where T is the torque, Mb is the mass of the balls, rg is the distance from the mill center to the center of gravity of the load, and α is the angle of repose of the balls. The power draft is given by
P = 2πTN…………………………………………………………………..(2)

With the thickness of cascading layer of balls spanning the distance from charge center (radius ri) to mill wall (radius rm), the charge occupying vertically the space between toe-angle θt to shoulder angle θs and the angular speed of the balls being Nr the power draft of a mill of lenth L using balls of bulk density p is given by

The Numerical Method
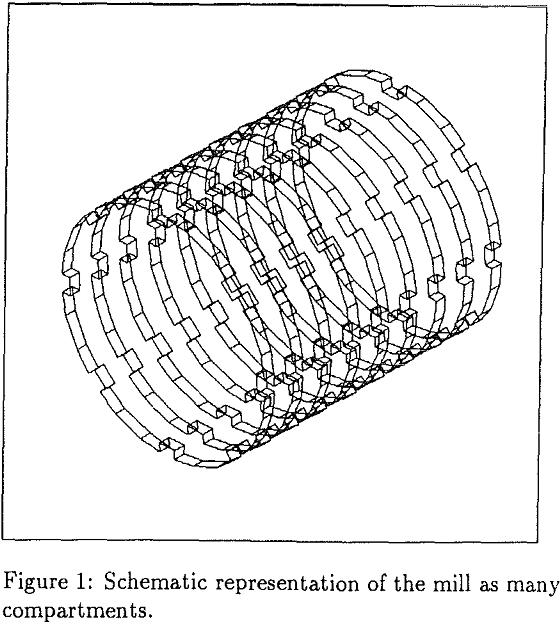
The discrete element method is used to compute the position of individual balls at discrete times as the mill rotates. The dynamic equilibrium equation for each ball can be written in the general form as:
![]()
where x is displacement, [M], [C], and [K] are the mass, damping and stiffness matrix, and f is the applied load. During a small time step t to t+δt, this equation can be integrated by finite difference approximations of the derivatives to update the position of the ball i.
The power draw of the mill under the DEM formulation is computed in the following way: applied torque to the mill is

where for all contacts between ball and the mill shell, the product of the distance, ri, from the mill center to any contact, i, and the shear force, Fshear, is summed. The power draw to the mill is then,
P = 2πNT………………………………………………………………………….(6)
For n compartments, the total power draw of the real mill is
P = nx 2πNT…………………………………………………………………………..(7)
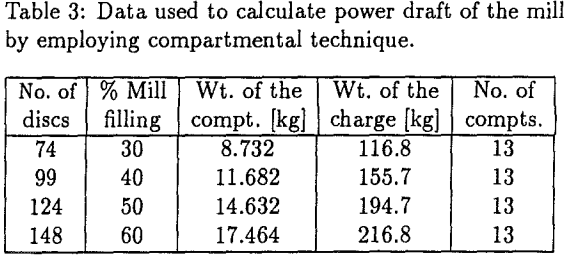
where T is the torque required to drive one compartments. This procedure has been found to be fairly accurate in case of a 55-cm mill and 16-ft mill.
Mill Power Draw Analysis
It is important that the mill power draft be maintained at its maximum, because under this condition the rate of breakage of particles is at its highest value, and hence mill capacity too is at the maximum. Hence this analysis is about the variation of mill power with speed and ball filling. Then keeping the mill filling constant the effect of three key mill operating parameters on power is analyzed by factorial analysis of the data.


Effect of Speed and Filling on Power
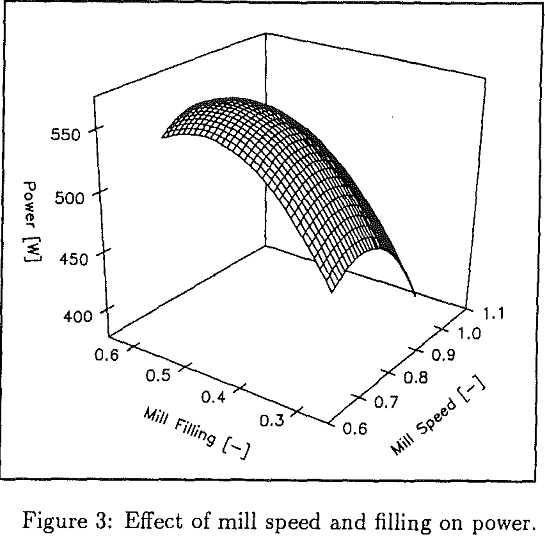
In this section, a 0.545-m x 0.304-m ball mill is simulated to study the combined effect of mill speed and filling on the power draft of the mill. Mill operating speed and filling, among other things, are known to affect the power draft. Mill performance is at its best when these two operating parameters are optimized, while all other conditions remain the same.
P = – 1036+2747xM5+1929x J-1727xn²-1841xJ²……………………………….(8)
Discussion of the Results
A maximum in power is observed in Figure 3. It is also observed that the power draft of the mill increases with filling; at a mill speed of about 80% of critical, it reaches a maximum for about 50% mill filling. At high speeds, however, the power draft continues to increase with filling within the range of operating speeds studied in the simulation.
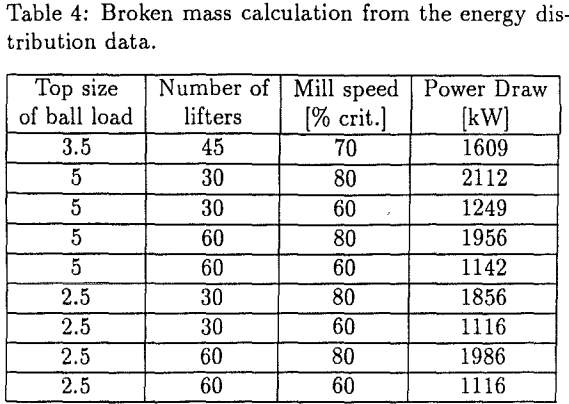
A factorial analysis of the data is done to ascertain the individual effects of the variables on power draw. A linear regression model of the following form is fitted:

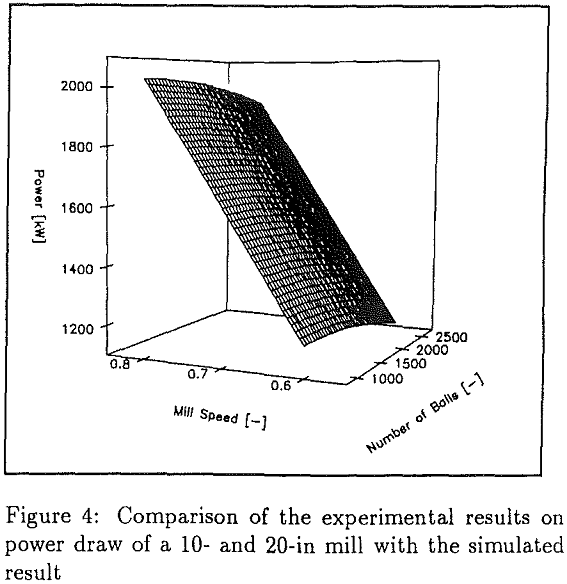
where Nb, Nl, and Ms, are the number of balls, number of lifters, and the mill speed as fraction of critical speed respectively, and C1 through C7 are parameters (constants) that need to be evaluated. It is observed that the mill speed has the most significant effect as C3 is found to be an order of magnitude higher than the other parameters. It is also observed that lifter bars have the minimal effect. Therefore, the following functional form is assumed that do not consider the lifter bar effect:
P = 0.0429 x Nb + 4107 x M3 — 0.000025 x Nb² – 1358………………………………………….(10)
Discussion of the Results
Power draw of the mill as evident from the above analysis is linear function of speed. However, it does not vary linearly with the number of balls for a fixed load.
