Table of Contents
The mineral processing industry has recently shown an interest in developing new collectors that can be used for selective flotation at lower pH levels. The desired end result is to reduce lime consumption and to improve the efficiency of separation in the treatment of complex and low-grade ores (Nagaraj et al., 1986c). One such reagent, O-isopropyl-N-ethylthionocarbamate (IPETC), was first Introduced as Z-200 (Harris and Fishback, 1954) by Dow Chemical Company. Thiononcarbamates like this one have been reported to be more selective than xanthates and dlthiophosphates against pyrite (Glembotskii and Livshits, 1969) and are more stable in acidic solutions than xanthates. However, according to Nagaraj et al. (1986c), they are not considered to be very powerful collectors.
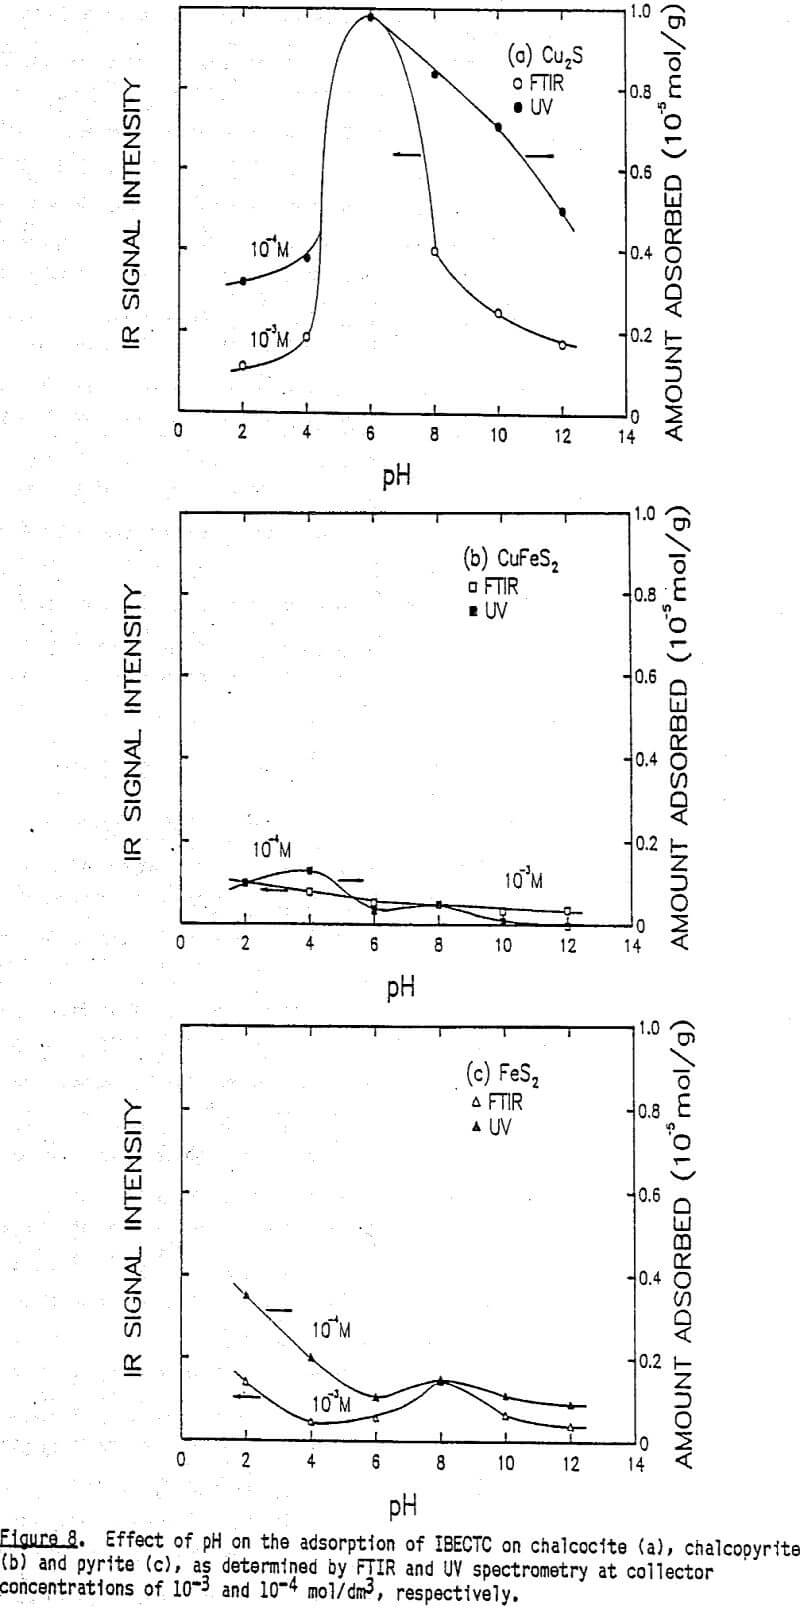
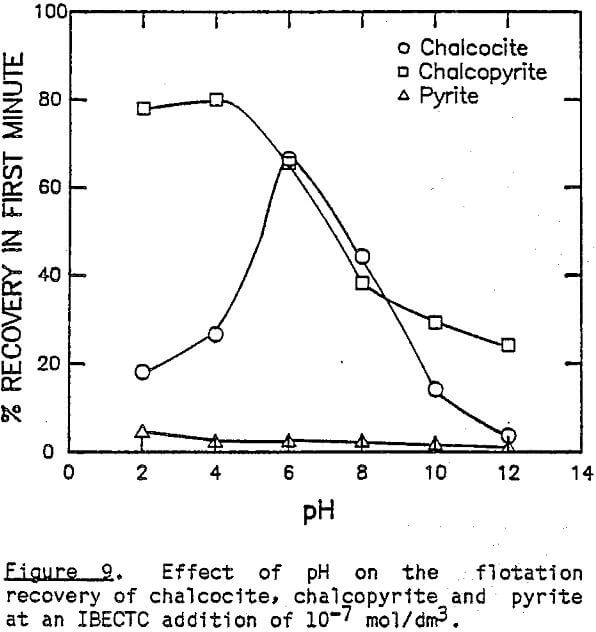
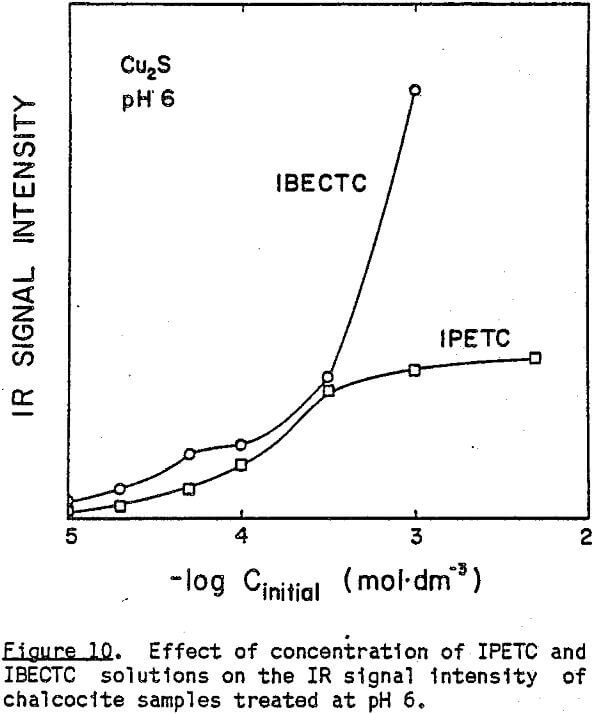
In the present work, an “in-situ” FTIR technique developed by Leppinen (1986, 1987) has been employed to study the adsorption of two different thionocarbamates on chalcocite, chalcopyrite and pyrite. The collectors used were O-isopropyl-N-ethylthionocarbamate (IPETC) and O-isobutyl-N-ethoxycarbonylthionocarbamate (IBECTC). The former has an electron-donating ethyl group and the latter has an electron-withdrawing ethoxycarbonyl group. The results of the FTIR measurements are compared with UV adsorption and microflotation studies.
Experimental
Materials
The mineral samples were acquired from Ward’s Natural Science Establishment. The chalcocite and chalcopyrite samples were both from Messina, Transvaal, South Africa, while the pyrite sample was from Leadville, Colorado. To minimize oxidation, samples were crushed and ground using an agate mortar and pestle. Just before each experiment, which took no more than five minutes. The specific surface area of the -500-mesh fraction used for the experiments was typically in the range of 0.7 – 0.8 m²/g.
FTIR and UV Spectrometry
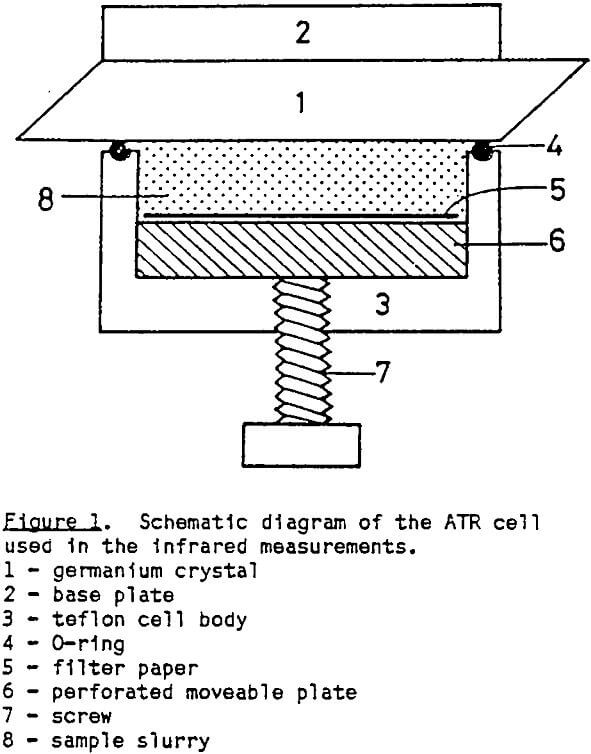
For the adsorption studies, 1 gram of freshly-ground mineral (-500 mesh) was conditioned with 100 ml of thionocarbamate solution for 15 minutes. All of the thionocarbamate solutions were prepared in 0.01 mol/dm³ NaCl solution to maintain a constant ionic strength, and the pH was adjusted using HCl and NaOH solutions. After conditioning, the slurry was transferred into a specially-designed ATR cell to record the FTIR spectra of the adsorbed species. The remaining slurry was then decanted and centrifuged to recover a clear solution for the UV absorbance measurement.
Microflotation
Microflotation experiments were carried out using a 1-gram sample of a -65+100-mesh size fraction. The pH was adjusted using HCl and NaOH solutions. Details concerning the microflotation cell and procedure have been described previously (Basilio et al., 1985; Pritzker et al., 1985).
Results and Discussion
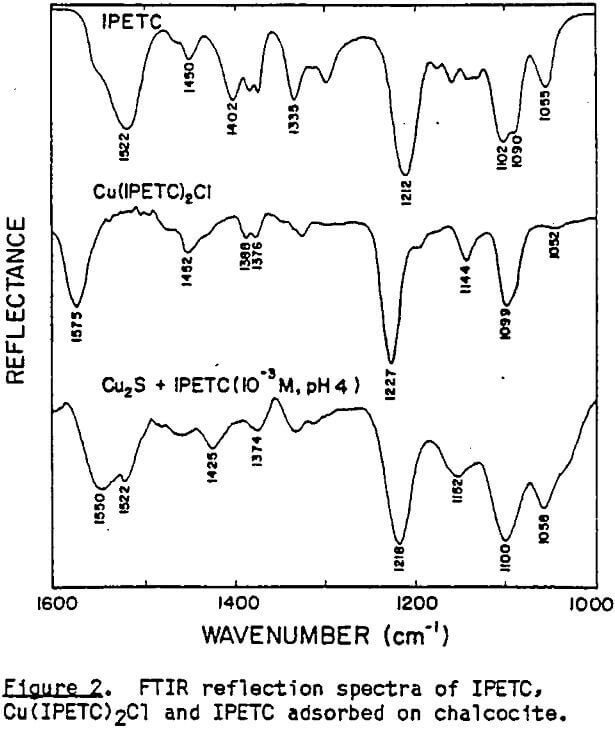
The IR-ATR spectra of liquid IPETC, solid Cu(IPETC)2Cl and IPETC adsorbed on chalcocite at pH 4 are presented in Figure 2. In molecules having a nitrogen atom adjacent to the thiocarbonyl group, strong vibrational coupling occurs, causing vibrations to be mixed and making the spectral interpretation more complex (Rao et al., 1960. The broad bands at 1500-1600 cm-¹ may be designated as mixed vibrations involving contributions from C-N stretching and N-H deformation. The bands at 1300-1360 cm-¹ are usually attributed to C-N stretching, N-H deformation and C-H deformation. It is suggested that the bands of 1090-1100 cm-¹ have contributions from C-N, C=S and C-H vibrations The strong absorption bands at 1210-1230 cm-¹ are most likely due to the antisymmetric O-C=S stretching vibration (Tarantelli and Furlani, 1971), while those at 1130-1150 cm-¹ are due to the symmetric O-C=S vibration (Solozhenkin et al., 1982). The minor bands near 1050 cm-¹ are probably due to C=S vibration.

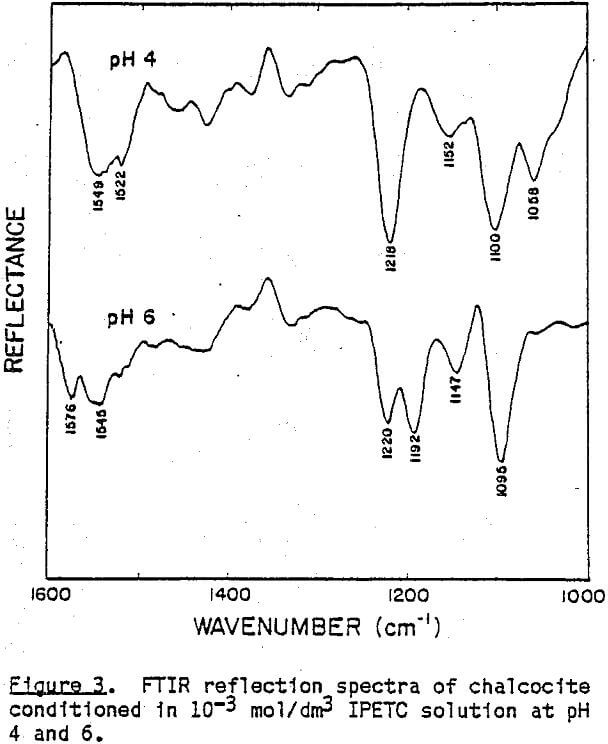
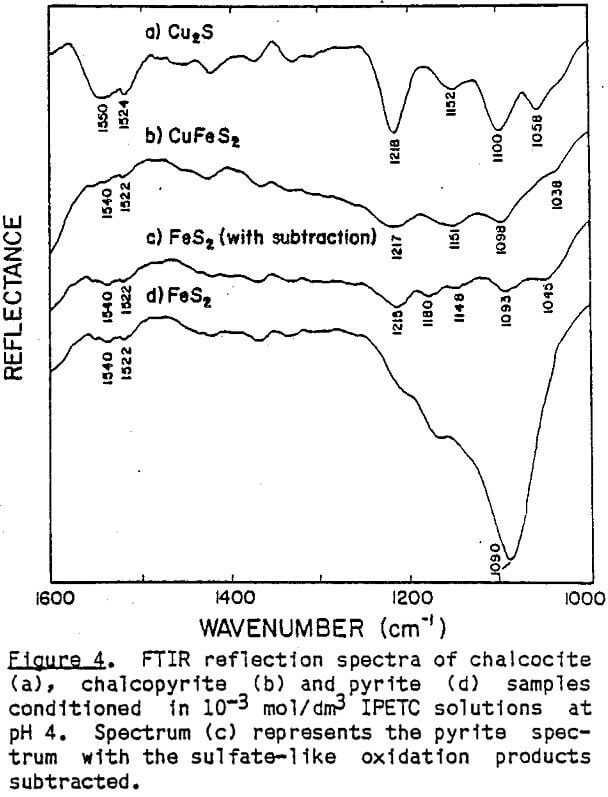
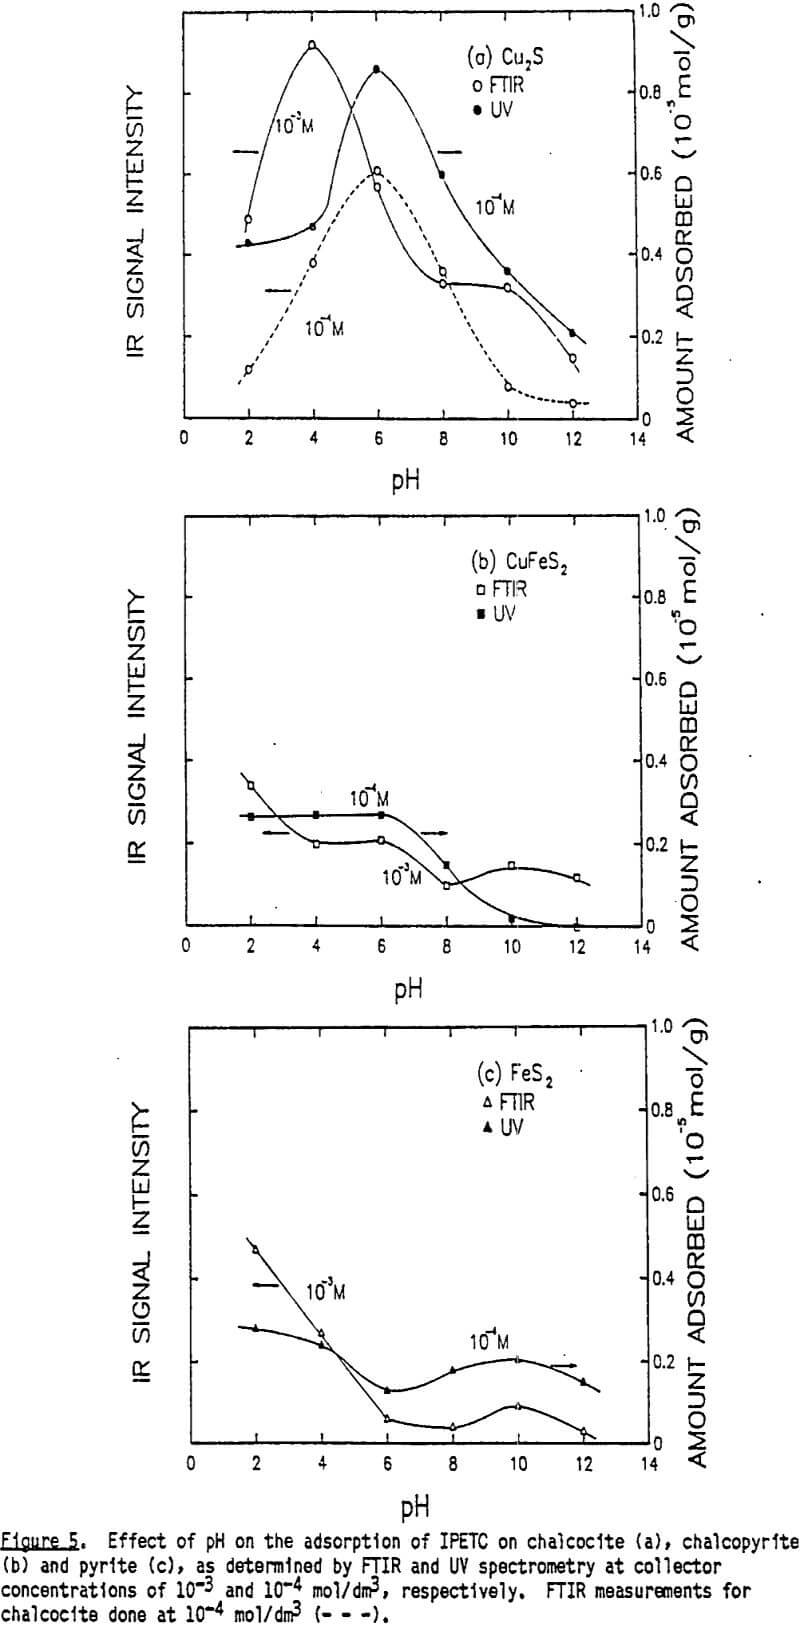
These new absorption bands appearing at pH 6 do not seem to indicate the presence of bulk precipitate because while the band at 1576 cm-¹ is very close to that of Cu(IPETC)2Cl, the band at 1192 cm-¹ is not. It is likely that at low pH values, IPETC coordinates with the surface copper through its sulfur, while at high pH values, the coordination involves both sulfur and oxygen. It is also possible, however, that the changing orientation of the adsorbed collector species associated with multi-layer formation accounts for the spectral difference. The shifts in C-O stretching vibrations may explain the weakening of the carbon-oxygen bond due to the coordination. Considerations of steric accessibility and electron density warrant coordination through oxygen- rather than nitrogen (Glembotskii, 1977).
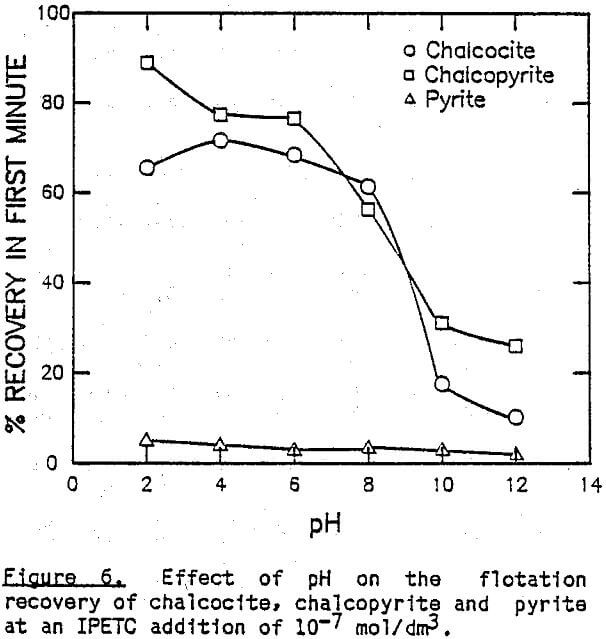
The effect of pH on the flotation of these three sulfide minerals at an IPETC concentration of 10 -7 mol/dm³ is shown in Figure 6. For chalcocite, the effective flotation range is found below pH 8, reaching a maximum at pH 4. Chalcopyrite behaves similarly, except that the floatabillty tends to increase below pH 4. The floatabillty of pyrite, on the other hand, is very low for the entire pH range studied, demonstrating excellent potential for selectivity. It should be noted, however, that the pyrite flotation becomes significant below pH 4 when the IPETC concentration is increased to 10 -6 mol/dm³.
IBECTC
In Cu(IBECTC)2Cl, the stretching vibration of the ester group, C(=O)-O, occurs at 1201 cm-¹, showing a significant- chemical shift from the corresponding vibration observed at 1170 cm-¹ with IBECTC. However, the most significant shift occurs with the C=O stretching vibration, as the peak appearing at 1722 cm-¹ exhibits a shift of 48 cm-¹ toward a lower frequency. Note that the C-N vibration shows a split at 1543 and 1495 cm-¹, which can be explained by the resonance structures of the molecule coordinated to Cu(I):
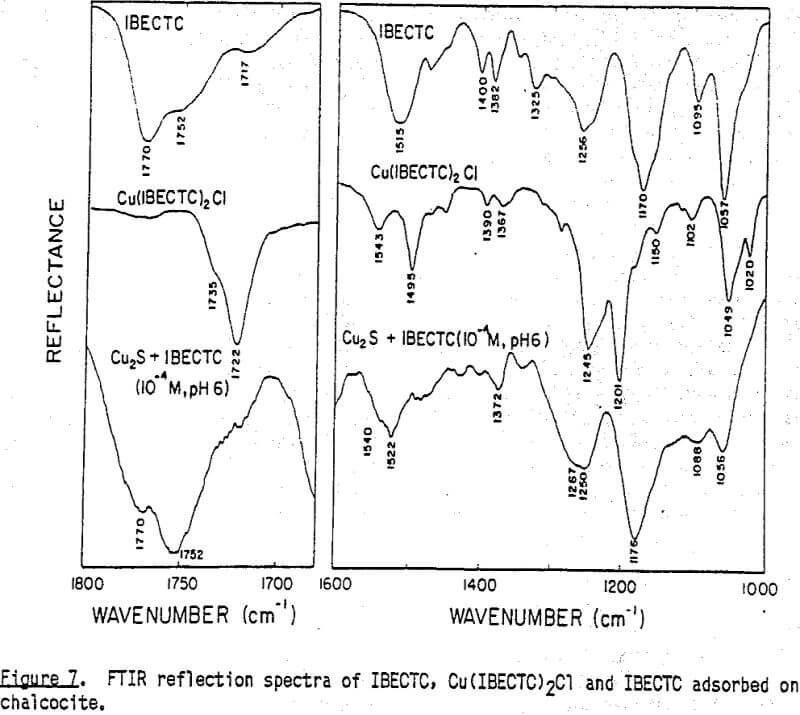

Note here that the shift of the C-N band due to the adsorption of the IBECTC is less significant than that observed with the IPETC adsorption. This suggests that the bonding of the sulfur atom in IBECTC at the chalcoclte surface is not as strong as with IPETC, which can be explained by the difference in the substituents involved. The substituent group in IBECTC adjacent to the C=S group is electron-withdrawing, unlike that in IPETC, which makes the electron density lower at the reactive center of IBECTC. This finding is in agreement with Glembotskii’s work (1977).
