Table of Contents
The effects of temperature on autogenous grinding can be immediately divided into rheological effects and mechanical effects. The rheological effects are a result of the substantial increase in the viscosity of water as the freezing point is approached. The change in apparent slurry viscosity which results from changing temperature is shown in Figure 1. As can be seen, the effect at high percent solids is very pronounced, particularly when the temperature is quite low. This increased viscosity acts to cushion the impact of the media-sized particles, impede transport of slurry, and in extreme cases will cause the media to centrifuge at speeds well below the critical speed. The net result is decreased grinding rate and increased specific power consumption.
- In autogenous milling, temperature can significantly influence the grinding efficiency, particularly if the temperature falls below about 10°C. these efficiency changes can be reduced by preventing recycle water from becoming chilled, and by thawing frozen rock before grinding. Since the magnitude of the efficiency change is reduced at higher temperatures, heating the mill slurry to higher temperatures is unlikely to provide significant benefits.
- Laboratory experiments indicate that the effect of slurry rheology changes with temperature is a significant factor in the grinding rate for both porous and nonporous rock types, with higher temperatures resulting in reduced viscosity and hence increased grinding rate.
Laboratory tests were carried out primarily to determine the extent to which rheology alone would be expected to affect autogenous grinding. These experiments used a 20 cm diameter x 30 cm long mill, rotating at 64 rpm with four 0.5 cm lifter bars. The mill and ore charge were heated in a forced-air drying oven for elevated-temperature experiments, and chilled using a freezer and an ice-water bath for low-temperature experiments. Polyurethane foam insulation was used to help keep the mill at a uniform temperature.
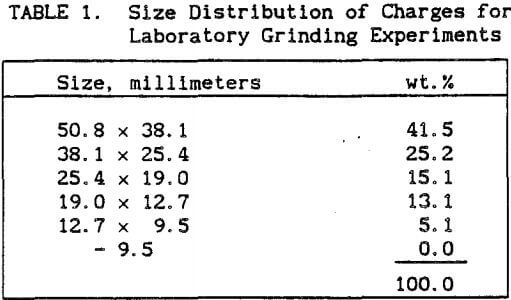
The ore was crushed and mulled to the size distribution given in Table 1, and each experiment used a 5.0 kg charge in 2 liters of water. Six experiments were conducted consisting of three sets of duplicate tests at 2-9°C, 24-26°C, and 84-62°C. For each experiment, the ore, water, and mill were adjusted to temperature, and the ore was ground for 30 minutes. The slurry viscosity and quantity of -100 mesh material were then determined, the -100 mesh material was returned to the mill, the temperature was readjusted, and the cycle was repeated. Viscosity was measured using a Brookfield viscometer fitted with a UL adapter for low viscosity measurements. Results of these experiments are given in Table 2.
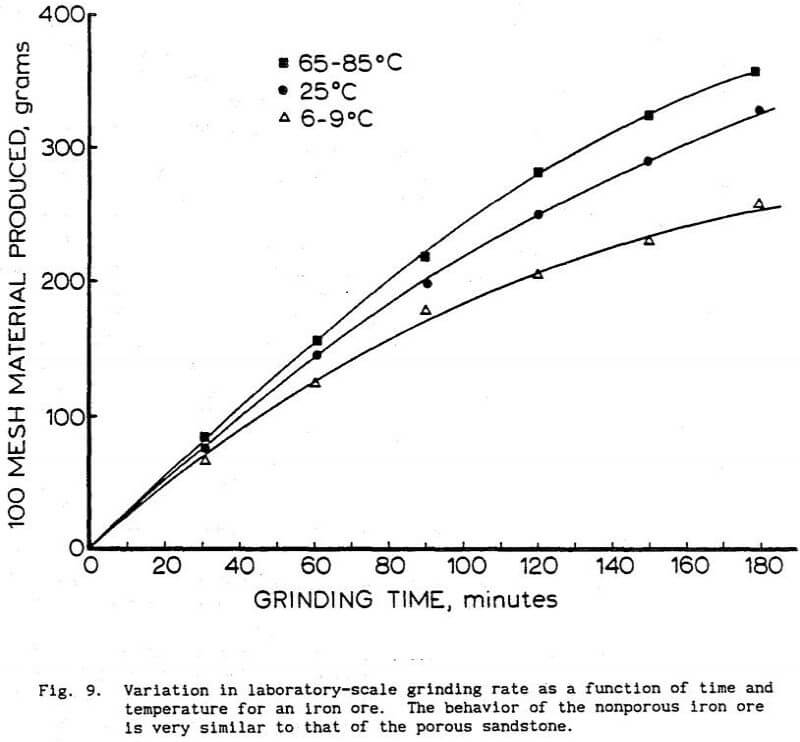
Plotting these data as in Figure 9 again shows a definite dependence of grinding rate on temperature. However, when grinding rate is plotted against viscosity, as in Figure 10. It is evident that some factor other than viscosity is responsible for a portion of the change in grinding rate.
From the laboratory experiments, it is readily seen that the changes in grinding rate are closely tied to slurry viscosity. However, in these experiments the viscosity was not the only factor influencing fines production, as shown in Figure 10. If viscosity were the only relevant factor, tests for all three temperatures should have followed the identical grinding rate versus viscosity curve. The second factor appears to be the quantity of fines in the suspension, as plotting grinding rate versus viscosity for only those tests with similar quantities of fines generates a series of roughly parallel lines as in Figure 11. It is likely that as the fines are accumulating, work is being expended to make the fines finer rather than generating additional fines. It is also possible that the increasing slurry density is cushioning the impacts due to increased buoyancy, thus further retarding the grinding rate.
 |
 |
 |
 |
Plant Studies
The plant site that was chosen for obtaining the samples was an iron ore processing plant, which experiences substantial seasonal temperature variations. The plant has primary autogenous and autogenous pebble mill grinding. The cyclones are set up in parallel banks of nine, with seven of the classifiers in use at any one time. The cyclones are Krebs model D15B—852—M271. This plant processes a very finely disseminated iron ore which requires grinding to -25 microns for liberation.
Sampling was carried out in the summer and in the winter in order to achieve the greatest temperature variation. Pulp temperature ranged from 20°C (68°F) in the summer to 3.3°C (38°F) in the winter. The resulting corrected efficiency curves for these conditions are shown in Figure 1.
Laboratory Studies
Laboratory experiments were carried out using a Krebs hydrocyclone. The cyclone parameters were as follows:

The cyclone was mounted on a laboratory test rig in closed circuit with a Warman centrifugal pump and a slurry tank. The cyclone overflow and underflow streams discharged freely into separate launders, which were used to either remove simultaneous samples from two streams or to recombine the streams before returning them to the slurry tank. The slurry temperature sensor was mounted in the feed sump and a diaphragm-type pressure gauge and an ultrasonic doppler flowmeter were both mounted on the cyclone inlet line. Apparent slurry viscosity was also measured in the circuit using a vibrating sphere viscometer. Flowrate, viscosity, and temperature data were collected and logged by a HP-85 computer.
The mineral used for these experiments was pure silica obtained from Ottawa Sand Co., Ottawa, Illinois. The particle size distribution is shown in Table 1. The temperature range is from 50°C to 12°C.
It has been shown that in both plant and laboratory environments, the temperature of the grinding circuit slurry has a noticeable effect on grinding and cyclone efficiency. The d size of a hydrocyclone is function of temperature, and the relationship between them is linear. The sharpness of the separation is largely unaffected by temperature changes, as illustrated by the constant nature of the reduced efficiency curve.
 |
 |
