It is a fair assumption that the main purpose of any diagram is to present facts to the eye in more convenient form than they could be tabulated in figures, and this implies that a screen diagram should set forth in a convenient and familiar form certain facts as to the character of the material screened regardless of the screen standards used, and it seems particularly desirable on account of the well-known differences in the size of openings of different laboratory screens having the same nominal mesh.

In making screen-sizing tests it has been customary to first consider the largest size, going progressively to the smallest, and this seems to have led to the practice of placing the smallest size at the right-hand side of the diagram and measuring toward the left. This is not altogether convenient and might be changed to advantage, but for illustration I have preserved that feature and present the method just as I have used it for over 2 years. Direct plotting in which the intervals on the diagram are proportional to the sizes of the openings, or to the arithmetical difference between them, seems at first sight more natural and is extremely useful for certain purposes, but it makes the diagram very crowded in the smaller screen sizes while the larger ones occupy unnecessary space, making it less convenient for most purposes, and for that reason the method here discussed is the well-known one based on the ratio between openings, and is plotted in logarithms instead of the direct values of the screen opening. Metric coordinate paper is convenient, although not necessary it is recommended, as the use of the metric scale gives a diagram of convenient size, but any scale of equal parts may be used.
In order to make any screen diagram translatable in terms of any standard screen size, it is necessary to have noted on the size scale of the diagram all points corresponding to the openings of the various screens in question, instead of a single series of points as with a single screen. In drawing the diagram assume 0.001 in. (corresponding approximately to 0.025 mm.) to be the smallest size to be considered and fix this as the zero point at the lower right-hand corner of the diagram. This value is selected because the values are to be plotted in logarithms, and the logarithm of 1 is zero. Then lay off to the left for the position of each screen opening, a distance on the scale equal to the logarithm of the opening. If the screen openings are given in millimeters instead of inches, a corresponding change must be made in the horizontal scale of the diagram. The zero point of the diagram corresponds to 0.025 mm. and since the mantissa of the logarithm of 0.025 is approximately 4, the logarithmic values for the millimeter scale can be made directly comparable with the inch scale by subtracting 4 from the first figure of the mantissa of the millimeter logarithm. After the subtraction of 4 the screen openings can be located on the scale as before and their position will coincide with that of openings of the same size given in inches. This being the case, it is immaterial, what unit of measurement is used in designating the screen openings, since it is very easy to transfer directly from one scale to the other. This transfer is of course not absolutely accurate but it is sufficiently accurate for the purposes of the comparison.
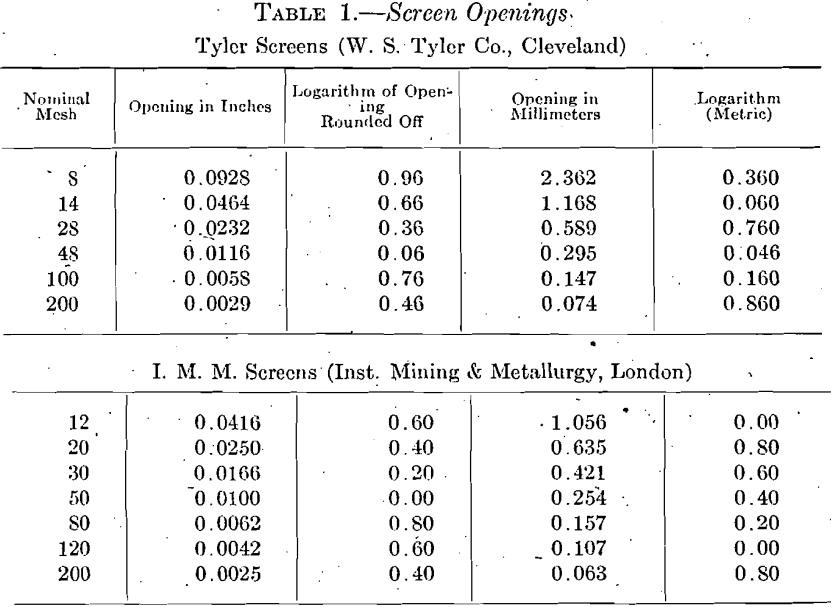
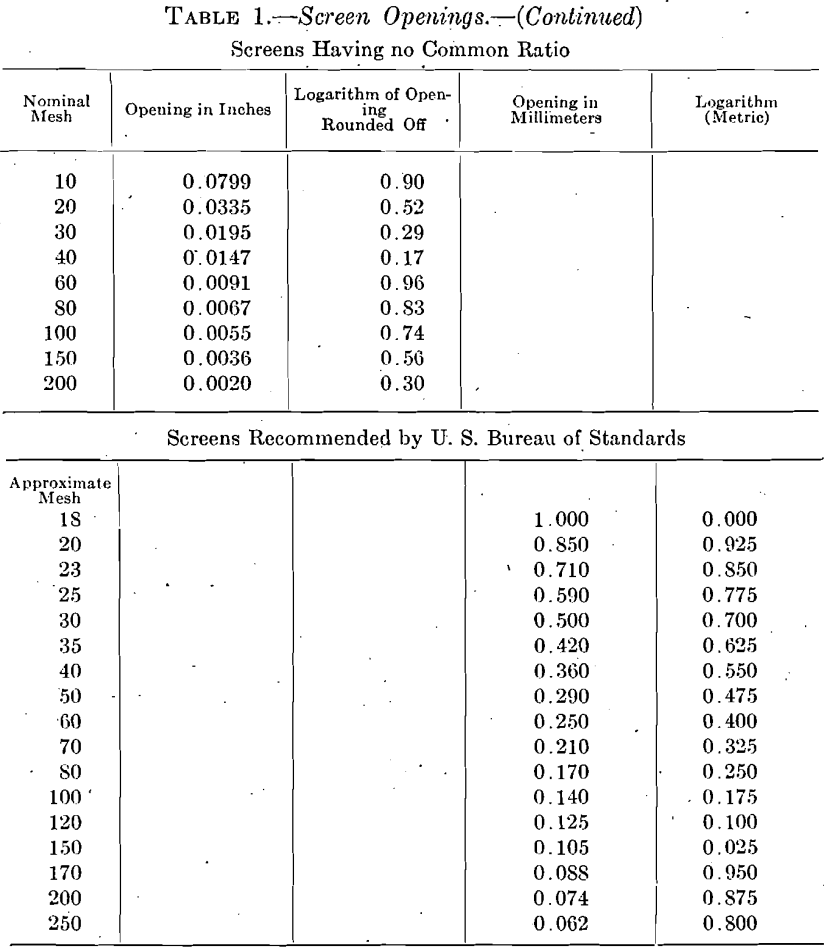
In Table 1 is given the screen openings and logarithm values for four different sets of laboratory screens, the logarithms being rounded off to not more than two decimal places for convenience in plotting, and the characteristics being omitted. The rounding off of the logarithms makes the ratio exact in the case of the screens having a common ratio of increase of the size of the opening, a condition not otherwise capable of exact expression decimally, and introduces no appreciable error. The different screens here tabulated in part are: (1) The Tyler screens, based on the opening of a 200-mesh screen standardized by the U. S. Bureau of Standards, only each alternate size being here listed, the lineal dimensions of the openings having an ascending geometric ratio of 2; ratio with all the sizes in would be √2; (2) the I. M. M. screens, having the sanction of the Institution of Mining and Metallurgy, London, and almost universally used throughout the British Empire. The screens here shown approximate for practical purposes a ratio of 1.5874, or 3√4 for the ratio of increase. Stadler (Royal School of Mines, So. Kensington, London) has proposed that these screens be manufactured in the following sizes in order to make the ratio more nearly exact, but as now made the approximation to a common ratio is close:
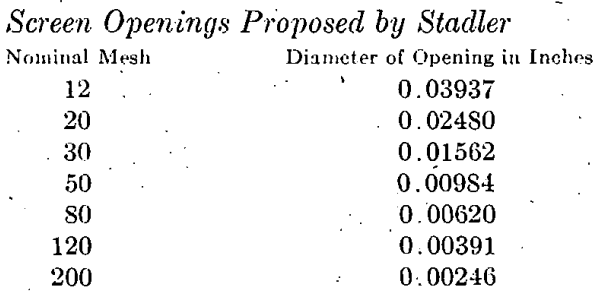
When the I. M. M. screen standard was first adopted, there seems to have been no attempt to secure a common ratio between openings, as the set originally contained a number of odd intermediate sizes, but the importance of a common ratio is now well recognized in England and is secured with substantial accuracy by using only a part of the original set.
3. The third set of screens here listed is by a well-known American maker. They have no common ratio between openings, but are considerably used in this country.
4. The fourth set is one lately recommended by the U. S. Bureau of Standards after much study and conference with makers and users of screens. The 0.062-mm. screen is almost identical with the I. M. M. 200-mesh screen and for practical purposes these screens coincide with other screens at a number of points.
To locate on the diagram (Fig. 1) the screens enumerated, we will refer to the logarithms in Table 1. The Tyler 200-mesh, since log. 29 =
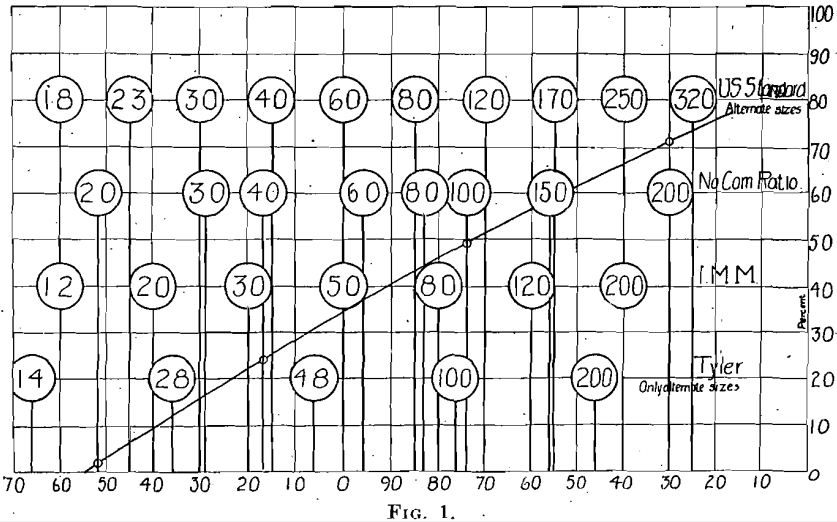
46, will be 46 scale units from the right index, and each succeeding screen will be 30 units farther to the left. In like manner, the 200-mesh I. M. M. screen will be at 40 and the 200-mesh screen of the set having no common ratio will be at 30 from the right. Dropping 4 from the first figure of the mantissa, we find that the logarithm, of the dimensions given in millimeters exactly check with the points already located, and we may proceed to locate the points for the fourth set. It will be noticed that the errors introduced to make the logarithms in exact arithmetical progression are slight. For instance, in the logarithm column for the new U. S. standard there is an error amounting to 0.412 scale unit, at the last screen, which theoretically has an opening of 0.0625 mm., and this error is thrown to the other side of the diagram by using the even figure 40 for placing the plotting scale instead of the more nearly correct 40.4834, the logarithm of the exact millimeter equivalent of 0.001 in. This, however, is considerably within the limit of tolerance allowed. It will be noticed that the indices of the logarithms change at each 100 mm. of the scale along the A-axis and that same distance along the B-axis of the diagram seems a most convenient range for the percentages, 0 to 100, of the material screened. This proportion between the dimensions along the two axes of the diagram is now much used and leaves nothing to be desired.
It is hardly necessary to add that the most common method of plotting is to locate the curve at the points along the B-axis at which all the material remains on a given screen, thus making the diagram cumulative. The curve drawn for illustration is from a stamp-battery product and only four screens were used.
It is probably too much to hope that everybody will eventually use the same, screen standard, but the adoption of a plan giving the same curve for similar materials regardless of screen standards would be a welcome improvement. It is hoped that these suggestions will at least be helpful to those who might desire to change to a better screen standard and at the same time have a convenient means of comparing former work.
