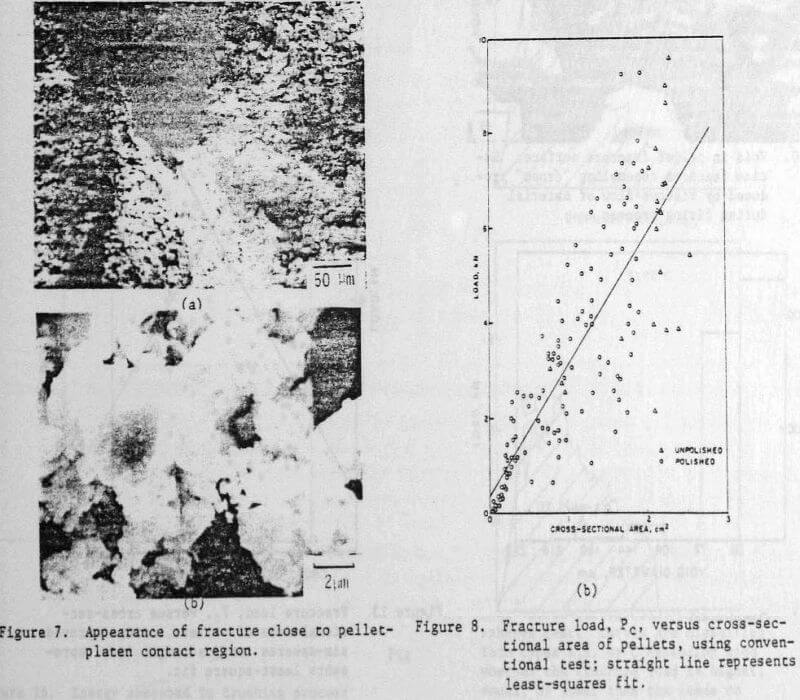
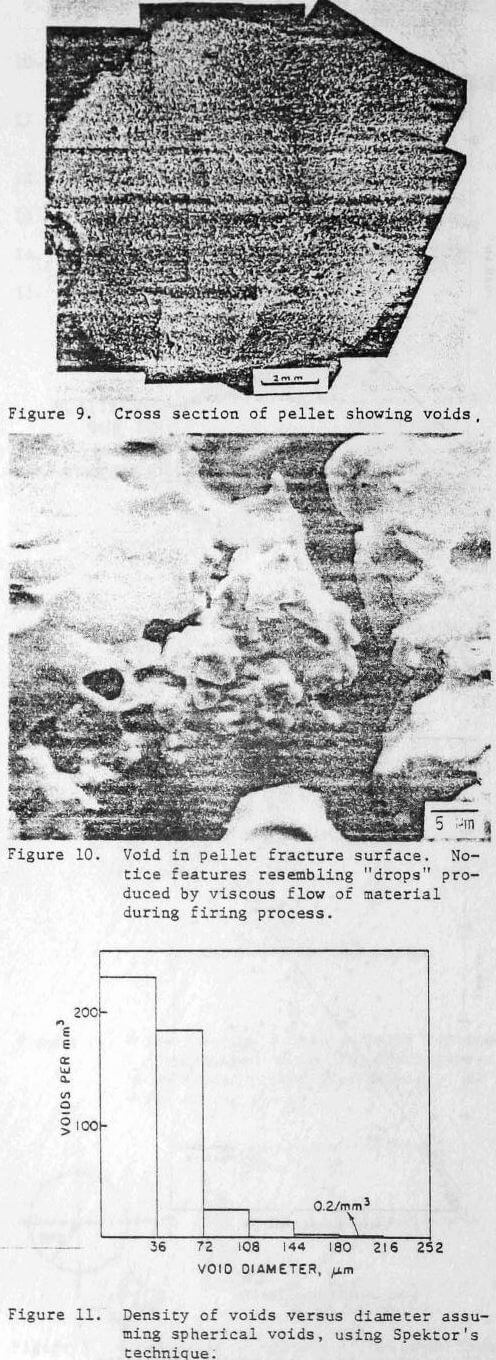
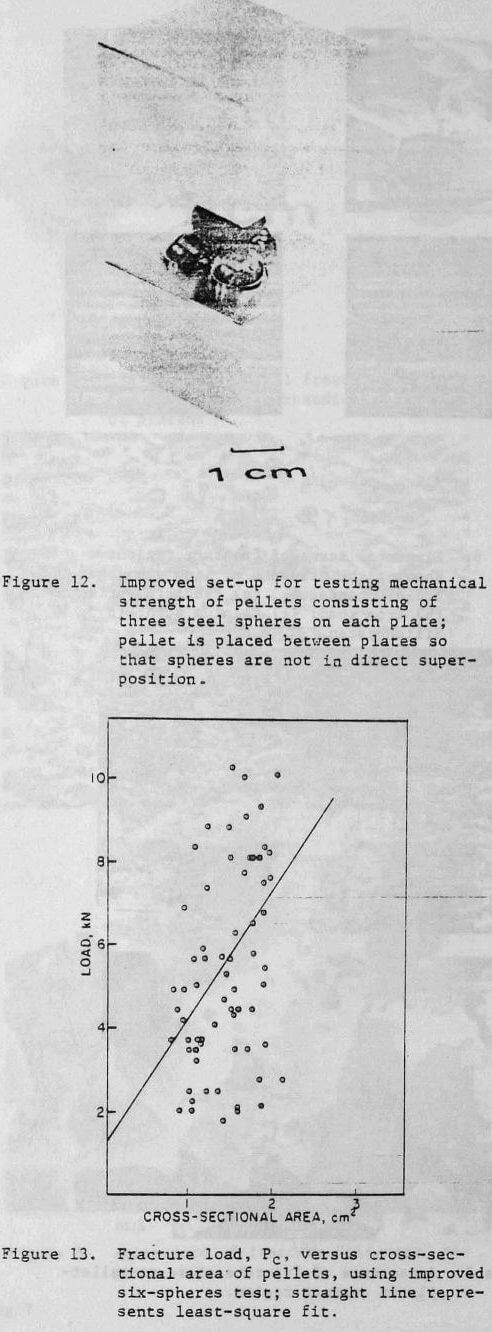
Six-Spheres test: The conventional test consisting of compressing the pellet between parallel flat platens does not simulate very well the environment actually encountered by the pellet. Each pellet is surrounded by similar pellets, that exert a pressure on it whose magnitude is dependent on the height of the pile, among other parameters. The most compact ways in which spheres pack themselves close-packed hexagonal and face-centered cubic; the closest-packed planes are stacked in sequences AB AB and ABC ABC, respectively. The latter stacking sequence was chosen to represent the packing of pellets. Two testing platens were machined, three steel spheres were inserted in each. The pellets were placed between the two platens, shown in Figure 12. The spheres on the top platen were not placed vertically above the ones in the bottom layer in order to better simulate the ABC stacking sequence , in which the pellet corresponds to B. The results of tests conducted on approximately seventy pellets are shown in Figure 13; the load of fracture is plotted against the cross-sectional area. Both the slope of the least-squares line and its intercept with the load axis are higher than those of the conventional flat-platen test (Figure 8). Nevertheless, there seems to be no improvement in the scatter of the fracture load over the latter test. Hence, the increase in the number of contact points from two to six, with a more uniform concentration of stress did not improve the results. This showed that the variation in pellet strength was not connected to irregularities in the contact regions, confirming thus the mathematical analysis and observations of Section 2. One conclusion can be drawn from the six-spheres test: that the strength of the pellet is somewhat higher (-30 pct) in the actual environment than between flat platens.
Most of the tests using the six-spheres system were continued beyond the first crack propagated through the pellet. Actually, the first crack did not propagate through its center; failure had a more progressive, continuous response, and the pellet retained a considerable load-bearing ability after the first crack propagated. The cracks produced something that can be described as “scaling” or “peeling off” of successive layers of the pellet. For this reason, the tests were continued unitl complete desintegration of the pellet.
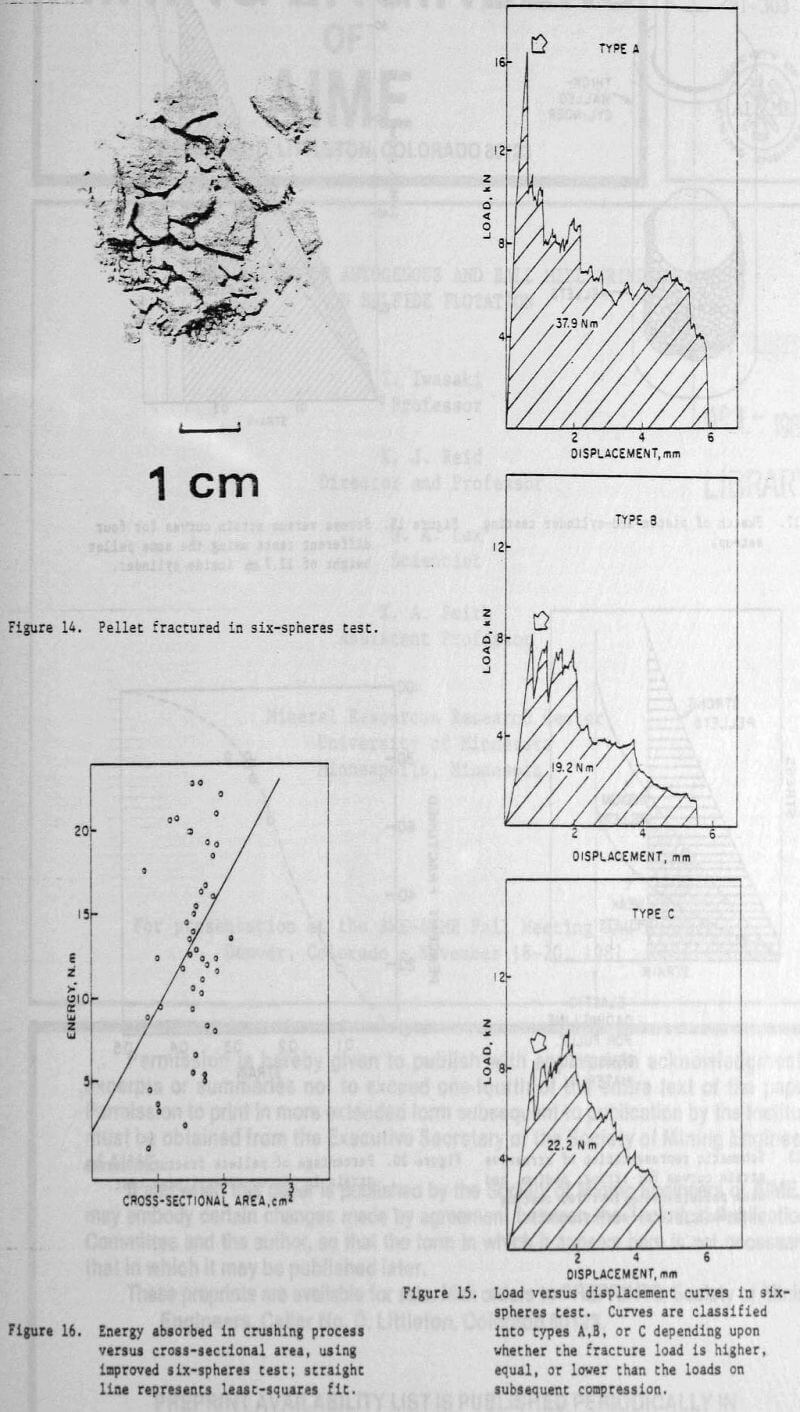
Figure 14 shows a typical fractured pellet. The load versus extension curves are shown in Figure 15. Since the fracture load — first peak in load vs. extension curve — varied so much, it was thought that the energy absorbed in the crushing process might be a better measure of the strength of the pellet. This energy is given by the area under the load vs. extension curves in Figure 15; it can be readily seen that the units are N.m. Three plots are given in Figure 15; they show the different responses exhibited by pellets. For type A pellets, the fracture load is higher than the remainder of the curve. For type B pellets, the pellet recovers its strength after the first drop, and the load reaches a level roughly equal to the initial fracture load. Type C pellets, on the other hand, exhibit a higher strength after some deformation than at the first fracture. These three types of response show that the fracture load is not representative of the load-bearing ability of the pellets.
Figure 16 shows the energy absorbed in the crushing process as a function of pellet cross-sectional area. No improvement is obtained over the plots of Figure 8 and 13. The scatter in the data is still very substantial.
In spite of the fact that the six-spheres test exhibits the same limitations than the flat-platen test, it is fundamentally more significant, since it simulates better the loading environment actually encountered by the pellets.
Cylinder & Piston Test
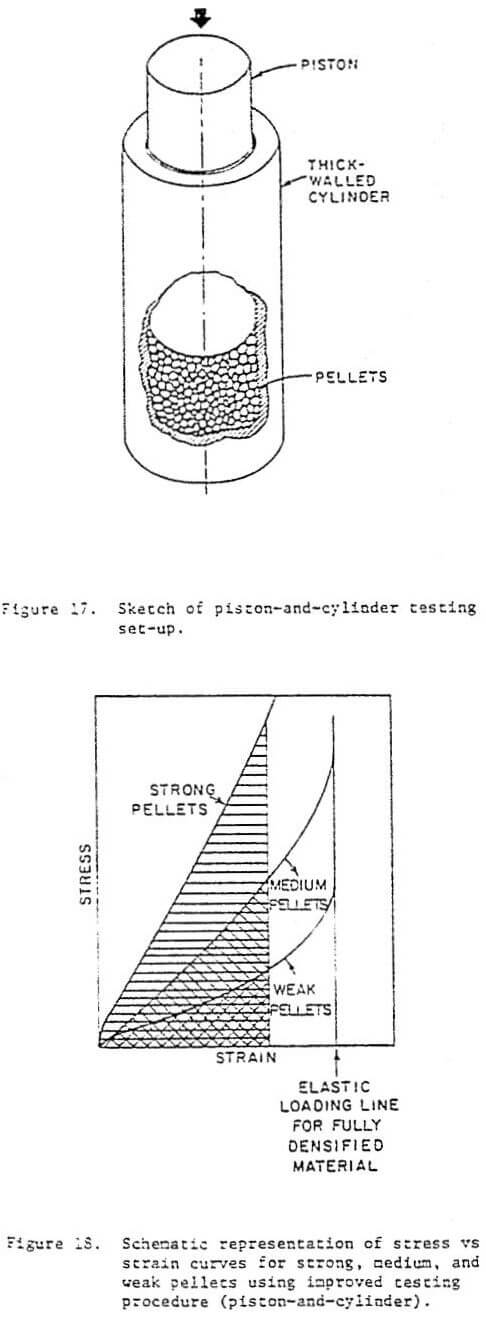
The realization that the individual variation in pellet strength was unavoidable and due to (a) existing internal flaws and (b) size differences led to the development of a different testing procedure consisting of-a thick-walled cylinder and a loosely fitting piston. The system is schematically shown in Figure 17. Pellets are loaded into the cylinder up to a standard height. The system used in the present investigation had a height of 30.5 cm an internal diameter of 6.35 cm, and the pellets were loaded up to a height of 12.7 cm. The system was compressed in a Baldwin compression testing machine at a velocity of 2 cm/min. The extension was monitored by means of a transducer (L.V.D. T.) attached to the top portion of the piston. The load and extension were fed into an X-Y recorder. The total duration of a test was of approximately fifteen minutes.
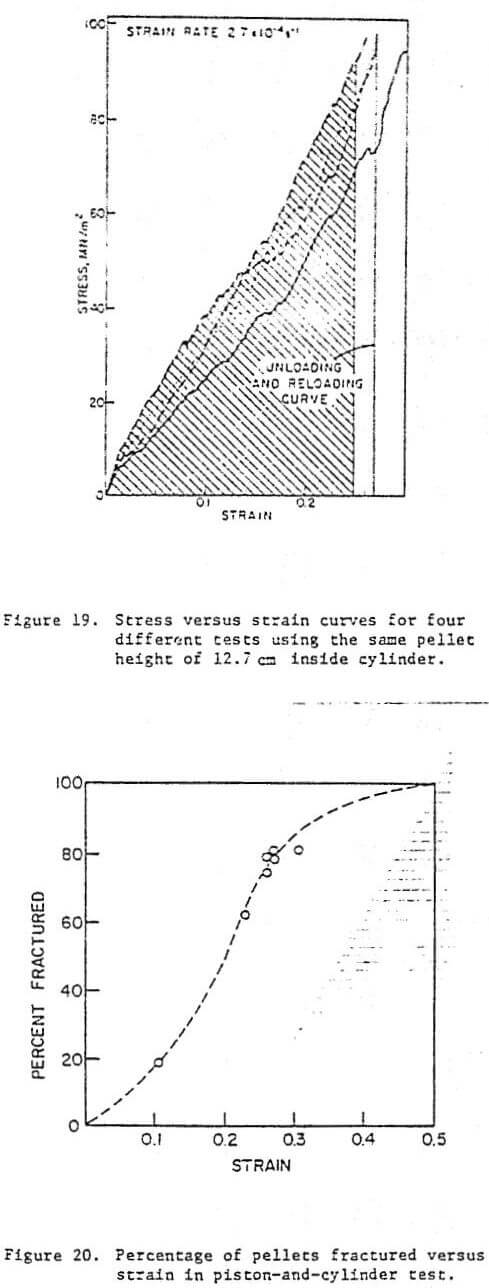
The main goal in developing this test was of obtaining a parameter that satisfactorily described the compressive strength of a batch of pellet in a simple and readily reproduceable test. Figure 18 shows the types of stress versus strain plots to be expected of batches of pellets with different strength. The stress is calculated by dividing the load by the cross-sectional area of the piston; the strain is obtained dividing the extension dL by the initial length of the pellet load. As the piston descends, the pellets are crushed; a progressively higher load is required. Since a large number of pellets is involved, it was thought, sensibly, that the individual fracture events would average out, resulting in a smooch curve. The stress versus strain curve should asymptotically approach the elastic loading line for totally crushed pellets. The total strain can be calculated; one assumes that the totally crushed pellets have the theoretical specific weight of the pellet (3.83 gf/cm³) as a first approximation. The apparent specific weight of the pellets (weight of a certain quantity divided by its volume) was found to be 2.95 gf/cm². Dividing this value by the theoretical specific weight, one finds that it is 0.5. Hence, complete crushing should be achieved at a strain of 0.5. At a strain of 0.5 the curves should approach the line for the elastic modulus of hematite. Since this value of strain is only obtained at very high values of stress, for stronger pellets, a certain amount of strain was arbitrarely chosen. The area under the different curves expresses the energy required to crush the pellets to the arbitrarely chosen strain and is a satisfactory measure of the compressive strength of pellets.
The application of the above concepts to actual pellets is shown in Figure 19. Four individual tests are shown in the figure, and they are in fair agreement. The energies absorbed up to a strain of 0.25 were measured from the area under the curve: the mean is 3128 N.m and the standard deviation is 651 N.m. The variation in this parameter from test to test is far lower than that of the individual pellets (either fracture load or energy absorbed). Hence, it is thought that such a test, upon appropriate standardization after optimization of the parameters, would provide a simpler and superior description of the pellet compressive strength. Figure 20 shows the percentage of pellets fractured as a function of strain. One can see that the curve is S shaped and that the strain of 0.5 was set as 100 pct fractured. Actually, a distinction should be traced between fractured and crushed: 100 pct fractured should correspond to a strain slightly lower than 100 pct crushed. Nevertheless, the results of Fig. 20 show that the stress level used in the test is sufficient to produce fracture of a considerable percentage of the pellets; the five tests grouped around 80 pct fractured correspond to the plots of Fig. 19.
