Who would think that Selective Flotation of copper, gold, zinc or any metal would required that one must be able to feel pain and recognized and/or admit when it hurts. Flotation mass-pull is a process that is often misunderstood; a learner’s mistake made by non-operating types. You do not need to pump anything in the lab.
In selective flotation, less is more! Over 2 years ago I wrote about the intricacy and importance of mass pull in a plant VS laboratory. I need to restate I suppose that flotation is a process of concentration in which we must put has much metal as possible into as little mass as possible.
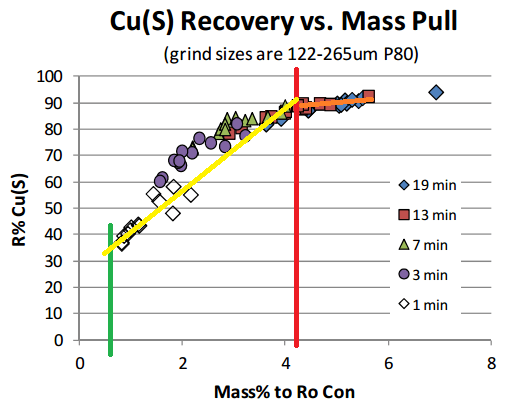
On the below Chart, selective flotation (separation) is obtained from the green line (1% mass) to the red line (4.5% mass). After >4.5% mass, you get mass pull, just mass. No selectivity, no concentration. You could float all day and yes get more mass. You could float off the whole tailings if you have enough time.
You see on the yellow line is sloped at almost 45 degrees? You see how the orange line is about flat?
- In the yellow zone, more mass = more recovery
- In the orange zone, more mass = more mass (not recovery)
In the above case, it appears that anything over 13 minutes is a waste of time, literally. The 4.5% mass is sometime obtained in 7 minutes.
I would settle for 13 minutes and surely not 19 minutes flotation time (rougher).
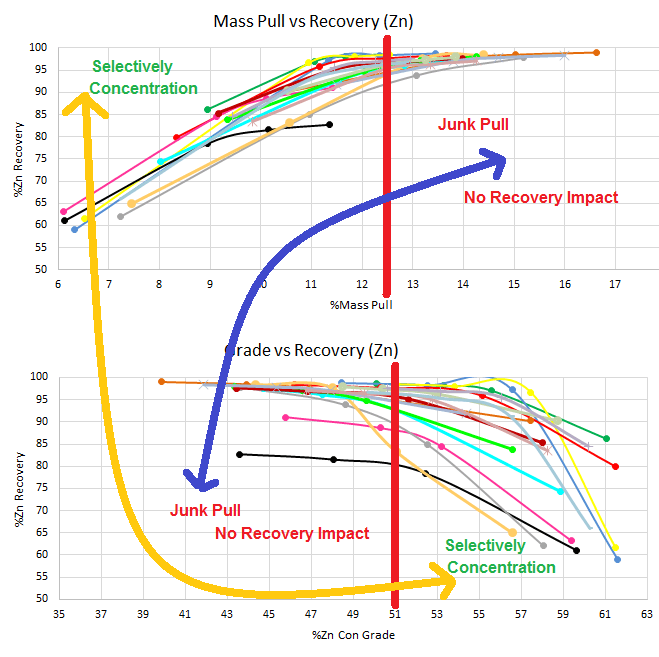
This above is another example where floating longer than 12 minutes on pointless. Sulphides float fast, binaries, waste and oxides float slow.
If you calculated the concentration ratios at every minute of the flotation stage, you would realize the fundamental error is floating too hard for too long. You would see when Pulling more Hurts and When More Mass is Too Much Mass.
Here an Anova could confirm this graphic observation:
In the Zone of fast kinetics, from start to red (bottom graph) and from start (or green) to red (top graph), the Anova tell you a clear and significant relationship of influence better mass and recovery
[did you really need statistical analysis].
In the Zone of slow kinetics, from red the end 17% mass (bottom graph) and from red (top graph) to the end 7% at 19 minutes, the Anova tell you NOT significant relationship exist [again, did you really need statistical analysis].
In some cases, when you Anova the full range, Anova will see NOT significant relationship exist.
In most to all cases with extended to excessive flotation time, when you Anova the full range, Anova will see NOT significant relationship exist.
Now that we’re all educated on sulphide flotation selectivity and its impact on mass-pull; review the 2 rougher flotation test results below and tell me if More Mass is Better?
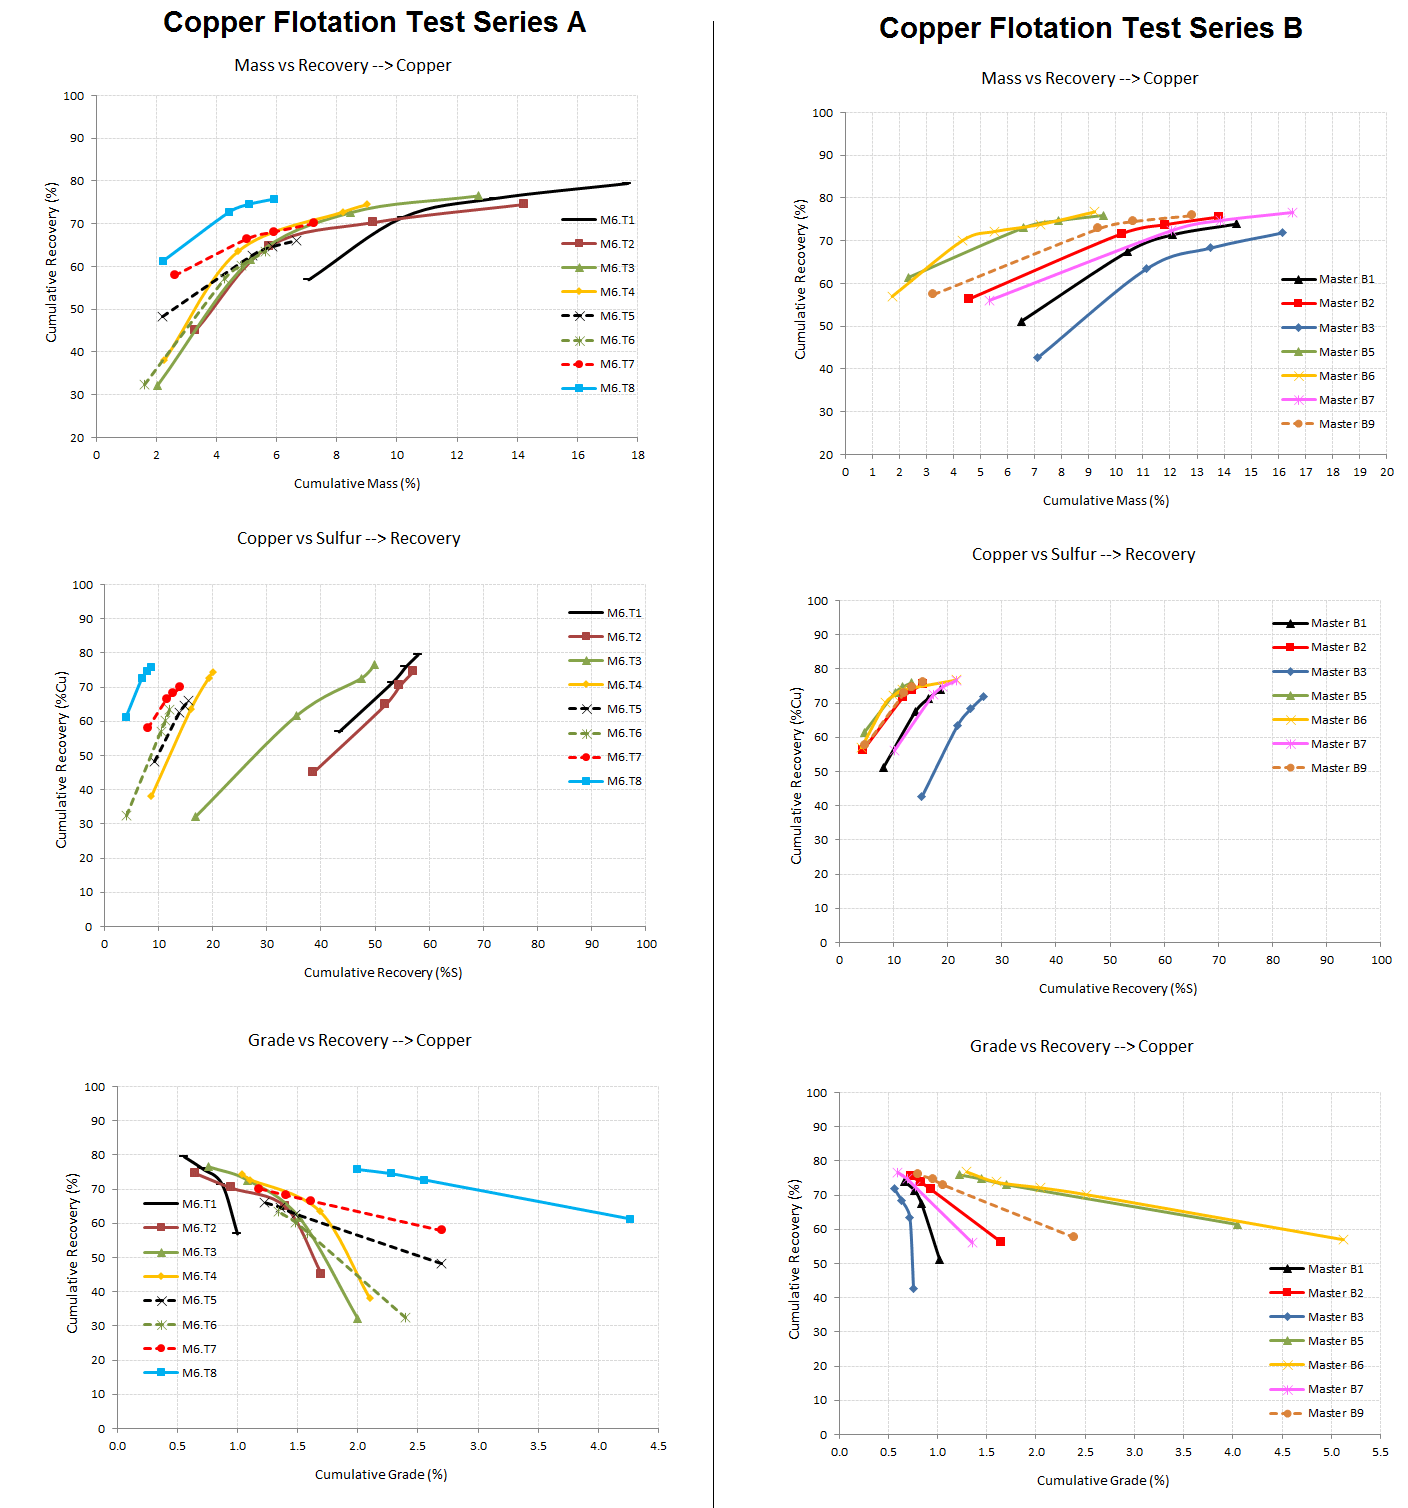
3 plots are provided to help in your analysis:
Mass VS Copper Recovery | Copper Recovery VS Total Sulfur Recovery | Copper Grade VS Copper Recovery
PS: in case you need help evaluating a grade/recovery curve…
Flotation assays do provide much information which can and need be analized in details. For example a piece of data often overlooked is a the creation of a ‘selectivity curve’. If you please look at the 2nd row of graphs down below you see Cu %Recovery plotted VS Sulfur %Recovery.
Since we are in a sulfide system containing pyrite, sphalerite, chalcopyrite, bornite, and chalcocite; this graph presents how well the test conditions were at recovering ‘selectively’ Copper species without too much of the other sulfides.
You see that all tests have a terminal recovery that is statistically the same while the concentrate grade (and mass pull) is what varies the most.
Optimization of grade and recovery is the final objective. No need to recover lots of something if it is off-specs and can not be sold.
Flotation Selectivity Charts Compares
Flotation Mass Pull VS Grade Recovery Test Results
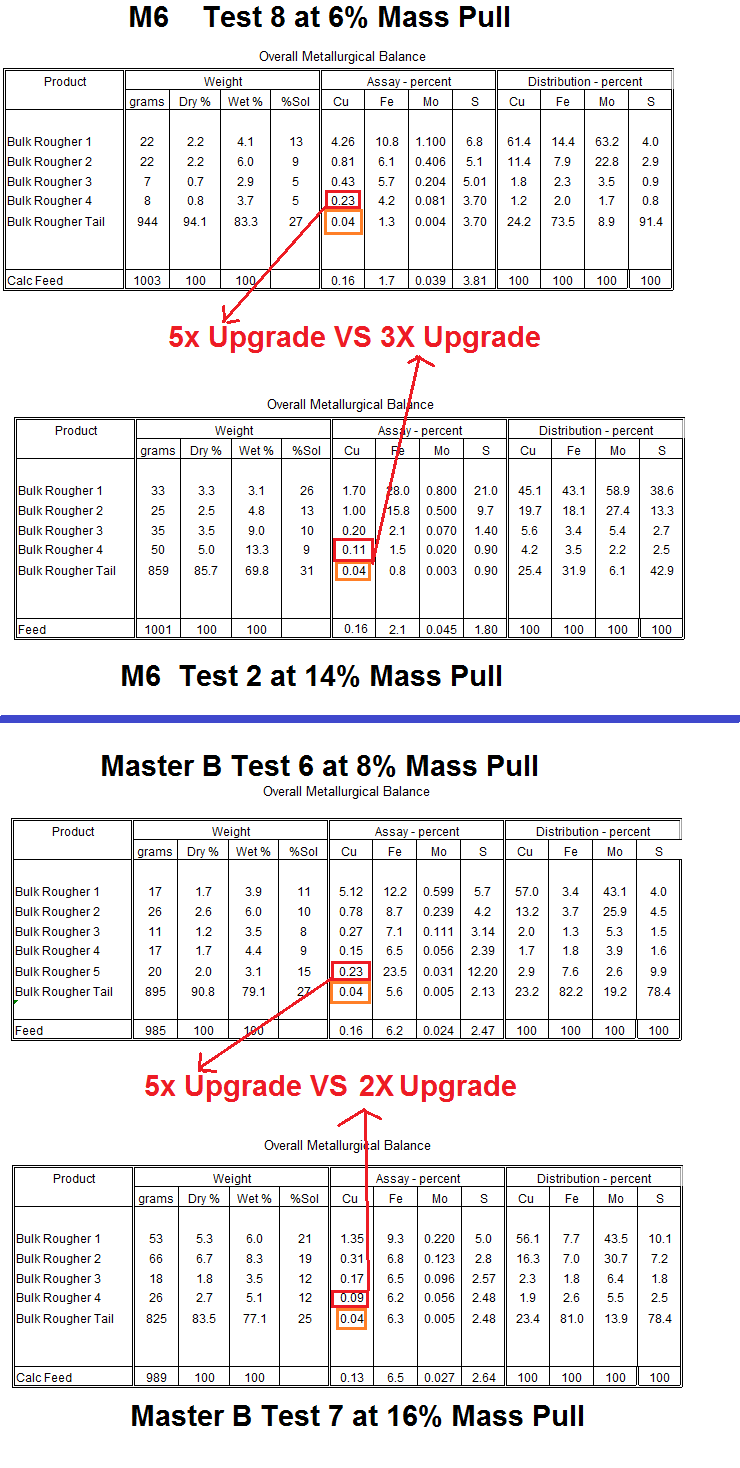
By reviewing a material balance table below where low mass Test 8 is compared to higher mass Test 2. You see that near the end of the test, the 4th rougher conc grade presented little upgrade in the high mass test VS the low mass more selective test. See Test 2 has a conc of 0.11% not far from the tailings assay of 0.04% copper.
Master B is even worse…
Why not save time and effort and just grab a table spoon of tailings and put it into the concentrate? No! Stay selective!
CONCLUSION: Do not get blinded by the little bit of recovery you get by pulling and pulling. Anyone who considers himself a genius for obtaining high metal recovery by literally pouring (floating) some flotation tailings into the flotation concentrate might as well take the whole ore and ship it to the smelter claiming up to 100% recovery.
Regroup and analyze your data and aim for selective in your flotation process!
Watch this video to see what mass pull does in a real life plant.
