Table of Contents
Conventional analyses of seepage through saturated media do not apply when tailings impoundments are located above a partially saturated zone. Three stages of seepage are identified and methods for estimating the seepage rates and duration of each stage, based upon flow in partially saturated and saturated porous media, are demonstrated. The effectiveness of earthen liners is discussed and procedures for estimating the required properties of the porous media, are provided.
Summary of Methods of Analysis
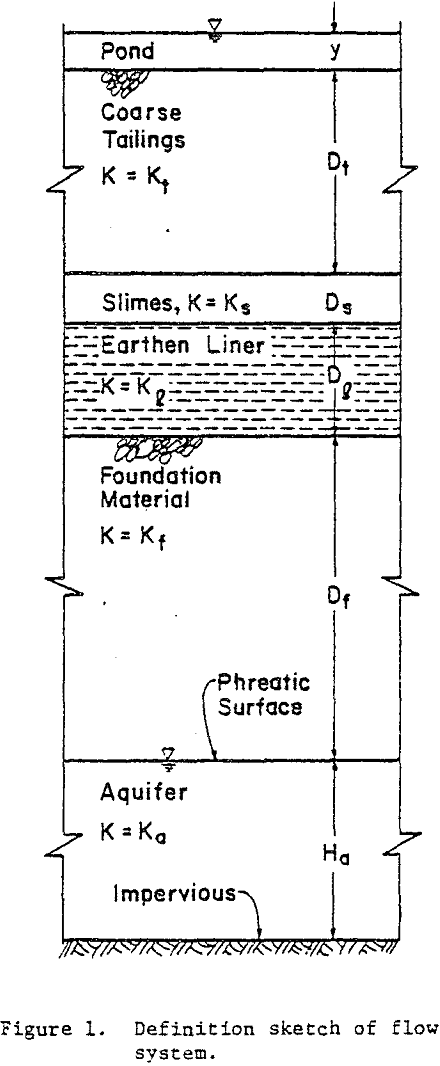
The idealized profile of the tailings and foundation material and the phreatic surfaces in the impoundment and underlying aquifer are studied. Seepage from beneath the impoundment is conveniently viewed as taking place in three distinct stages designated as Stages I, II, and III. These stages are considered separately and are defined as follows.
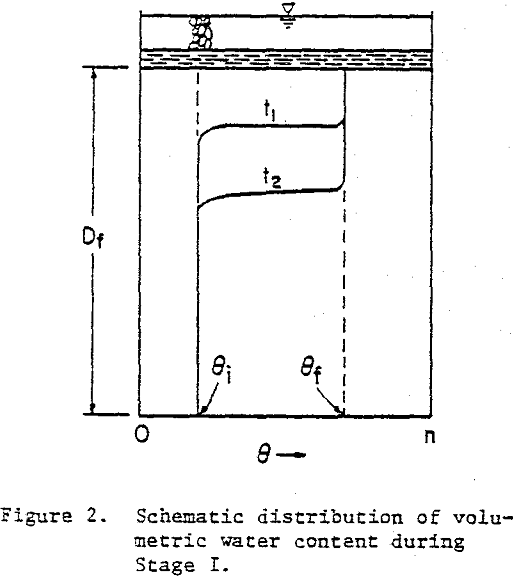
Stage I. – During this stage a wetting front advances downward through the partially saturated underlying foundation material. Above the wetting front, the material may or may not be saturated.
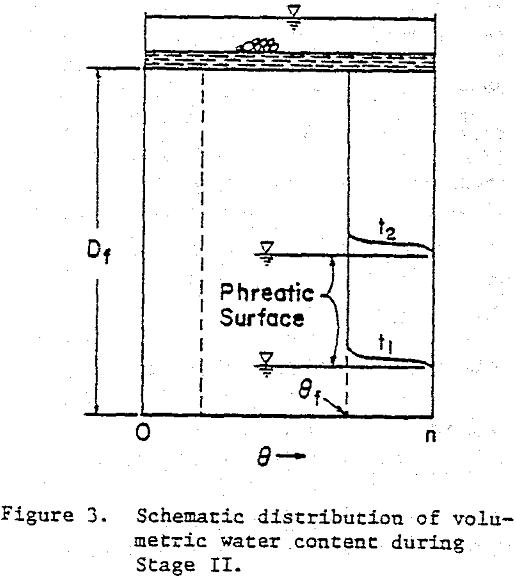
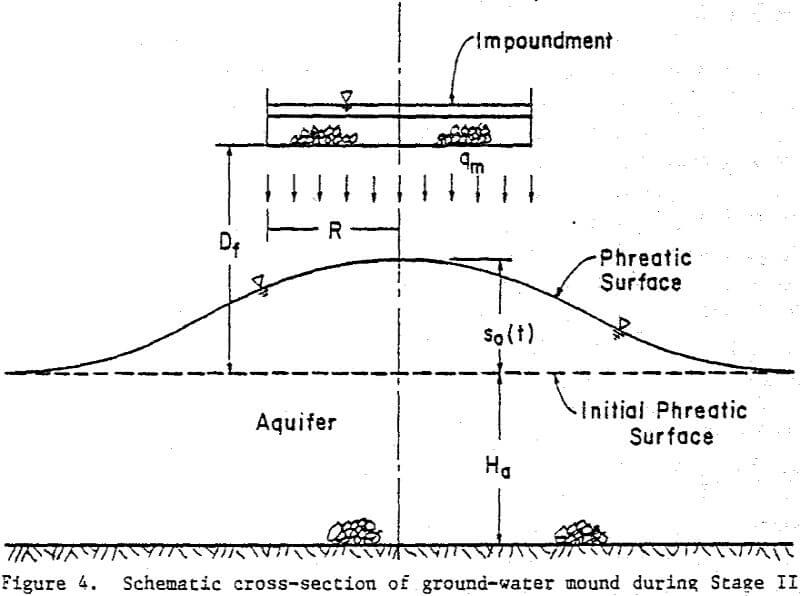
Stage II. – When the wetting front contacts either an impervious stratum or the phreatic surface of an aquifer, a ground-water mound will develop and rise toward the impoundment. Stage II, represents the time interval during which the mound is developing.
Stage III. – After the ground-water mound establishes contact with the impoundment, saturated seepage occurs through a mound whose height is defined by the elevation of the impoundment.
Seepage during Stages I and II is largely controlled by vertical gradients and the hydraulic conductivity of the liner and tailings; the seepage rates being relatively insensitive to the position of the phreatic surface in the underlying aquifer and the resistance to lateral spreading of the ground-water mound. Once the phreatic surface in the aquifer has risen to the elevation of the impoundment (i.e., the beginning of Stage III) the resistance to lateral flow in the aquifer has a very significant effect upon subsequent seepage rates, however. The resistance to lateral spreading in the aquifer during Stage III causes the pore-water pressure to increase on the interface between the impoundment and the foundation material, reducing the vertical gradients in the tailings and liner and, therefore, the seepage rates. Thus, the maximum seepage rate during Stage III occurs at the beginning of the stage and is equal to the terminal rate in Stage II. Eventually, the seepage rates are controlled almost entirely by the resistance to flow in the aquifer and are practically independent of the hydraulic properties of the liner and tailings.
Data Requirements and Estimation Procedures
Use of the equations and procedures summarized above requires that the values of several parameters be measured or estimated in some way. Values for the saturated hydraulic conductivity of coarse tailings, slimes, liner, foundation material, and the underlying aquifer are required. In addition, the porosity, initial water content, residual water content, displacement-pressure head, and pore-size distribution index must be measured or estimated for the foundation material. Finally, the thickness of the saturated zone in the aquifer, of the partially saturated zone in the foundation materially of the liner, of the slimes, and of the coarse tailings must be estimated.
It is not possible to provide a detailed discussion of now all of these data can be obtained, and the following paragraphs represent only an overview with several pertinent references cited that provide additional depth and details.
An approximate method for the determination of the saturated hydraulic conductivities of coarse tailings, slimes, and mixtures of the two is the standard constant or falling head permeameter. These materials constitute disturbed media, and relatively good estimates of their saturated hydraulic conductivity in the impoundment can be obtained by measuring this parameter in the laboratory. Care must be taken to insure the test samples are representative, particularly with respect to bulk densities and grain-size distributions. In many cases, particularly when the materials can be classified as sands, reasonable estimates can be obtained from grain-size distribution data only.
Properties of the foundation material, other than saturated hydraulic conductivity, that, are required are porosity, initial water content, residual water content, pore-size distribution index, and displacement-pressure head. The porosity can be determined by a number of techniques most of which are direct measurements upon samples of the material. Nearly any book dealing with soil mechanics or ground-water hydrology contains discussions of the various techniques.
Example Calculations
The purpose of the following computations is to demonstrate the use of the foregoing equations in the estimation of seepage for some simple hypothetical situations. Application to actual cases will be more complex, but if the basic procedure is understood, reasonable estimates can be made for such cases.
Cases I and II represent situations where the impoundment is located at or near the ground surface. Case II differs from Case I only in that no liner is provided in Case II. In both cases, the foundation material is a poorly cemented sandstone with a porosity of 0.4.
The first step in the computation is to determine whether the foundation material will be saturated or unsaturated above the wetting front in Stage I for this purpose, we arbitrarily take Dt = 11 m and Ds = 1.5 m, and with other appropriate data, the left side of inequality 1 is evaluated and found to equal -97 m. Clearly this is much less than hd = -2.3 m, so the foundation material will be partially saturated above the wetting front. Note that any reasonable assumption for values of Dt and Ds would have yielded the same conclusion. Saturation behind the wetting front is likely to occur only if the saturated conductivity of the foundation material is of the same order as the least permeable of the overlying strata.
The second step of the computation is to compute seepage rates using the projected depths for slimes and tailings. It is convenient to do this in one-half year time increments. The seepage rate at t=0 is 3.3×10 -6 cm/s; at t=0.5 yr, q = 3.90×10 -6 cm/s; at t=1 yr, q = 4.50×10 -6 cm/s; and so on.
The third step is to make a first guess for the duration of Stage I, compute the mean seepage rate over this interval. We arbitrarily guess that the duration of Stage I is 4 years.
It should be noted that throughout Stages I and II, the resistance to flow through the liner, represented by the term Dl/Kl, was the single most important parameter influencing seepage rates. In fact, doubling the liner thickness would almost halve the seepage rates. If the conductivity of the liner were one-tenth of the value used in the computations, the seepage rates would be about one-tenth of the values calculated in this example and Stage I would have persisted throughout the 20 year life of the project.
Recall that Case II is identical to Case I except for the absence of the liner in Case II. Again, the first step is to determine if saturated or unsaturated conditions exist behind the wetting front. Without the liner, the left side of inequality 1 yields values greater than hd for times on the order of one year, indicating saturation above the wetting front. At larger times, the thickness of the slimes increases to the point where inequality 1 indicates unsaturated conditions. Because saturated flow will exist behind the wetting front at the beginning of Stage I, the equations appropriate for saturated conditions will be used.
At the beginning of Stage II the seepage rate is 1.1×10 -4 cm/s and remains almost constant as the phreatic surface rises to the impoundment elevation. The duration of Stage II is also very small and for practical purposes, Stage III begins very shortly after disposal is initiated. Seepage rates for Stage III are computed as shown in the Case I example.
