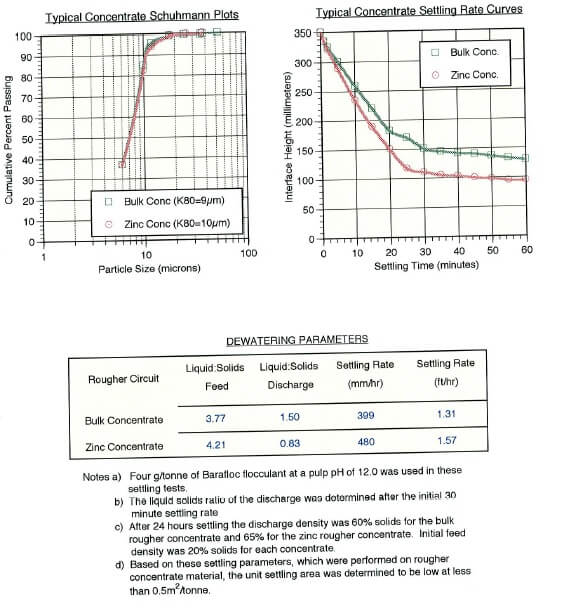
A Schuhmann Plot help smooth out particle size data. I attach a graph created for a settling test of flotation concentrates.

You draw/create a Schuhmann Plot using the details found in https://technology.infomine.com/enviromine/ard/mineralogy/Size%20&%20Liberation.htm
and https://www.chem.mtu.edu/chem_eng/faculty/kawatra/CM2200_2009_HW_3_sizedist.pdf
