Table of Contents
What is x-ray fluorescence and why is XRF sample preparation is important for correct XRF analysis.
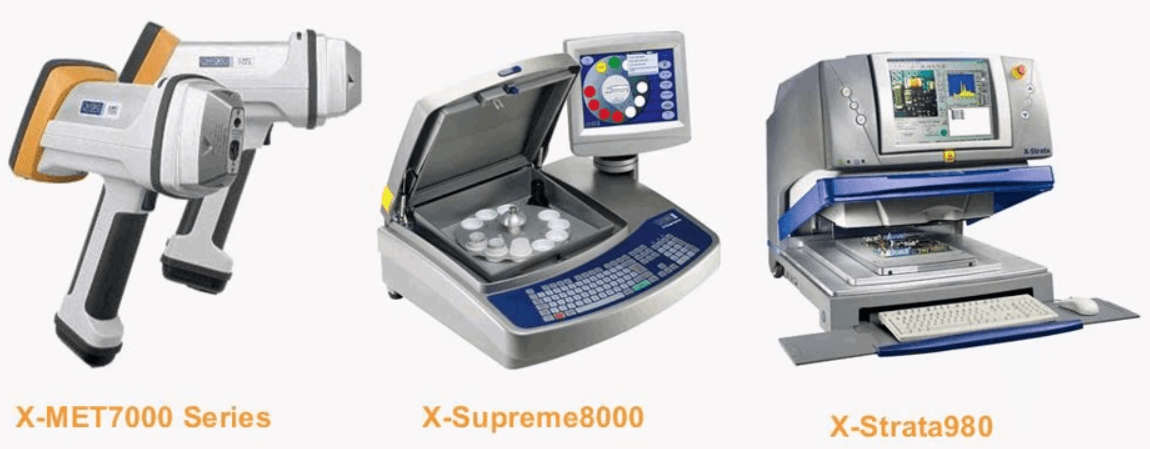
This is a little introduction to some of our instruments; from left to right we have the X-MET7000 series these hand held analyzers are great for their versatility and portability, the X-Supreme in the middle is used for bulk analysis of liquid, powder and solid sample and the X-Strata 980 on the right is used to measure thickness and composition it is commonly used in printed circuit boards or the plating industry.
XRF works on the atomic level x-rays are produced from the spectrometer and excite the analyzed volume within the specimen. The incoming x-ray ejects an electron, when this happens the atom becomes unstable and form an electron from an outer shell fills the vacancy.
How does XRF work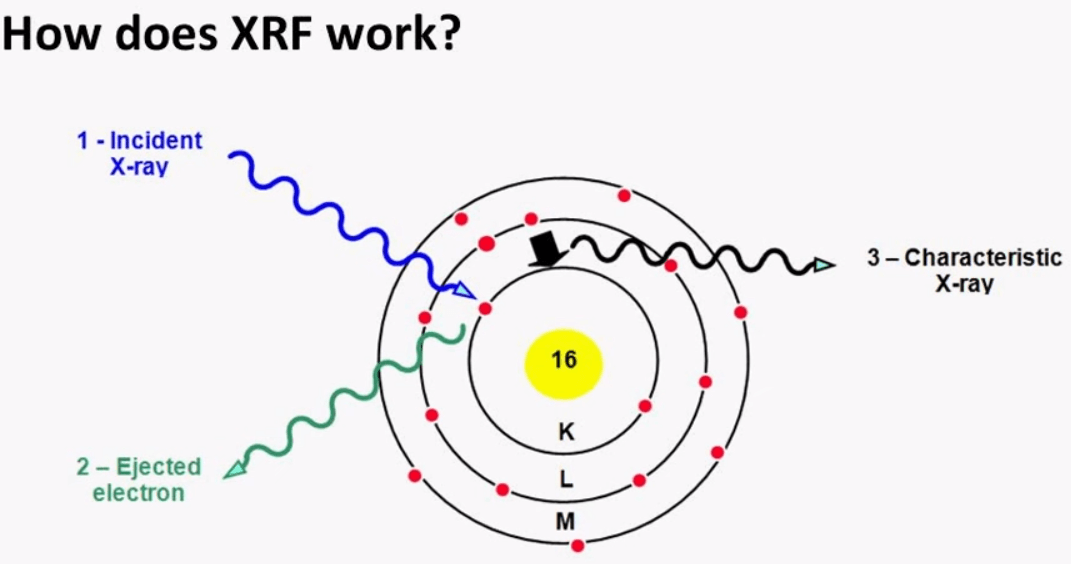
Once this happens it generates the characteristic x-ray equivalent to the energy difference between the inner and outer shell. Each element will have a characteristic x-ray of a specific energy and this is how one can determine what elements are present in the sample.
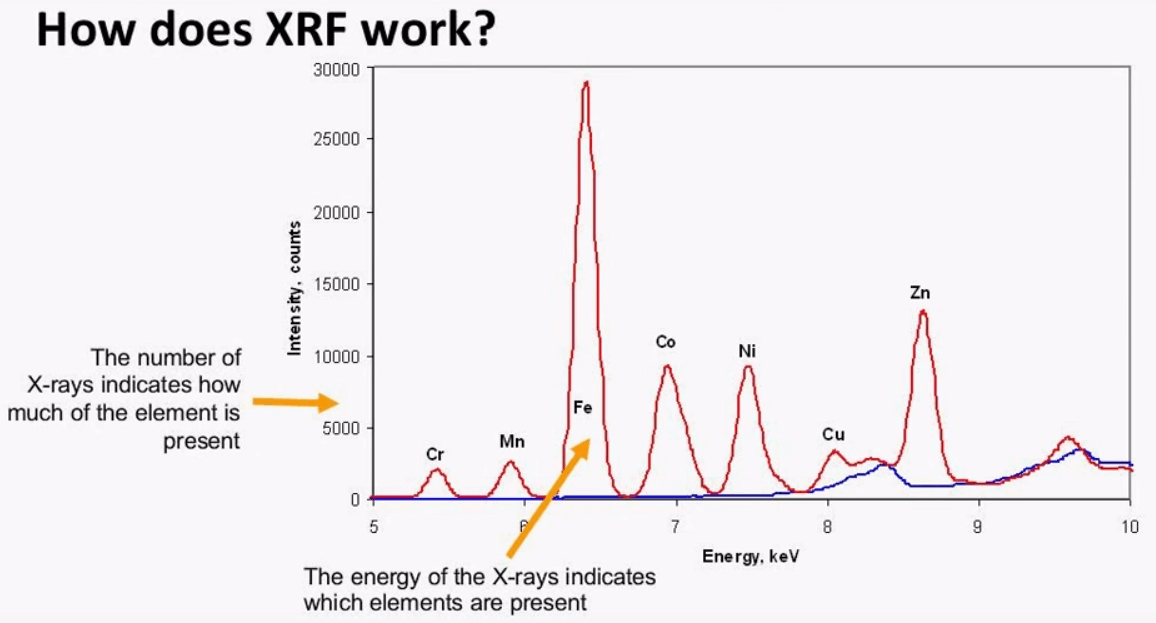 The detector selects these characteristic x-rays and displays them as a spectrum which is a visual representation of the composition of the sample by looking at the x axis one can see the energy range goes from 5keV to 10keV and as the energy increases the atomic weight of the element increases, this is because the electrons of the heavier elements are bound tighter, on the y axis there are counts which is the number of x-rays one can see that iron is present in a large quantity compared to the other elements because of the high number of counts, another important aspect of the spectra is the background level, this is the level of at the base. one can see that the background increases around 8keV, it is important to limit the effect of the background if you want accurate analysis, this can be done by using a primary filter this component will be covered briefly in the next slide or one can also expect for the changing background by using correction once the calibration model is created.
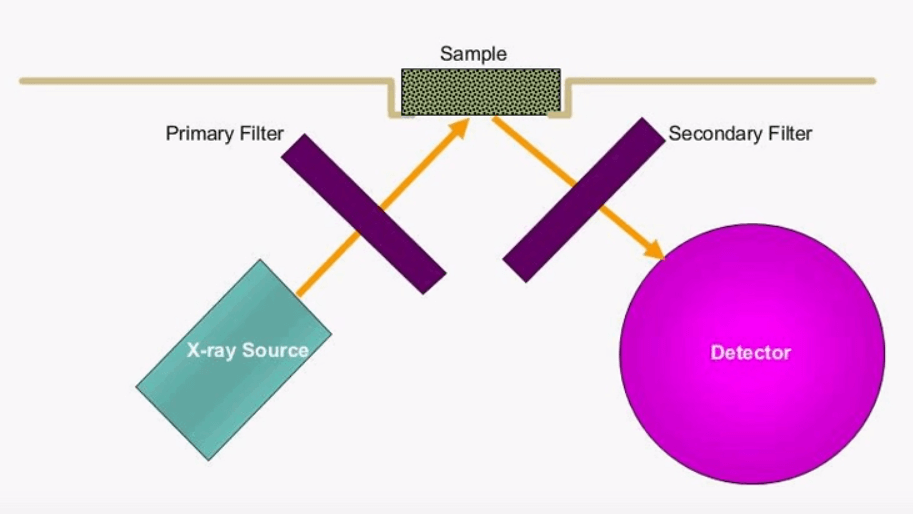
This is the setup in a typical XRF instrument the x-ray source can either be a radioactive isotope or an x-ray tube. The x-rays excite the sample and the detector interprets the energy and amount of characteristic x-rays. In this example we also have a primary and secondary filter; primary filters are typically used to lower the background level which is caused by scattered x-rays, secondary filters work by filtering out a specific element these types of filters are only required if the detector doesn’t have the resolution separate the adjacent beaks.
Intensity
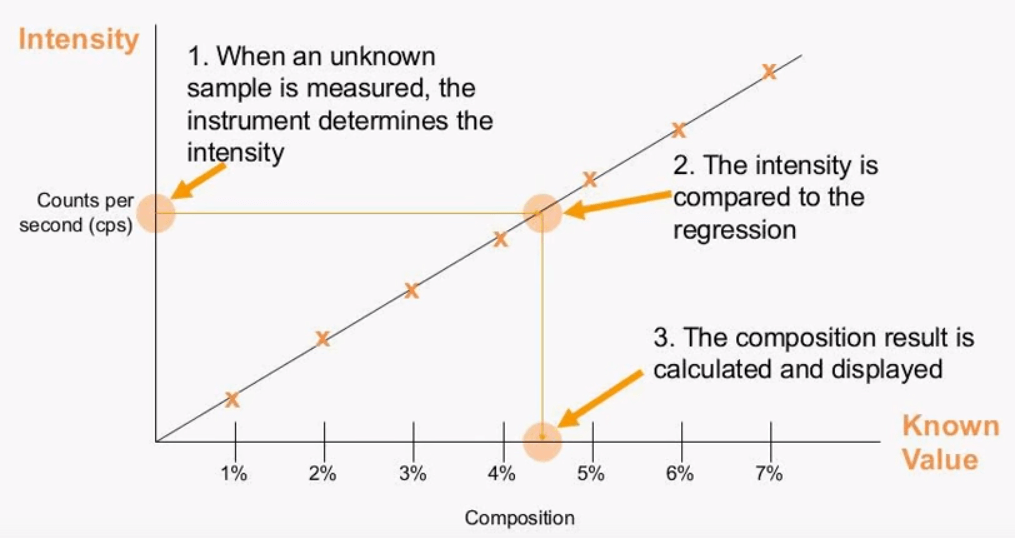 Once the setup calibration standards is measured one can then create an Empirical calibration the standards of known concentration are measured and the intensity is stored. A linear regression can then be created which follows a straight line model {Y=MX+E} where {M} is the slope and {E} is the {Y} intercept more often than not the simple straight line slope will not create the best model because there are other influences from adjacent elements and also other matrix effect. Proper sample prep along with correction factors for any interference will ensure the best possible calibration model this way when the intensity of the unknown is detected it can be compared to the intensity of the storage standards to give a calculated value.
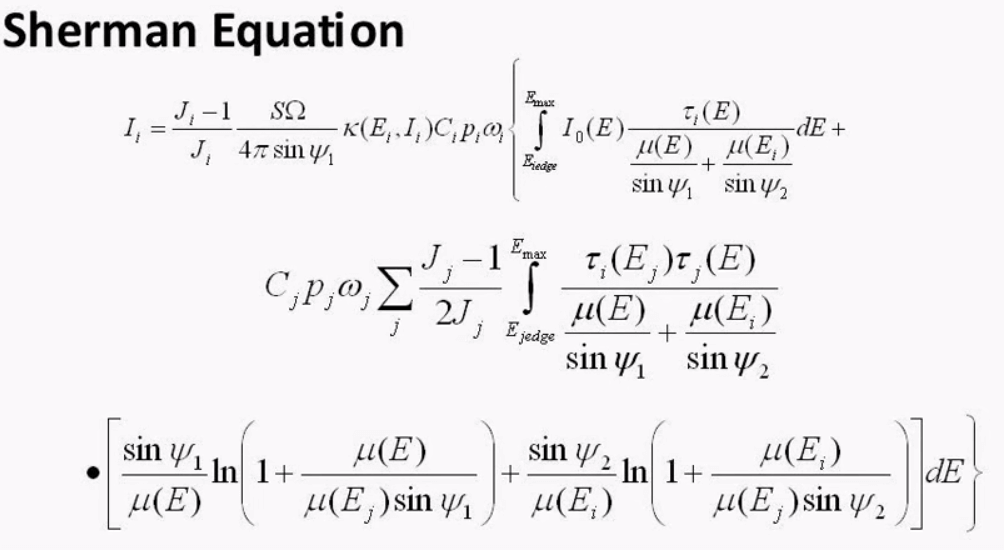 Another way of creating a calibration is using FP or Fundamental Parameters. This slide shows the Sherman Equation which is a typical FP equation, these equations can become quite complex but they can produce a result without using any standards at all. FP uses absorption co-efficient or each element and the measured intensities along with other parameters to calculate a result. One can often make a FP calibration more accurate by adding a standard called a type standard.
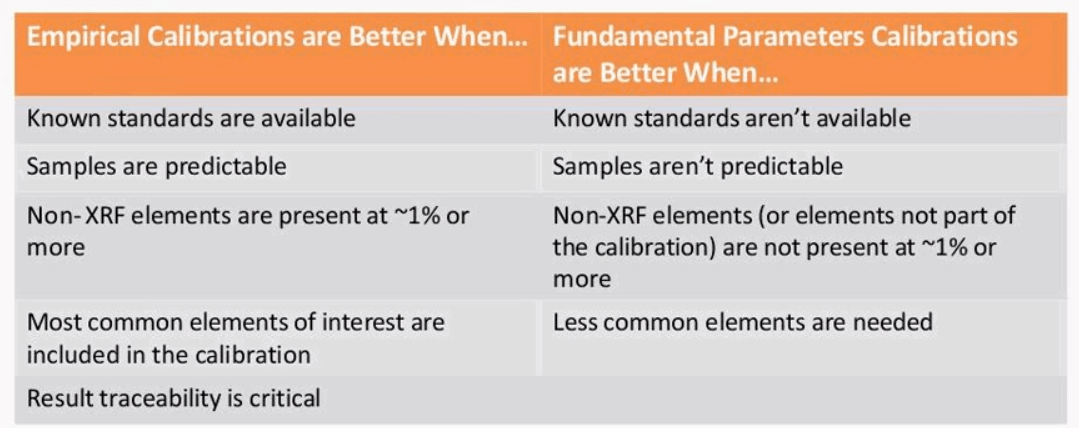
One type of calibration is not better than another they have different advantages. If standards are available then FP is a better option. FP is typically more versatile and can cover a large range of concentration in many different elements and Empirical Calibration when using proper standards and sample prep techniques will give more accurate XRF results. Empirical Calibrations are also better when trace ability back to a standard reference material is critical.
Sampling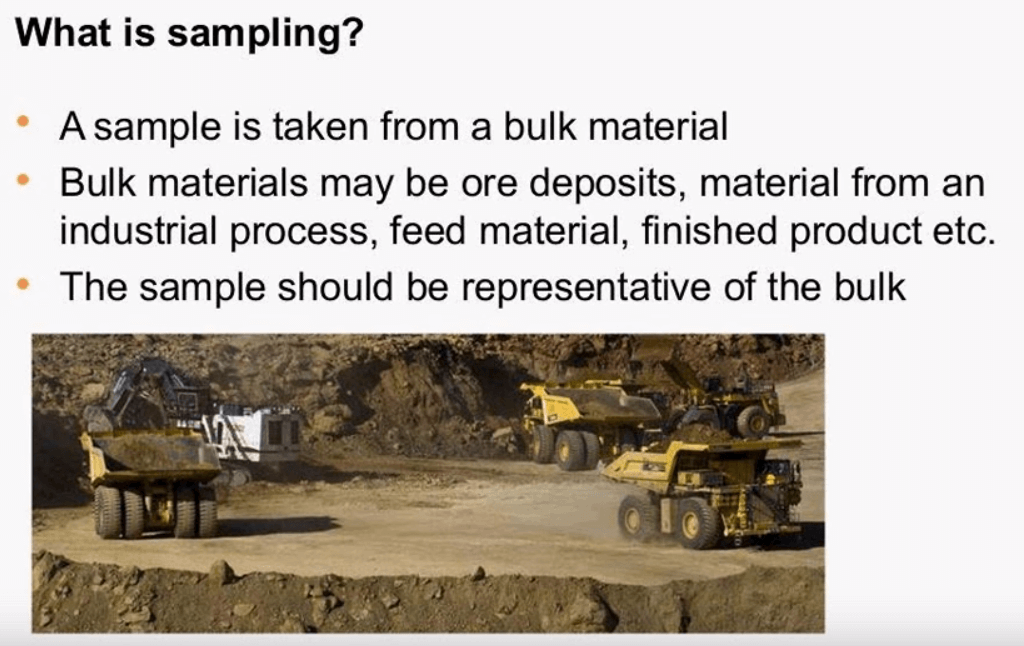
Now that the basic principles of XRF and the different type of calibrations have been discussed briefly the details and sample prep and sampling will make more sense. What is sampling? Sampling is what we are most interested in for our analysis it is important that the sample be representative of the bulk material.From the sample you then create a specimen, the specimen is what is actually placed in the instrument for analysis finally within the specimen there is an analyzed volume since the final results are only based-off of the relatively tiny analyzed volume one can see how important it is to practice sound sample prep techniques.
Analyzed Volume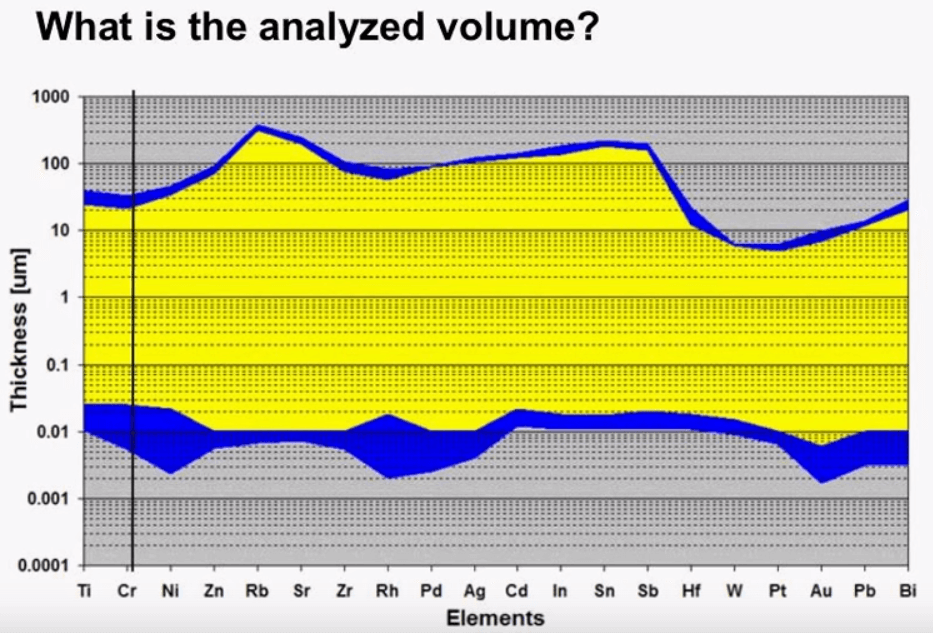
The following graph shows the depth that can be analyzed by a typical XRF instrument for certain elements, one can see that the thickness varies by elements but also varies by other factors such as density and the absorption coefficient of the sample. There is a maximum thickness and also a minimum thickness that shows the limits of the XRF. On the high end we can see that the x-rays do not penetrate very deep into a sample at this maximum level we find that when the sample becomes thicker the instrument does not detect a higher level of expectation in other words the count rate doesn’t increase. This concept is referred to as intimate thickness, in this example if we look at chromium after about 25µm the sample is infinitely thick because the detector does not see any difference in the sample. The depth in which the x-rays penetrate multiplied by the area of the x-ray beam is the analyzed volume.
Effect of Particle Size on XRF Results
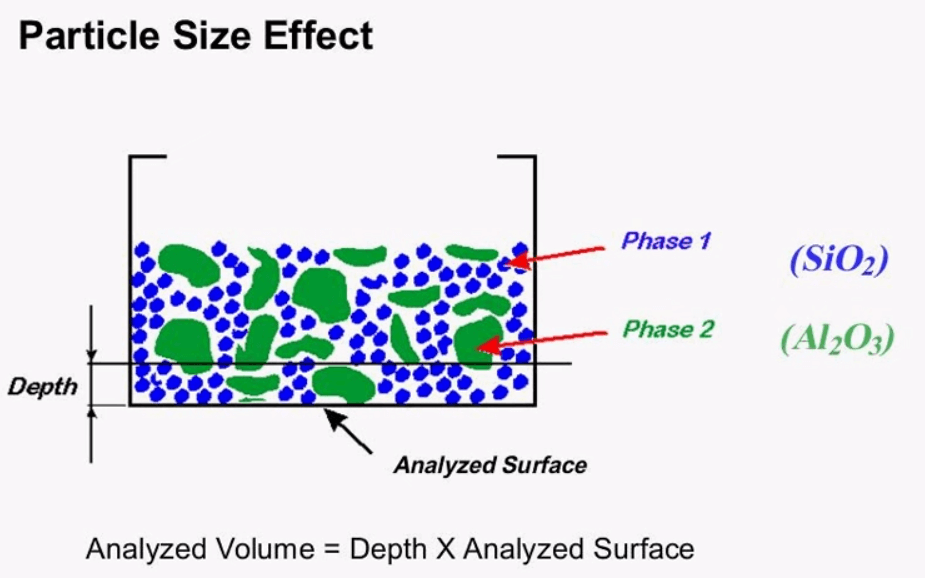
Here is an example of how the XRF analysis can be impacted by the analyzed volume in this example two particles of aluminum oxide are within the analyzed volume its imaginary line is drawn representing the second analyzed volume. There are five particles of aluminum oxide this is an example of a specimen that may not be ready for analysis due to the particle size effect grinding and pressing can reduce the particle size effect.
Mineralogical Effect
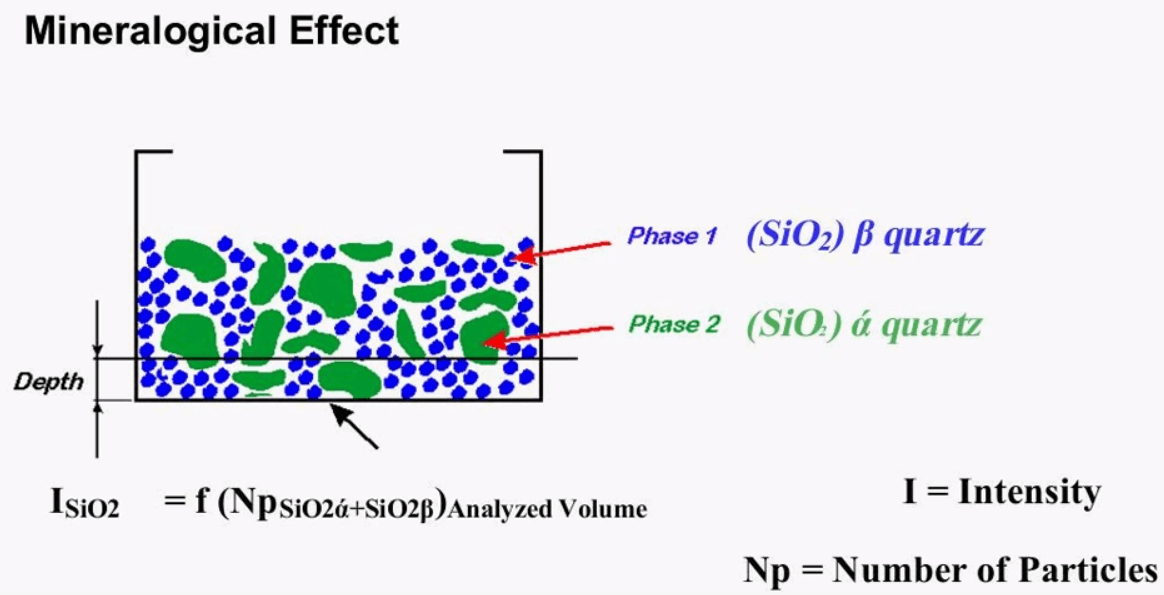
The same picture can also be used to show the mineralogical effect of the sample, this time it is assumed that both the green and blue particles represent silicon dioxide but here they are in two phases of crystal structures. There are many structures of silicon dioxide for this example of alpha course and beta course is used these two structures have different physical properties which may lead to different sensitivities, this mineralogical effect is small compared to the particle size effect, grinding and pressing can reduce the particle size effect but the only way of eliminating the mineralogical effect is through creating fusion beads, if fusion beads aren’t an option it is important to make sure that the standards used for calibration are made up of a similar structure as the actual unknown. These standards may sometimes be difficult to acquire so that is why it’s always a good idea to have a backup set of standards that are actual production samples which are measured by a different form of analysis this will give you more confidence in your results.
Grinding XRF Sample
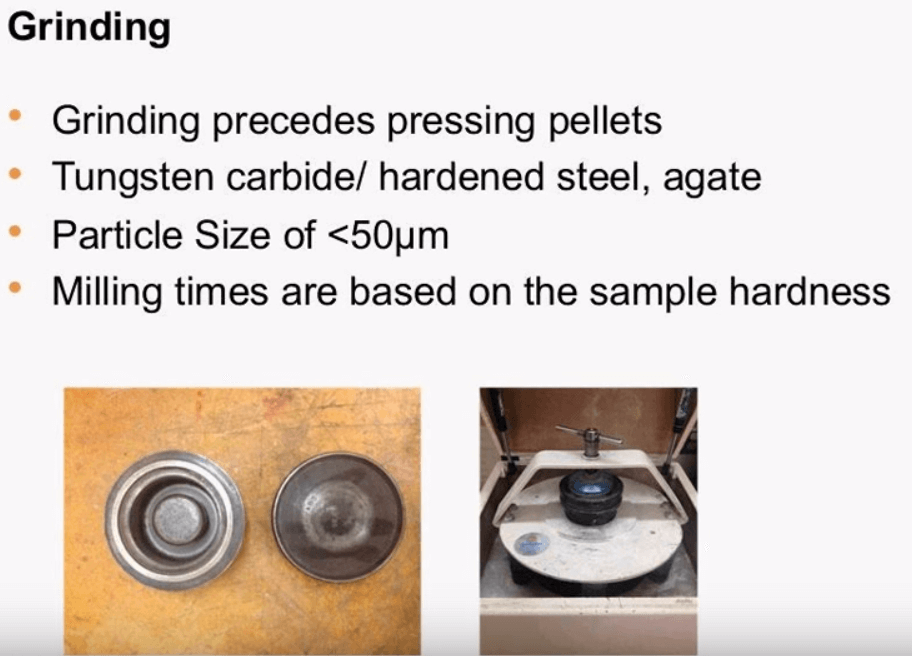
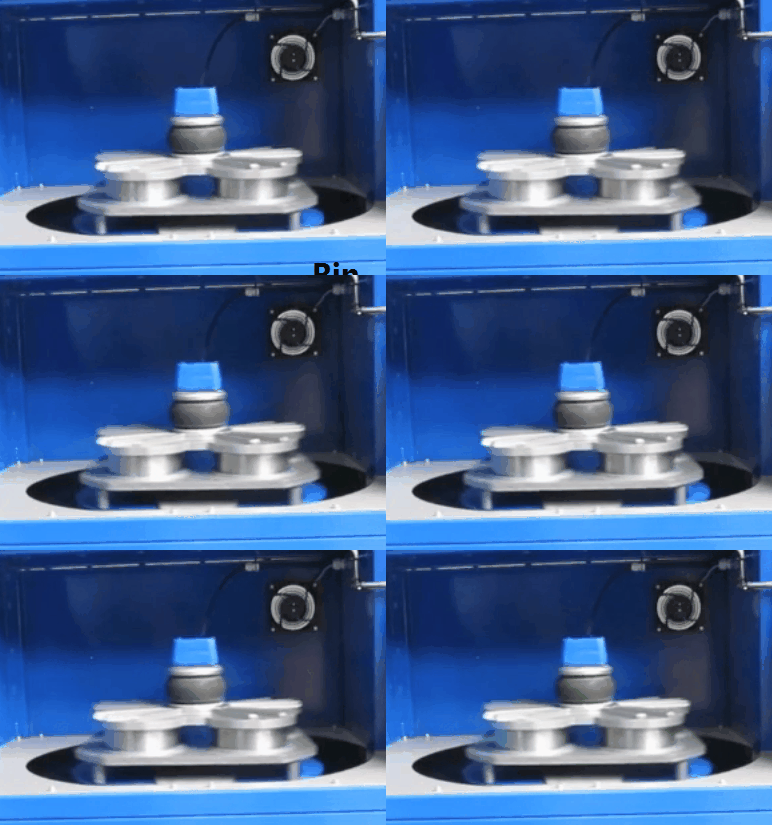
Grinding plays a vital role in reducing the effects of particle size, grinding works by making all the particles in the specimen a consistent size the picture here shows Ring & Puck mill pulverizer which, in general, these mills can be made of hardened steel, agate or tungsten carbide the choice of material will depend on cost and type of contamination you potentially introduce to the specimen. Tungsten carbide mills for example have been shown to reduce cobalt at a five PPM level to a 7g silicate sample to four minutes of grinding. Grinding times will also vary sample to sample, the testing should be done in order to see if the grinding time shows them as adequate. Grinding time can be increased in specified intervals and retested; the optimum grinding time can be timed when the analysis does not change significantly when more grinding time is added. Higher samples will generally require more grinding time, a grinding time of 5 minutes is typical for raw mill cement ad finish cement in 4 minutes is typical for silica sample. The following two slides show a real world example of the impact of grinding.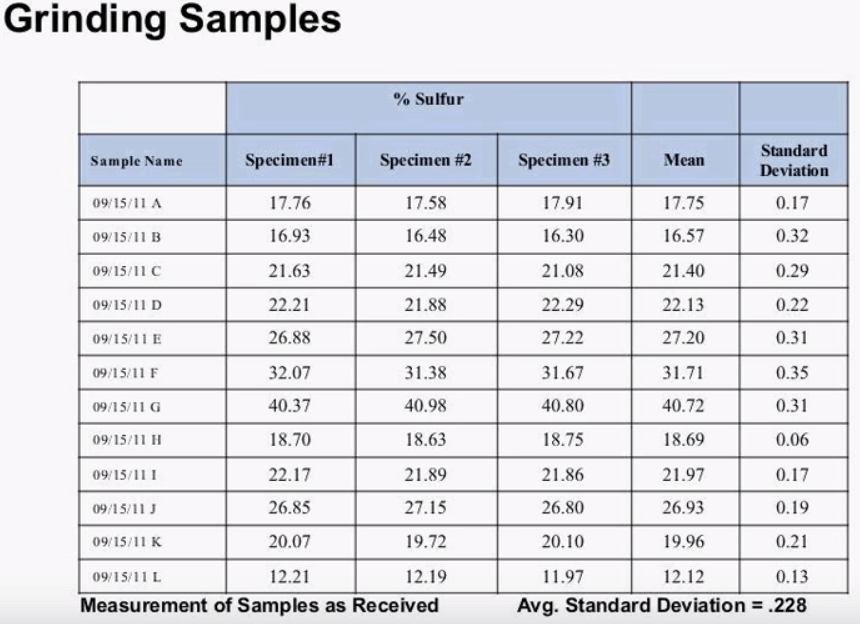
Here we have 12 samples of fertilizer and three specimens of each, the samples were received in a loose powder form, we can see that the average standard deviation for these 10 measurements was .228%. 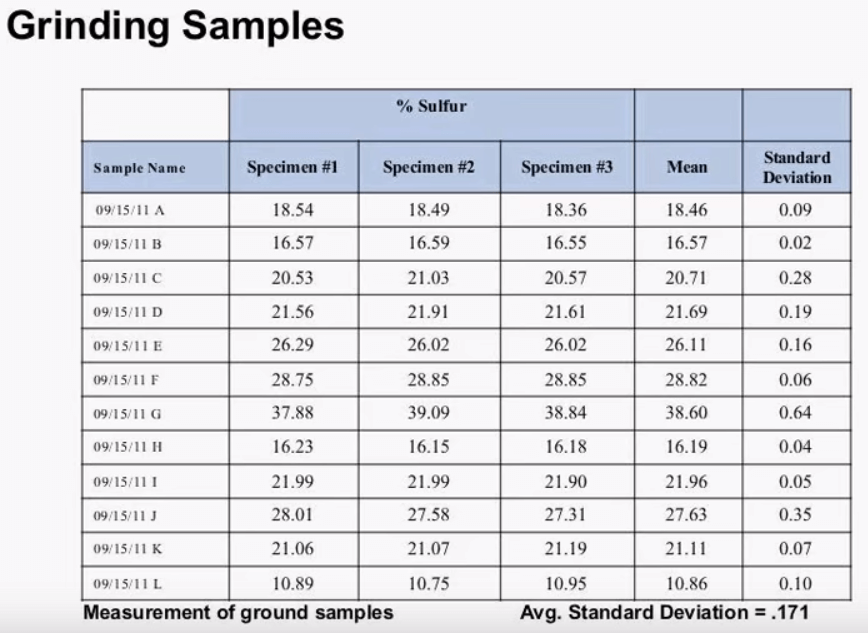 This slide shows the same 12 samples after being ground in a Tungsten Carbide Puck Mill, 20g of sample weighed up and the samples were grounded for 2 minutes, after grinding the average standard deviation dropped down to .171% that’s an improvement in the repeat ability of 25%. After the sample is ground to the appropriate size it can be measured as is or it can be pressed into a pellet. Pressing pellets generally gives better results than running a loose powder.
Pressing XRF Sample
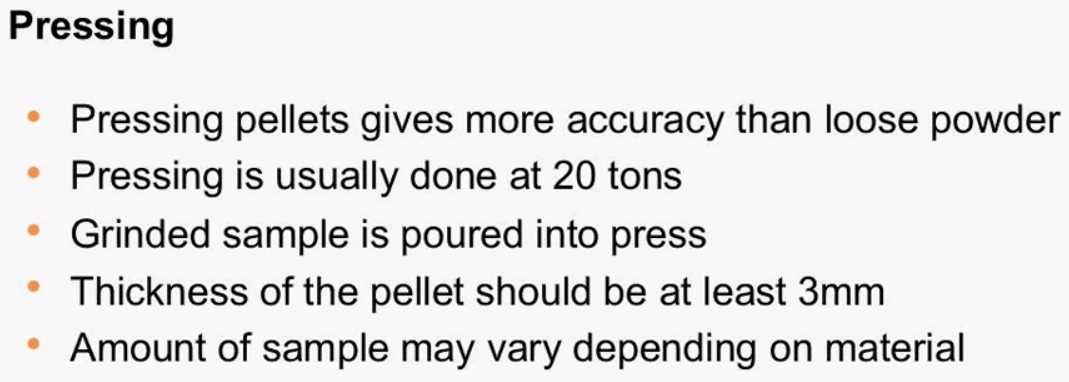
Pellets are generally pressed at 15 to 20 tonnes per square inch, which produces a flat smooth, dense sample for testing once the pellets are held at this pressure for about 30 seconds the pellets can be carefully removed. The pellets should now be around 3mm thick, if the sample is thinner than this consider using more sample the opposite is true if the sample is much thicker than 3mm again consistency is key so the sample needs to be weighed before pressing.
XRF Pellet Binder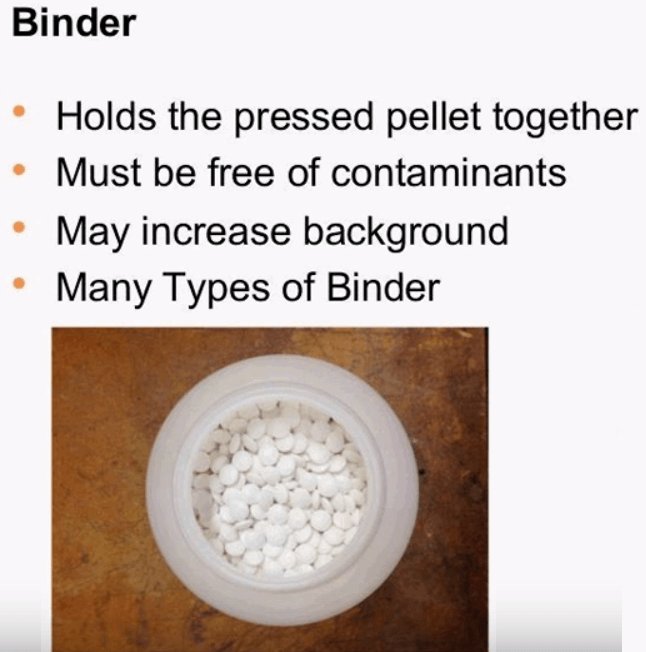
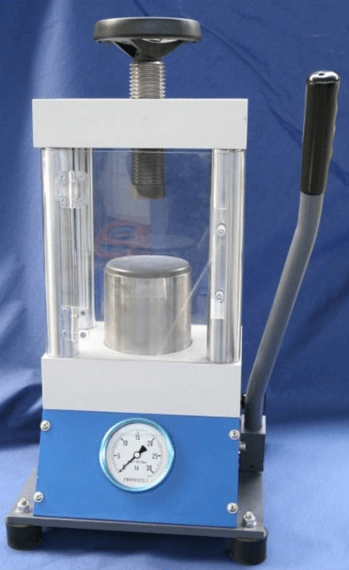
When creating a pressed pellet sometimes a Binder is used. Binder holds the material together to make a more resilient pellet. Binders are typically free of contaminating element because it contains a very light matrix, elements that can’t be detected by XRF.
The binder needs to be stable under a radiation and backing conditions. The different types of binders can vary from liquid to solid, starch and cellulose are some common examples of a type of binder material. Since binder contains such a light matrix it usually makes little difference in the absorption of x-rays in a sample containing the average atomic weight matrix it can however increase the background due to scattering which may reduce sensitivity to a light element this is why it’s important to only use the minimum required amount of binder if any.
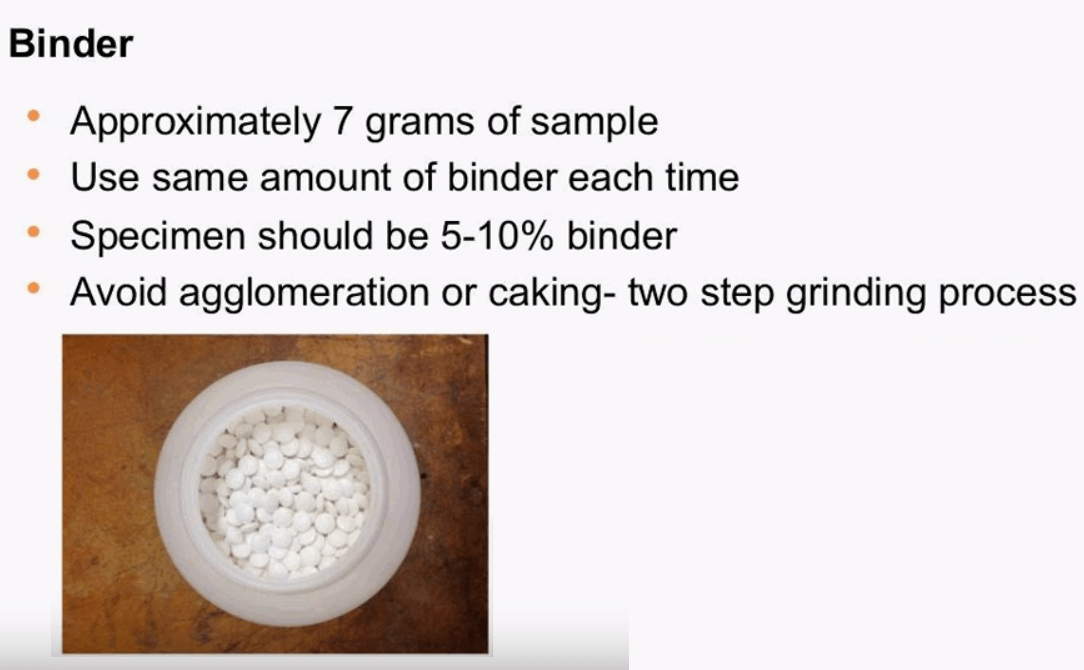
When making a pellet press one should use about 7g of sample the binder should be added after the initial grinding and then ground for an additional 30 seconds, this two-step method of grinding was proved to produce highly resilient pellets. Agglomeration or caking may occur if the binder is added in the beginning of the process, agglomeration can also occur if the incorrect amounts of binder is added to the sample, the correct amount of binder should be about 5 to 10% of the sample weight, it is extremely important to use the same amount of binder in each standard for calibration and in each unknown any deviation from this ratio may decrease accuracy for analysis.
Here one can see some pictures of the typical setup for pressing pellets, on the right there is the Dye set the sample is placed in between the two discs then the plungers is inserted on top and the whole assembly is carefully placed in the press.
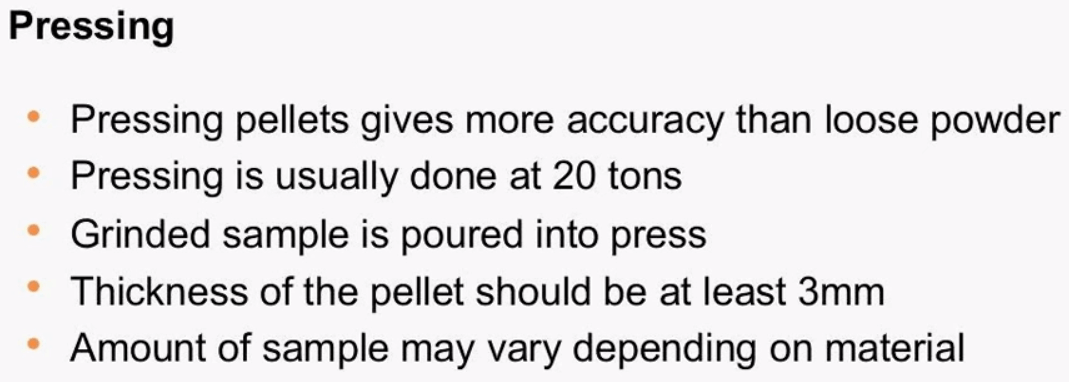 Here one can press and hold the sample at 20 tons of force for about 30 seconds to reveal a smooth pellet the dye must be cleaned thoroughly between each pellet to reduce contamination and for ease of operation. The dye can be cleaned with plastic dish washing source, do not use anything abrasive or metal for cleaning as this can harm the dye surface and affect the consistency of the pellets. As discussed in order to reduce the effects of in-homogeneity and particle size effect you can grind and press the pellet.
XRF Fusion Beads
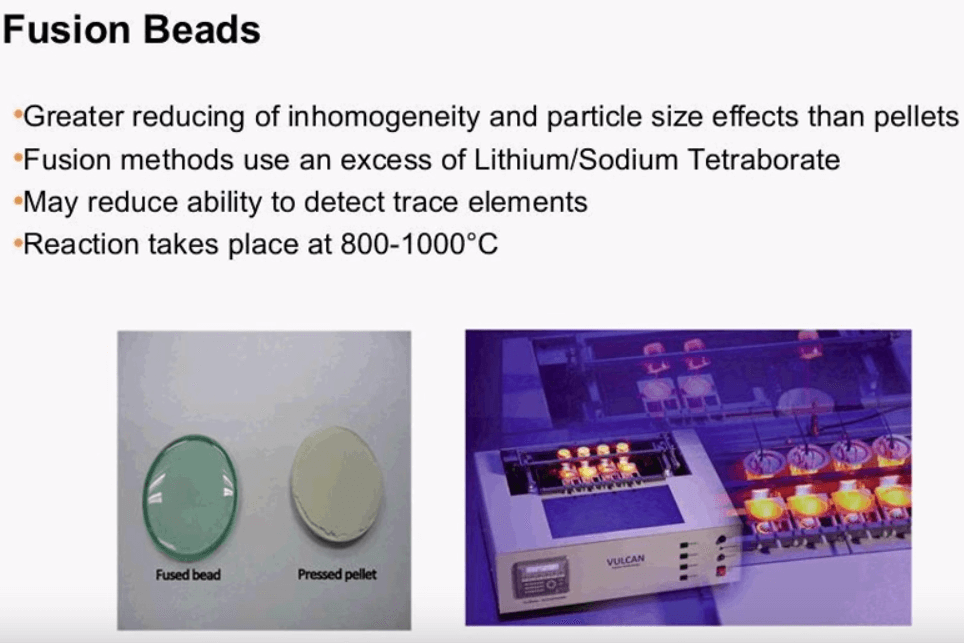
When the accuracy and precision of results is most important consider making Fusion Beads. The beads are made of a small ratio of sample to flux, a ratio is critical to analysis and will affect both the speed of the reaction and the way the sample is absorbed by the flux. The ratio sample to flux can range dramatically but the first and a commonly proposed method uses a ratio of 1 to 100.
The different thing is, is inside the sample alpha and beta course if we go back to our previous example will undergo a chemical reaction to create a more uniformed or completely non-crystalline glass white structure that is ideal for analysis. The chemical reaction involves heating the sample and flux to a temperature of 800 to 1000°C in a crucible. Crucible material can also vary but then an alloy of platinum plus 3 % gold is hardly wetted, this reduces cleaning time and contamination. Taking fusion beads leads to better accuracy and precision over the pressed pellet but in should be mentioned that since the sample is diluted the detection of trace elements may not be possible.
XRF Sample Spinner
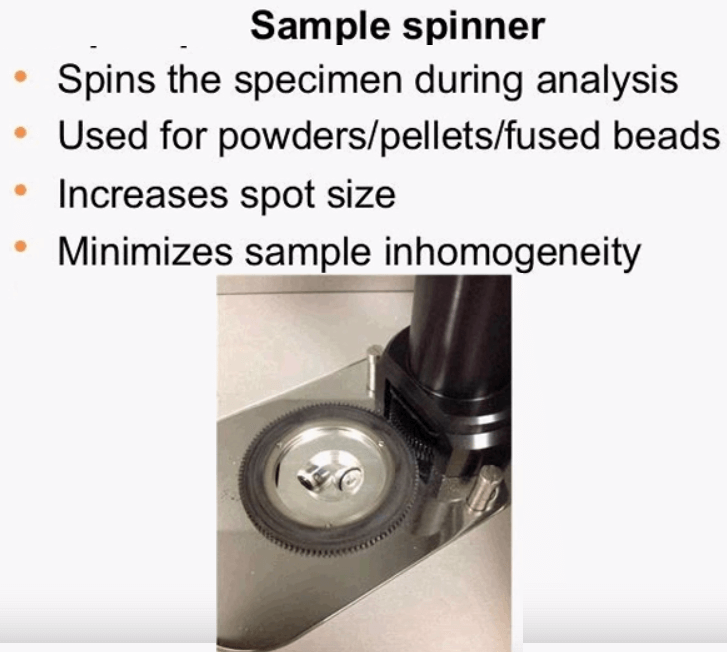 Both products are commonly embedded with sample spinner in order to rotate the sample during analysis, the sample spinner is used when measuring powder, pellet, or fuse bead samples. The sample spinner effectively increases the spot size as well as helps to minimize the effects of inhomogeneity in the sample service, once the calibration is created the sample spinner is setup to run automatically.
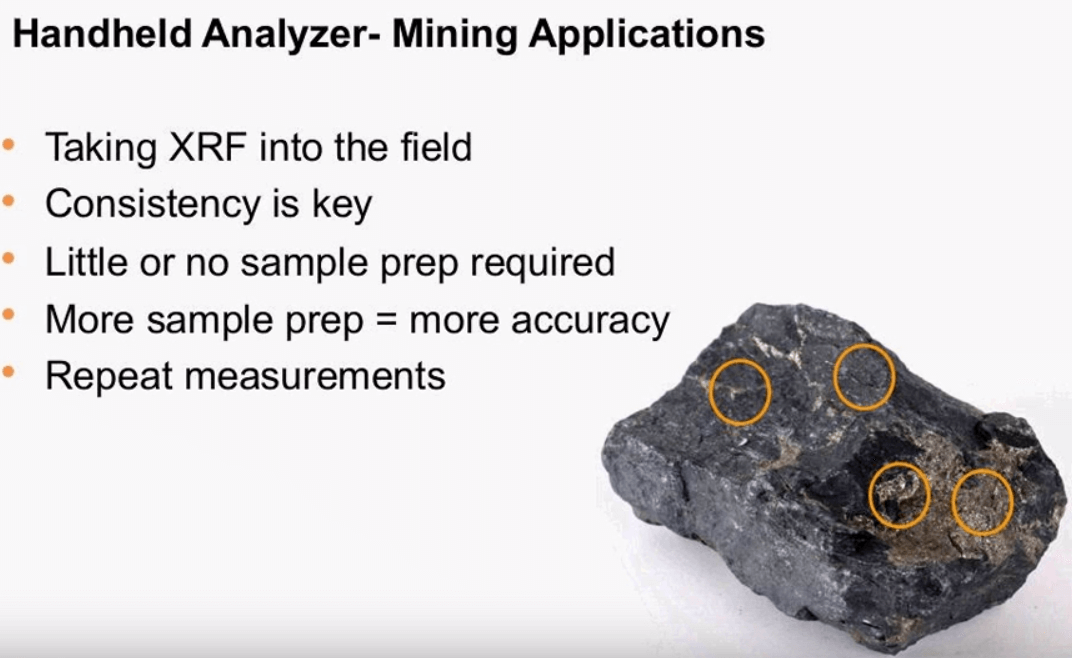 XRF is essentially a comparative method so it is very important that standards of the unknown are measured in a consistent way. The direct analysis of a sample is certainly possible and easy to perform especially with a handheld XRF, using a handheld has its advantages as it eases the load on the lab and also leads to quicker decisions. Measuring samples in the field will often require some sample prep, this type of sample prep can be as simple as ensuring that you are measuring on a flat smooth surface each time it is also important to measure many test points gathering enough data for accurate results, looking at the sample of rocks one can see the different test points in an average of four measurements will certainly give the analyst a better picture of what is in the bulk material over a single measurement.
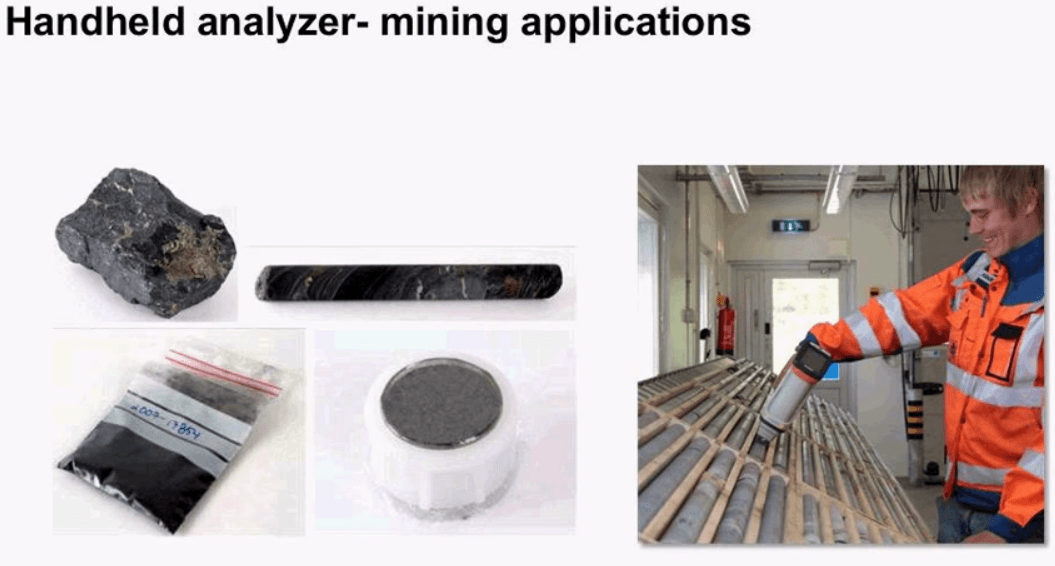 Drill core analysis and mine mapping are commonly done using handheld analyzers. Miners can use the data collected to determine how deep to dig or to find the next location for a potential expansion of the mine. FP calibrations are used when little sample prep is required like in the rock and core sample seen here. The option to create Empirical calibrations with more sample preparation techniques is available with more accuracy or a lower limit of detection is needed. Grinding samples, pressing pellets or creating fusion beads will all be potential options for this type of material.
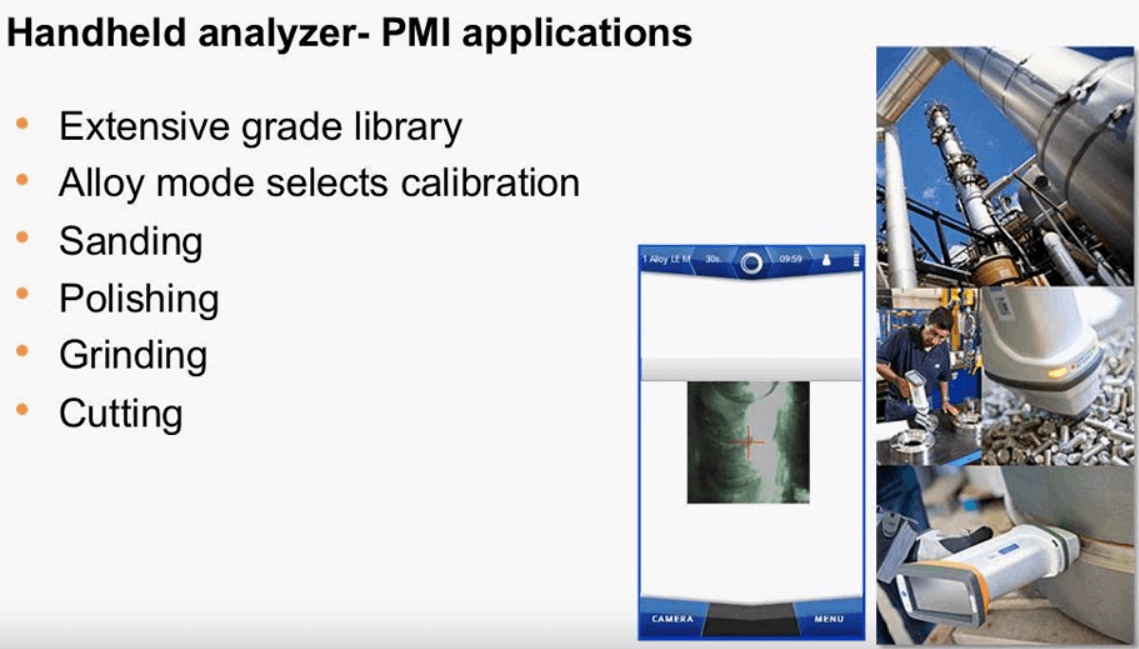 The X-met analyzer also has the ability to positively identify different alloy. There is an extensive grade library within the instrument and the operator has the choice of using alloy mode which automatically selects from a list of stored calibrations, some of the alloys include nickel, cobalt, aluminum, stainless steel and many others. Alloy mode selects simple FP and stored empirical calibrations which are traceable back to standards. Sample preparation for these types of metals are simple; sanding, polishing, grinding and cutting can all be done with the ultimate goal of producing a flat smooth homogenous surface without contamination this is most important when measuring aluminum alloys since this is a light element.
Coated Paper
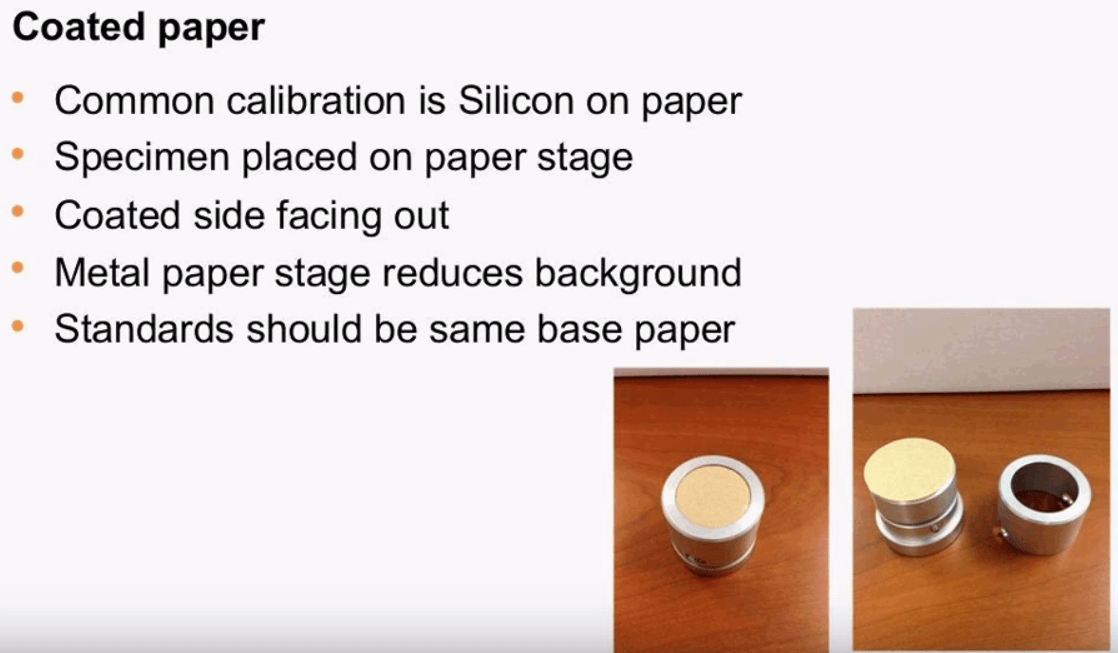 When measuring coat weight on paper it is important to use a paper stage. One typical calibration is silicon on paper which is used as a relief liner for stickers and labels. The paper stage is made up of metal which works to reduce the background by providing a heavy matrix to absorb the x-rays; the paper is placed on a paper stage with the coated side out so that it faces the detector and x-ray tube. It is it important that the same base paper be used for all standards and a blank or sample without any coat weight be used as an instrument correction, this way if the base paper does change a new blank can be cut and measured to prep for the difference, usually seen as a difference in background.
Fluids and Solutions
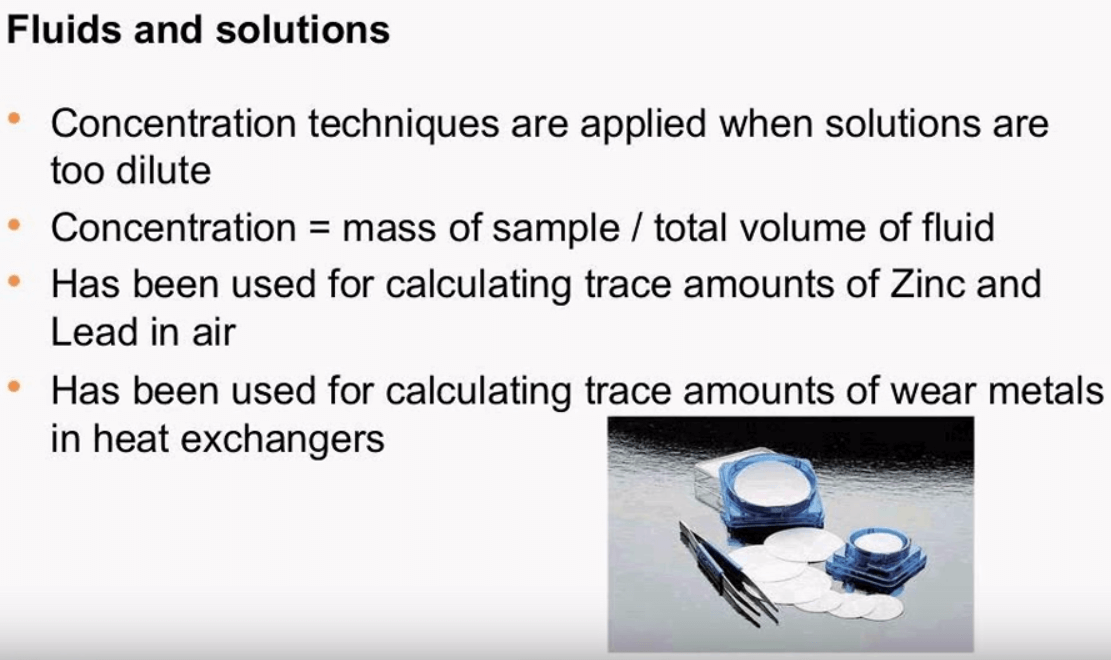 When a large amount of fluid is available for analysis and the concentration level is too small to quantify certain concentration techniques can be done. The nuclear power industry uses filters like these to test for soluble and insoluble metals in the coolant water this technique has also been used to extract and test for zinc and led an air. Pour and dilute liquid samples into a standard liquid power cup will not work unless they are detectable amount of analytes but by using filters these analytes can be concentrated and easily detected. the concentration of analytes in the fluid can then be back calculated by using the total volume of liquid passed through the filter. In order to use this calculation it is assumed that the entire sample is excited because it is contained in a thin film.
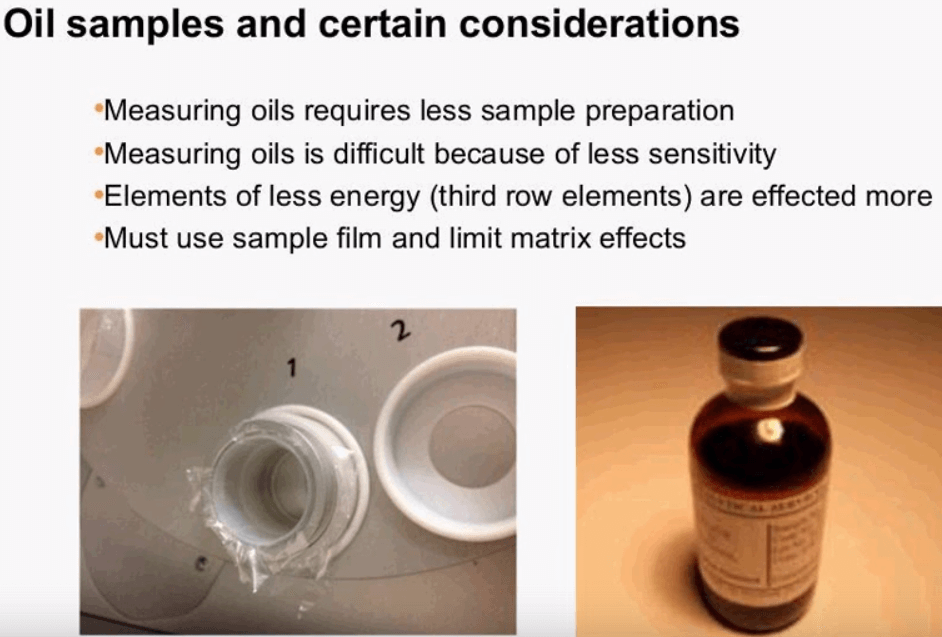 Since most oils contain a high enough concentration to measure directly they can be analyzed simply by pouring oil in a sample cup prepared with sample film, different factors can affect the accuracy of the oil analysis. Oils will have a matrix made of light elements like carbon and hydrogen which tend to scatter x-rays and produce more background which reduces the sensitivity, these effects can be exaggerated when the viscosity or density of this oil matrix is varied, there are corrections that can be applied to compensate for this change in back ground but it is important to make sure that the standards being used for calibration are similar to the actual unknown samples. Care should also be taken to shape the standards or measure the samples quickly to avoid settling. Another example of a matrix effect can be illustrated by measuring used and new oils in the same calibration. A new oil will have unused fuel additives but a used oil will have the additive, plus decomposition product in small metal particles, in order to prepare this used oil sample for analysis it may be required to filter the oil or user a center fuse to remove any solids. Matrix effects can also be reduced by diluting the sample but this may reduce the detection of trace element these sample film is also required and does reduce sensitivity.
XRF Sample Film
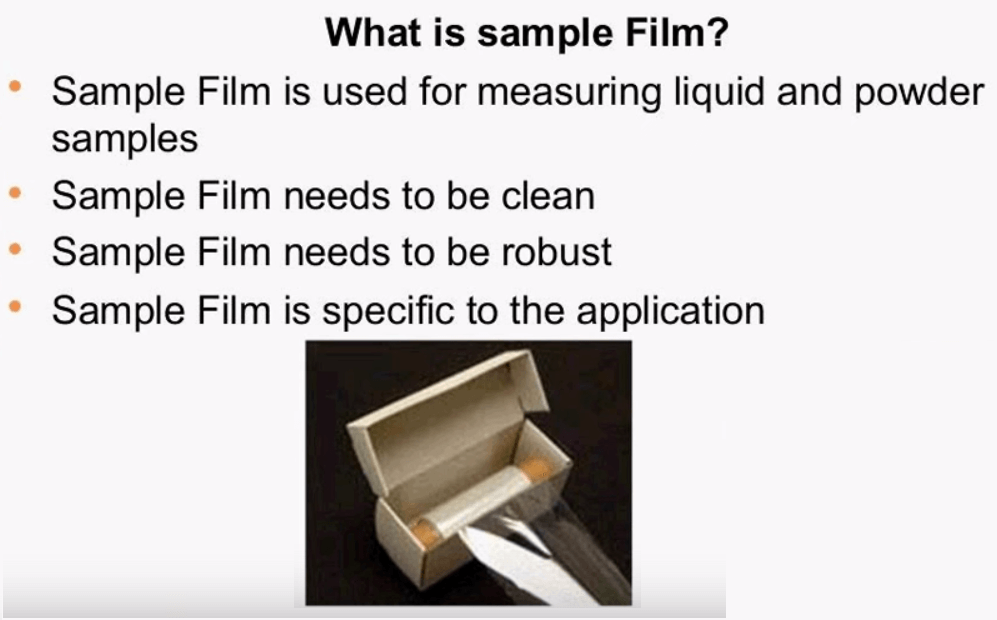 Sample film is another important part of sample prep for liquids and powders. Sample film is a transparent layer of protection needed to shield the detector and x-ray tube from the sample; the sample film needs to be cleaned and free of contamination. In the oil industry this is especially important as customers are usually dealing with smaller concentration in tight limits, the sample film also needs to be robust and resistant to petrol chemicals and solvents, and all these factors are weighed to determine the correct sample film for the application.
  These are some of the examples of the films that are most common; Poly 4 is the highest transmission film that is used, it is important in the wear metal application when measuring light elements like sodium, magnesium or aluminum. These elements are found in PPM levels in oils are especially sensitive to film tightness and film thickness. When a thick film is used it absorbs more count which leads to an instrument that is not able to measure low levels. Mylar is a robust film that is used for the 4th row elements in which the cleanliness and thickness of the film are less important, sometimes film has special properties that are more conducive to better analysis than others. Poly M is used for sulfur determination because there is no contamination from silicon. Silicon can negatively affect the results due to the proximity of sulfur on the periodic table.
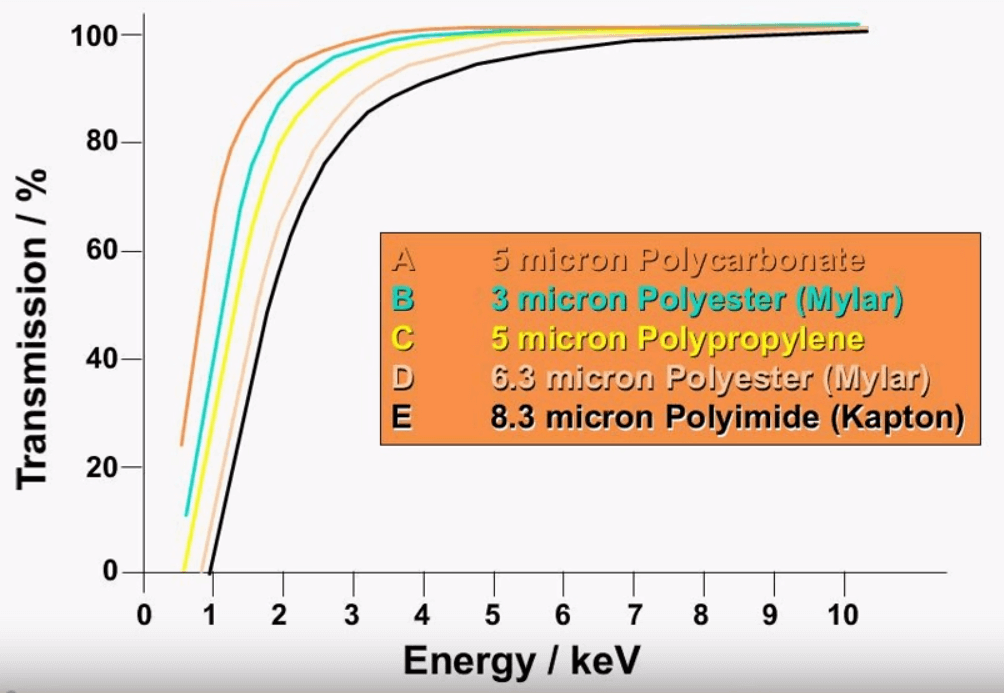
This just fairs as an illustration for the different types of film one can see that after about 6keV which is iron, the type of film used really doesn’t matter at all after 6keV all the film type shown here have about the same transmission. The type of film used is most important around 1keV which is the sodium level and one can see a very big difference from Kapton film shown in black and the polycarbonate film shown in orange. The transmission percentage is about 60% at 1keV for Polycarbonate and there is barely any transmission at all for the Kapton of the same energy level.
How to make XRF sample cups
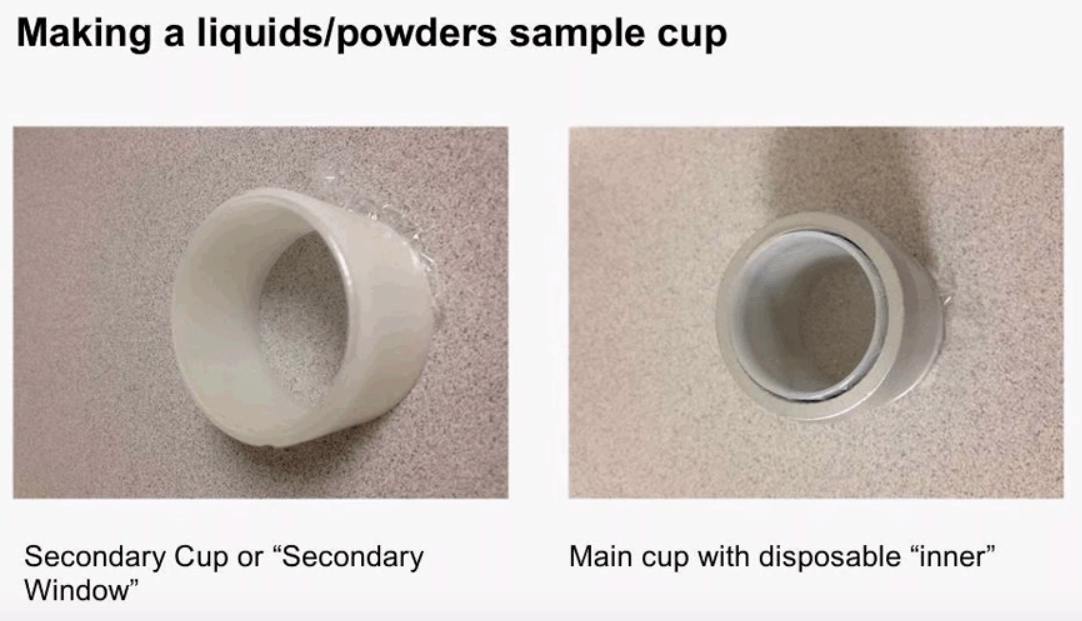 When making a sample cup for liquid or powder analysis generally a second layer of film is used this secondary window is used as a backup in case there is any leak from the main cup. The main cup is then placed inside the secondary cup, it is important that the film on both cups be free of any wrinkles or contamination, once the sample is measured the inner of the main cup can be disposed of and replaced with a new disposable inner. The film on the secondary cup must only be changed if contaminated or wrinkled.
 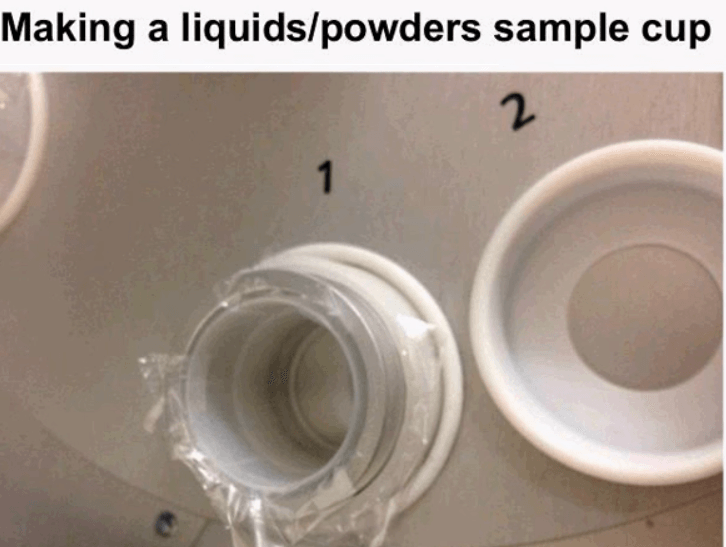 This is how the liquid powder cup sits in the sample carousel there is a thin line about half way up the inner, even though the analyze volume is much thinner than this disc it is important to be consistent when filling the cup because of the packing density and other factors. Here we see that the main cup is within the secondary window and this is placed inside the sample carousel. The x-rays have to travel through two layers of film so it is even more crucial that the correct film be used.
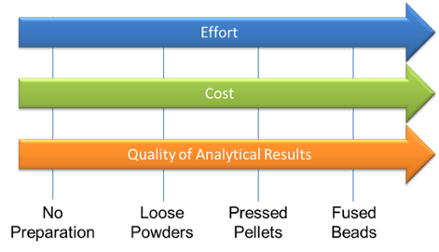
 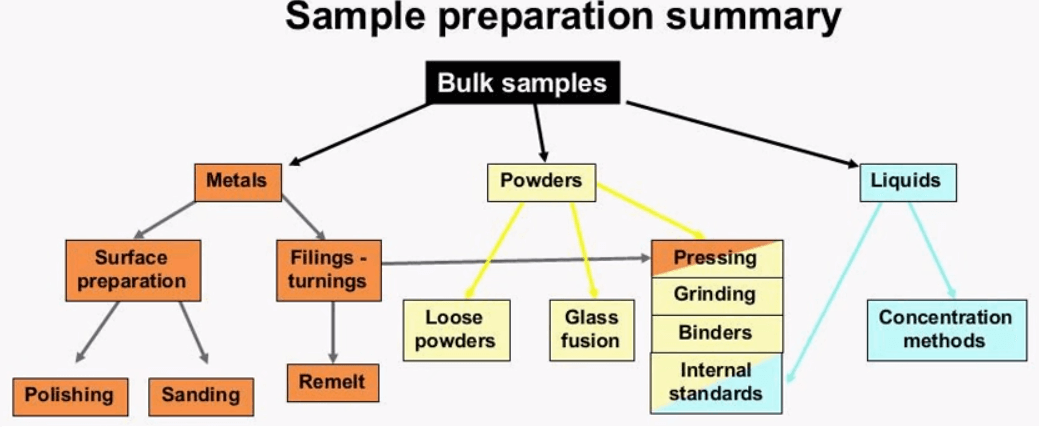 This diagram shows the sample preparation techniques covered in this presentation, there are many factors when deciding on the right amount of sample preparation for your needs. You must weigh out costs of the equipment and materials with the accuracy desired. If you are new to using XRF start with less sample prep and move on to more advanced if your application is more critical. Thank you for taking the time to attend this webinar. I will now hand it over to Jordan so that he can answer or he and I can answer some questions.
When do we need to use XRF Sample Prep Binders? Binder can be used when the sample is soft or binds together more easily, so gypsum might be an example of a sample type that you wouldn’t have to use binder, typically with Lax tone or line samples we do use binder and you can also tell because when you create the press pellet if it does crack or the surface does flake off that will certainly impact analysis and we try to minimize that.
Can you use more samples than 7g for making pellets?
What’s the maximum amount of this that you can use, and is it dependent on the pellet size?
It certainly is dependent on the pellet size; you basically want to strive for a pellet that is 3mm thick. So after you grind the sample and you press the pellets you can then see how thick the pellet is an estimate how much more sample you need to add so that the pellet can become 3mm thick.
What is a type XRF standard? Type standard is any sample that can be used to increase the accuracy of your results, so after you have a calibration line you use the type standard to measure a sample that might not be measuring accurately. So an example would be if we set up a calibration for oils and we were typical running a 5W30 oil and it ran accurately, if you put a different type of oil say a 10 W30 or transmission fluid it might not run accurately because now you’re comparing two types of oils that may have a different weight or viscosity, so you use a type standard to adjust for that difference.
What causes background in the spectrum? Background is generally caused by; we call them to tube line, so basically energy from the x-ray tube, there’s a filament and that causes tube lines in backgrounds but background is also just caused by constant scattering of white elements. So any time you measure a sample containing a white matrix, like oil which is a hydrocarbon or plastic it will generally produce more background.
When measuring light elements such as aluminum and silicon is there of big difference between using a fine powder compared to a pressed pellet? There is a pretty big difference, I don’t know if I could quantify that difference but generally for the light elements press pellets will give you better accuracy over a loose powder and that’s because it’s much more dense and you just have better transmission.
When you’re measuring sulfur and oil with a thicker film such as Mylar how well could the limit of detection be for sulfur, using a thicker film compared to let say poly 4? Around five PPM might be your limit of detection.

