Table of Contents
- Properties of Materials and a Classification of Rock Properties
- Theoretical Concept of Material Properties
- Classification of Rock Properties for Engineering Purposes
- Section One-Inferred Properties
- Attenuation Symmetry
- Elastic Symmetry
- Orientation Conventions for Elastically Anisotropic Rocks
- Properties Related to Petrofabric Homogeneity
- Defect Frequency Orientation Analysis
- Diametric Mineralogic Analysis
- Grain Elongation Analysis
- Macrogrid Analysis
- Mineralogtc Modal Analysis
- Standard Petrofabric Analysis
- Transgranular-Intergranular Analysis
- Parameters Related to Macroscopic Behavior of Geologic Formations
- Explosion Detonation Rate
- Field and Laboratory Explosive Cratering
- Fracture Phenomena of Rock Masses by Explosive Charges
- Propagation of Seismic Waves in Rock Mass
- Refracted Seismic Waves in Layered Geologic Formations
- Stress Waves Generated in Rock by Explosives in Laboratory Tests
- Stress Waves Generated in Rock by Explosives
- Vibrations Produced by Surface or Underground Blasting
- Properties Related to Inelastic Deformation and Strength of Surface
- Abrasiveness
- Comminution Resistance
- Inelastic Deformation of Surface
- Inelastic Deformation of Surface Under Oscillatory Point Load
- Interfacial Phenomena (Solid/Solid)
- Surface Interaction of Solid/Liquid
- Section Two-Physical Properties
- Specific Weight
- Void-To-Bulk Volume Ratio
- Volume Measurements
- Elastic Behavior Under Uniaxial Compression
- Elastic Behavior Under Uniaxial Tension
- Elastic Response to Ultrasonic Pulse
- Elastic Response to Induced Vibration
- Elastic Response to Induced Vibration (Damping Capacity)
- Elastic Response to Induced Vibration at Elevated Temperatures
- Load-Resisting Ability under Uniaxial Compression
- Load-Resisting Ability Under Diametrical Loading
- Load-Resisting Ability in Bending
- Load-Resisting Ability in Bending at Elevated Temperatures
- Inelastic Behavior of Surface
- Interfaciai Phenomena and Surface Interactions
- Interfacial Phenomena (Air/Liquid)
- Percolation of Gas and Water in Rock
- Electric Polarization
- Magnetization Capacity
- Thermal Conduction
- Thermal Capacity
- Thermal Expansion
Design engineers involved with mine or tunnel construction require knowledge of rock behavior in order to assure economic excavation of rock and stability of underground openings. For many applications, the behavior of a rock is determined from an engineering approach involving rather empirical experiments. A greater emphasis is now being placed on the use of fundamental properties of rock to calculate the response of a rock to external forces (within defined environmental conditions) and thus determine the probable behavior of the rock in the field situation. In order for these calculated behaviors to adequately represent the actual rock behavior, however, a great deal of research and thought must be devoted to insuring measurement of relevant rock properties. Great care must be taken to make certain that these relevant properties are measured by accurate, reproducible, and technically correct techniques.
The Bureau of Mines has devoted a significant amount of time and money to developing and improving rock property testing techniques used in research on improving mining safety and economics, both of which depend upon control of rock behavior. During these efforts many testing procedures have originated, and inputs to society testing standards have been prepared. Although the testing procedures have been widely distributed in many publications, frequent requests from universities, mining companies, and individuals for descriptions of Bureau procedures for obtaining rock properties indicated a need for compilation of this information into a single source. Accordingly the Bureau’s Twin Cities Mining Research Center has assembled this manual containing all the test procedures used at the Center.
The manual is designed to offer ideas, methods, directions, and references that the reader may consult for further details on testing procedures. The description of the method and the instructions for performing a test include essential details of the test apparatus, test specimen, test procedure, and test data reduction needed to achieve satisfactory results.
The test procedures are divided into sections according to four broad categories of properties: Inferred, physical, basic, and mechanical. A general treatment of material properties as well as a description of the division of properties into the appropriate sections is provided in a separate section. The individual procedures alphabetically arranged within each sub-section are titled with reference to the measurable qualities or behavior that describe the desired properties or characteristics. References relating to each subsection are given in a list at the end of the subsection and are represented in text by underlined numbers appearing in parentheses.
The procedures for obtaining rock properties presented in this publication do not purport to be standards, nor are they represented as necessarily the only procedures for obtaining certain properties. The Bureau’s Twin Cities Mining Research Center is continuously striving to improve its procedures , and it is likely that in time many of the procedures described here will become obsolete. As old procedures are improved and new procedures vital to the mining industry are developed, this manual will be revised.
In most scientific and technical work, it has been accepted that the modernized metric system is generally superior to any other system. The International System of Units (SI) Is, therefore, recommended as appropriate for expressing all physical quantities. The U.S. customary units are, however, retained in the text for practicality and familiarity until the International System of Units is officially adopted.
Properties of Materials and a Classification of Rock Properties
A Philosophical Concept of Mining
The basic premise of the philosophical concept is that mining (earth excavation) is a dynamic process involving the application of energy to a material to remove all or part of the material under the conditions imposed by the environment in which that material is found. Similar to other engineering disciplines, mining utilizes space, time, energy, and material resources .
Technologically, the mining system may be broken down into four major subsystems: Rock disintegration, ground control, materials handling, and environmental control. In each subsystem, attempts have been made to formulate physical laws that can be applied to design problems and lead to technological advances in the subsystems.
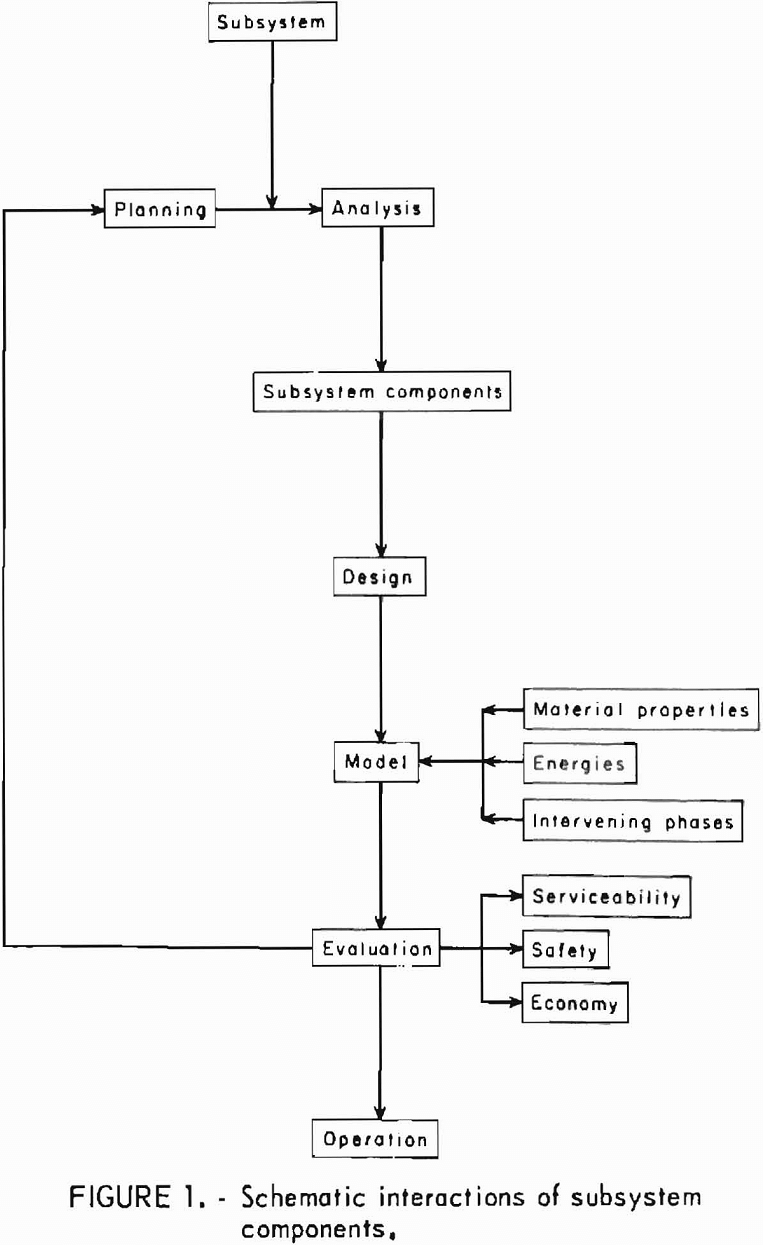
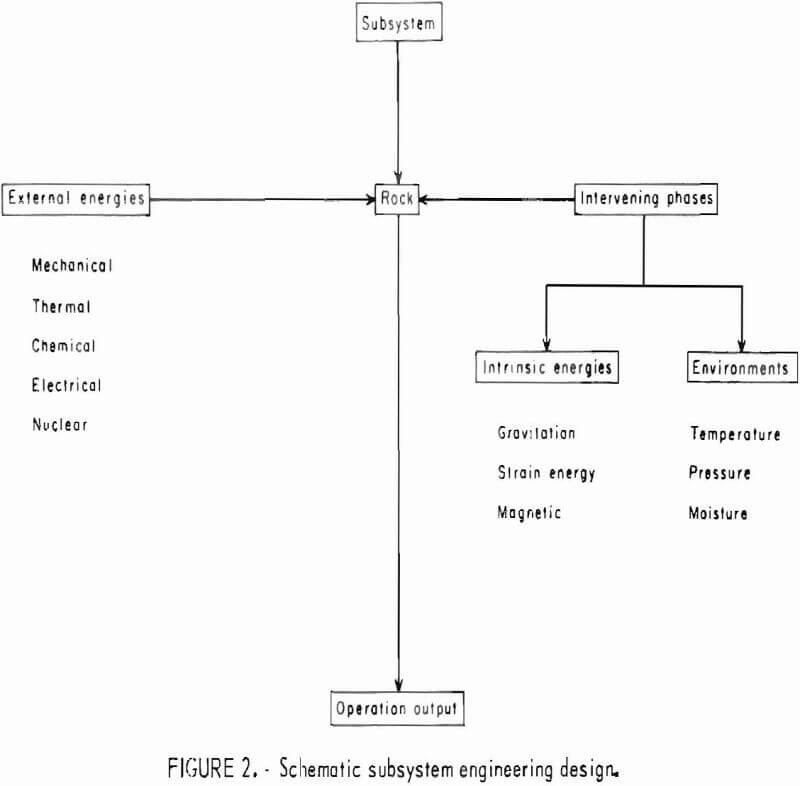
Within the intended scope of this text, three principal interrelated components in each subsystem of the mining system are rock, external energy, and intervening phase components. The intervening phase may be divided into two groups: Intrinsic energy and environments. The intrinsic energy includes gravitation and strain energy due to field forces, whereas moisture, pressure, temperature, radioactive radiation, etc., arc the environments.
The interactions of these three principal components give rise to the output of the mining subsystems. A schematic interaction of subsystem components is shown in figure 1.
Mining System Design
Mining system design involves planning and analysis of mining subsystems to satisfy functional, economical, and safety requirements during the development and exploitation of the mineral deposits. Two contrary approaches are involved in mine system design, at least in the subsystems of ground control, rock disintegration, and materials handling. On one hand, stability is strived for, and on the other, instability is desirable. In ground control, for example, gravity is utilized in a caving subsystem, whereas in the design for stability, the gravity inducing the body force must be counteracted.
Design for Stability
Design of rock structure for stability is similar in principle to that of structural engineering. After planning, the process primarily is going from the real problem to an idealization to seek the solution to the problem. In the analysis, the real structure is divided into components, and hence, a mathematical model is constructed. The magnitude, direction, distribution, and frequency of occurrence of the loads transmitted to each component are given or are estimated from the conditions under which the structure is to function. The configuration and dimensions of each member are then determined. Finally, the consequences of failure or unserviceability of the whole structure are examined so that the concept of safety is included in the idealization to provide a comfortable margin in the design.
Most difficulties encountered in the analysis of mining subsystems, however, are due primarily to the nature of the materials, the geometry of the structures, and environmental restrictions. For instance, excavation is made in a completely constrained continuum. The size and shape of the excavation change with the size and shape of the ore body, the preexisting environmental conditions, and the location underground; these conditions permit no choice. The loads transmitted over the body of underground structures or openings are body forces, tectonic forces, and occasionally seismic forces that in most cases are indeterminate. Under such conditions, the state of stress underground and the failure phenomena of rock are highly complicated.
Design for Instability
Instability implies failure; the meaning of the term “failure,” however, varies with the different subsystems. In the design for stability, failure is referred to as structural damage, or any action in the members that causes a member to cease to function satisfactorily. The action that results in structural damage is designated as the mode of failure, which, in general, falls into three classes: Elastic deflection, inelastic deformation or yielding, and fracture.
In the caving subsystem and the rock disintegration subsystems, failure connotes complete fracture or disintegration down to a certain size. In the materials handling subsystem, failure connotes a yielding to flow or movement under either an imposed energy or gravity at a critical angle of repose.
Design to achieve instability also faces formidable problems: High stresses are introduced in the process; geometry of the material is indefinable; loads are not exactly in the directions and locations assumed; and material properties are variables. In spite of these complications, a successful analysis is dependent upon idealizations and awareness of existing limitations between stability and instability of the material.
The sequential steps in the engineering design of a mining subsystem may be outlined as illustrated in figure 2.
Significance of Rock Properties
Although the ultimate objectives as well as the approaches to the problems of each subsystem previously mentioned are different, the underlying common factor of those subsystem designs lies in the rock materials and their behavior under external energies and Intervening phase components. Design engineers are concerned with choosing a mode of behavior of the material that assures stability or that causes failure so that a satisfactory design will result.
The behavior of material can be obtained from an engineering approach, that is, empirical experiments. For example, the mechanical behavior of a material is determined by observing the responses under applied forces and conditions for which the information about the behavior is required. However, such methods provide only an uncoordinated mass of facts that are good for limited purposes; the shortcoming is that the functional relations of broader validity are not established.
A more fundamental approach in research on the behavior of the rock material, therefore, has to follow a direction by which the concepts of the rock material can be developed and clarified. Such an approach requires a consideration of physical laws, the physical constitution of rocks, and their structural changes under the external energies and conditions. Essentially, the study of physical aspects, distinctive attributes, and characteristics that may be collectively called “properties” of the materials is obligatory.
Knowledge of material properties leads to a deeper insight into the nature of the real world and appreciation of possible engineering improvements. To accomplish our objective and to provide the guiding principles for future work that will advance the knowledge of rock mechanics, the classification of rock properties is a necessary step. This task cannot be achieved, however, without first viewing the underlying concepts of the material properties previously established as a guideline.
Theoretical Concept of Material Properties
The basic concepts of material properties of a crystalline or noncrystalline material are developed in parallel with the fundamental concepts of thermodynamics. Essentially, thermodynamics is a quantitative study of the relationships between changes in systems and the exchanges of energy associated with the system and its environments. The term “system” is regarded as a definite quantity of matter bounded by some closed surface; all else is the “environment.”
A system is classified as either homogeneous or heterogeneous depending on a physically distinct part of a system or phase. Hence, a homogeneous system consists of a single-phase continuum. When a mixture of phases is present, the system is heterogeneous.
The information pertaining to the physical characteristics and configurations describe the system and its state. The quantitative descriptions of state are regarded as state variables. For a given system, the values of the state variables may be independent of time or may vary with time. Hence, the system is said to be in thermodynamic equilibrium, or the system undergoes a process.
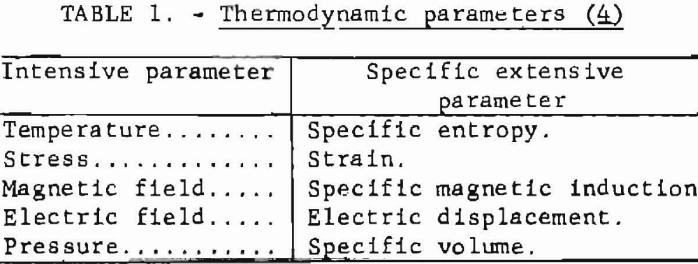
The parameters that specify the states of the system are intensive and extensive parameters. The intensive parameters are those that are closely associated with the environments and may be measured at the surface of the system. The extensive parameters are the parameters closely associated with the system itself. Each extensive parameter is a function of all the intensive parameters, but each intensive parameter has always its corresponding extensive parameter such that their product has the dimensions of energy. Significant pairs of the parameters are shown in table 1.
The functional relationship between a certain state variable and a set of other state variables is called “equation of state.” In thermodynamics, however, the term “property” refers to any observable characteristic of the system. Any quantity such as mass, pressure, volume temperature, or velocity is regarded as a thermodynamic property; thus, the state is the condition as identified by “properties” or state variables.
The systematic classifications of material properties are deduced from thermodynamics in the sense that the properties of a material are categorized to be. distinguishable from one another upon the basis of “reversibility” and the “states” specified by the relevant parameters.
Concurrently the definition of the material properties is developed, A specific relationship between two measurable physical quantities in respect to matter in a given state defines a material property; thus, the material property is a statement associated with the relationship between the influence and the effect by which those measurable quantities are broadly classified.
A generalization is made, as far as the material properties are concerned, by assuming
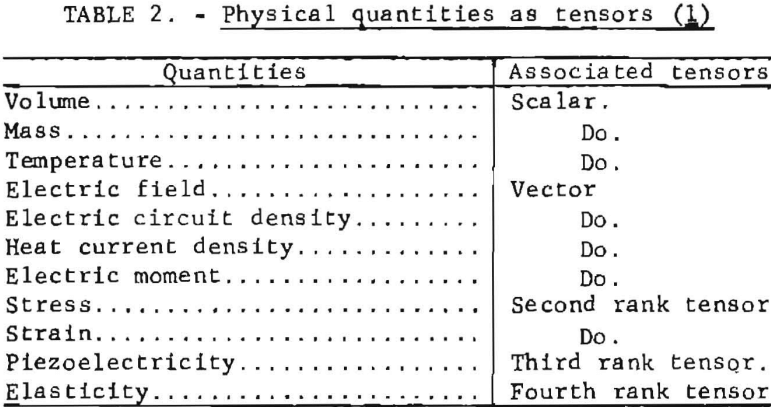
that all physical quantities are variables and all of them are simultaneously involved. A material is treated broadly as a collection of matter or a system. The properties of a system, however, must fulfill certain conditions in addition to being single-valued functions of the state. It is necessary that the function that defines the properties in terms of the relevant parameters shall be mathematically continuous and differentiable. To be recognized and designated as a parameter, each physical quantity requires a position and a reference frame in physical space. In the generalization, all physical quantities are then expressed in terms of mathematical entities called tensors for conciseness. Physical quantities as tensors are shown in table 2.
Thermodynamic Equilibrium System
A given system in a given state exhibits a tendency towards spontaneous change. However, when no process takes place (unless the external conditions are changed), the system is said to have reached equilibrium.
A mathematical relationship has been established such that an incremental change in the extensive parameter is directly proportional to the corresponding incremental change in the intensive parameter. The proportionality constants are the pertinent properties when the material is in thermodynamic equilbriura with its environment. Consequently, the pertinent properties are of two kinds: (1) The properties connect an intensive parameter with its corresponding extensive parameter, the so-called principal properties, and (2) the properties connect the intensive parameter with different kinds of extensive parameters. When the intensive parameter is connected with different kinds of extensive parameters, the properties are considered as the cross effects.
Steady-State System
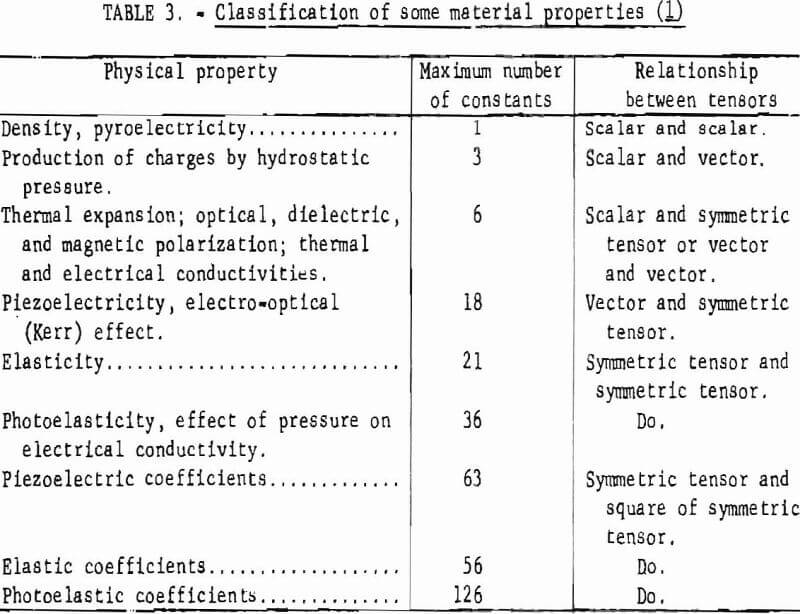
In the steady state, the intensive and extensive parameters are time dependent, and their values vary with the position. These parameters will have a gradient at every point in the system, and the gradients may induce a transport phenomenon of some quantity such as heat, mass, or electric charge. In the formulations of properties under this category, the authors are not concerned with the thermodynamic state of the system. The so-called steady state implies only that the steady rate of flow is taken into consideration. Since the magnitudes and the directions of the gradients producing the rate and the direction of flow depend on the properties of the material, the material properties thus exist in the relations between two appropriate physical quantities. Hence, the rate of flow is the extensive variable, whereas the quantity expressing the gradient, such as temperature gradient, potential gradient, etc., is the intensive or state variable. The quantities that relate the gradients to the flow rate for example, conductivities, resistivities, etc. are the properties of the materials in the steady-state system. The classification of some material properties is shown in table 3
System with Hysteresis
Sometimes the relevant parameters cannot be connected to one another by a unique functional relationship. Such a case happens when the system exhibits hysteresis; that is, the energy in the system is dissipated, and the property of the system is dependent upon its previous history. Quantitative evaluations of the properties in this class are relative and are dependent upon the tests performed as well as a previous history.
In view of the three foregoing system classifications, (thermodynamic equilibrium system, steady-state system, and system with hysteresis) material properties include mechanical, thermal, electrical, magnetic, acoustic, and optical properties. All these properties are collectively called physical properties. Each group of properties can be further classified and sub-divided into details according to the types and ranges of physical responses of the material when acted on by external influences. The concepts of material properties have been discussed in detail in the references listed.
Classification of Rock Properties for Engineering Purposes
Genetically, rocks are classified into three groups; igneous, sedimentary, and metamorphic. Igneous rocks are assemblages of different minerals derived from a molten mass and subsequently solidified. Sedimentary rocks consist of the consolidation of disintegrated and decomposed minerals often with the presence of voids and stratified layers. Under the influence of geothermic and tectonic activities, igneous and sedimentary rocks are metamorphosed to form metamorphic rocks.
Strictly speaking, rock is neither homogeneous nor isotropic. Inhomogeneity in rock frequently is discernible from its fabric, which includes voids, inclusions, and grain boundaries. Anisotropy in rock may arise from the preferred orientations of the mineral grains or microstructural discontinuities.
Macroscopically, rock masses may be separated by bedding planes, fissures, joints, and faults. Obviously, structural discontinuities always exist in the rock body at any scale. Since rock is an assembly of various phase constituents, a distinct problem is encountered in the study of rock properties when an effort is made to treat them systematically as is done with crystals and other engineering materials.
A volume of rock that forms a geologic body may be assigned to several scales or size ranges, namely, microscopic, mesoscopic , or macroscopic. However, such an assignment is rather arbitrary and depends on the scope of a particular investigation.
The Bureau of Mines study of rock properties at the Twin Cities Mining Research Center may be divided into two parts: (1) The study of a distinctive attribute and (2) the study of the responses to external disturbances. Hence, the behavior of rock can be considered on two levels; (1) The detailed mechanisms occurring between the elements of the assemblage and (2) the response of the assemblage as a whole.
The distinctive attribute is the internal geometric configurations or spatial data of the assemblage. Homogeneity and anisotropy can be identified from the spatial uniformity of the rock body at each scale of consideration. Once the order of the internal structure has been developed with the necessary characteristics, the influences of the structural details on the gross behavior of rock can be investigated.
The study of rock properties or the responses to external disturbances consist of idealization and observations of the behavior of real materials. The purpose of the idealization is to simplify the behavior and to formulate workable relations between the external energy and the response of a real material under various environments. The observations are made to assess the required quantities.
The quantitative study of rock properties is formidable if the formalism described under “Theoretical Concept of Material Properties” is rigorously followed. This formidability is due to the fact that the sets of constants established theoretically are only mathematical entities that lend themselves to mathematical manipulation. The constants established theoretically are not amenable to direct measurements. Therefore, the most practical approach is to obtain the appropriate property that can be gained at the expense of least effort and is sufficiently accurate or precise for practical application. These properties are simply a set of constants that are defined in such a way that they are easy to measure experimentally. Hence, in this manual rock properties are classified tentatively in two main divisions; Inferred properties and physical properties.
Inferred Properties
Inferred properties describe the characteristics, distinctive attributes, or the relationships of two or more measurable quantities obtained statistically or physically, although those quantities are not necessarily classified as influences and effects. Ultimately, Inferred properties may be related directly to the physical properties of the rock. The inferred properties presented in this text are further classified as shown in table 4.

Physical Properties
Physical properties are the set of constants in the relationships between two measurable quantities, that are recognized as influences and effects. Physical properties of rock can be divided into three main classes: Basic, mechanical, and nonmechanical.
Basic Properties
The physical properties that are the relationships between two measurable quantities and do not respond to a gradient are considered as basic properties (Bulk volume and porosity are not basic properties of rock; they are included in this category for convenience.)
Mechanical Properties
Mechanical properties are those properties concerned with the behavior of rocks under the influences of mechanical forces, which are solely the contact forces transmitted to the material body by push, pull, or surface traction.
Rocks always exhibit certain physical characteristics and interfacial phenomena at the exterior boundary, such as asperities, surface films, adhesion, absorption, and electrostatic effects. In addition, these characteristics give rise to the surface properties that are related to the bulk properties. The surface properties of rock for example, surface energy, coefficient of friction, hardness–are classified as mechanical properties from a practical standpoint.
Nonmechanical Properties
Nonmechanical properties are those properties concerned with the behavior of rocks under the influences of field forces. For clarity, these properties are further classified specifically as thermal, electrical, magnetic, acoustic and optical properties. However, acoustic and optical properties are not discussed in the. text at this time.
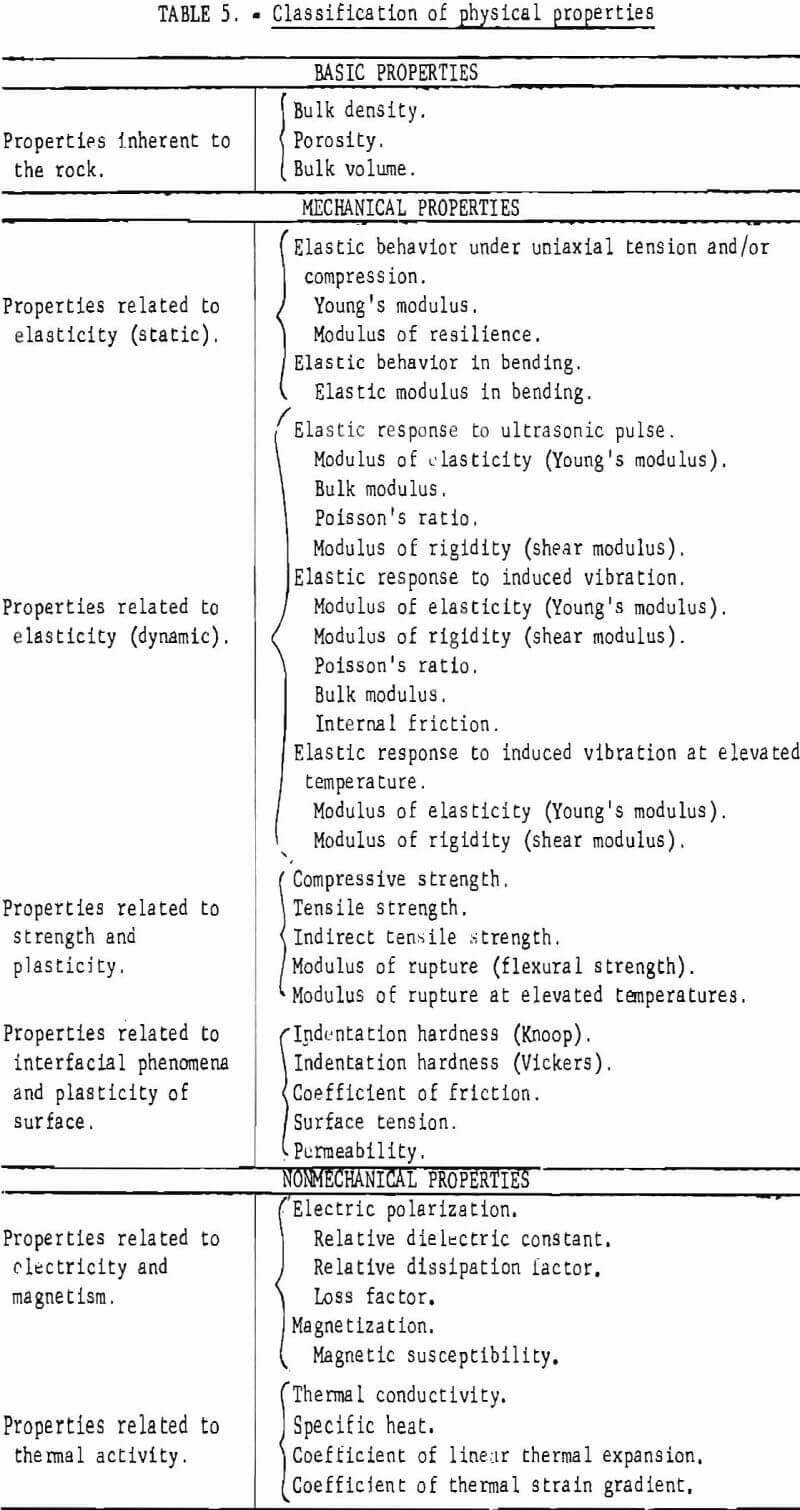
The physical properties presented in this text are classified as shown in table 5.
Section One-Inferred Properties
Attenuation Symmetry
Characteristics
Attenuation symmetry, rather than a property, is a systematic description of the manner in which energy attenuation varies with direction. With this method of obtaining the attenuation symmetry, the tendency for acoustic energy flow to favor certain directions in anisotropic material can be expected to produce an apparent attenuation symmetry due solely to elastic symmetry. It is believed, however, that this effect is small in comparison with the absorption and scattering in most rocks, especially at ultrasonic frequencies.
Applications
Attenuation symmetry, including the magnitude of the variation with direction, may be used in cause-and-effect studies in the same manner as that described for elastic symmetry and in references. Thus, attenuation-symmetry can be used in conjunction with a study of the fabric or of other physical properties in an attempt to establish useful correlations.
If the attenuation and elastic symmetries are the same within experimental error, it may be that one will give a better quantitative correlation (enable the prediction of magnitudes as well as symmetry) with other phenomena. For example, it seems probable that structural defects (such as systems of fractures, pores, and weak grain boundaries that can greatly affect ultimate tensile strength) would have a greater effect on energy transmission than on velocity. If so, variations in relative amplitude may be better than variation in velocity for predicting In tensile strength.
Quantitative analysis of the mechanical behavior of anisotropic materials is very difficult, and except in simple cases, the theory may not be developed for some time. In the meantime, this knowledge of the symmetry of the elastic and attenuation symmetry can be helpful in making qualitative inferences about the mechanical behavior of a material. In addition, the attenuation symmetry and the magnitude of the variations with direction can be usefully applied in problems involving the transmission of sonic or ultrasonic energy through either natural materials, such as rocks and minerals, or manufactured materials.
Specimen Preparation and Apparatus
See “Elastic Symmetry”.
Test Conditions and Limitations
Besides the limitations given in the section on elastic symmetry, several other factors affect the accuracy of attenuation symmetry observations. The amplitudes, now obtainable to only one or two significant figures, are greatly dependent on the coupling pressure. Thus, this pressure must be closely controlled, and all frictions, losses, etc., which could take place beyond the pressure gage, must be held to a minimum. Because insertion and exertion losses are not known, the absolute attenuation cannot be obtained. These losses vary with the type of grains (and their orientation) at the contact points and cause scatter in the data. These additional limitations make the observations of attenuation symmetry harder to Interpret than those of elastic symmetry.
There is also a limitation associated with the theory of wave motion in anisotropic materials- In general, the particle displacement vector, wave normal, and the direction of propagation of energy are not coincident in an anisotropic medium. With this method of obtaining the attenuation symmetry, this phenomenon can be expected to produce an apparent attenuation symmetry due solely to elastic symmetry. Though this phenomenon merits further study, it is believed that its effect is small in comparison with the effect of the high absorption and scattering losses in most rocks, especially at ultrasonic frequencies.
Analytical Procedure
The procedure uses spherical specimens and is the same as that given for elastic symmetry with the exception that the amplitude of the first peak is used rather than the arrival time. The amplitude measurements are conveniently taken at the same time that arrival times are measured.
For reasons given in the preceding section on limitations, the output of the pulser, all amplifier settings, the coupling pressure, and all other controllable experimental factors must be kept constant throughout the test. Preferably, both pulser output and amplifier gain should be high so that the same settings can be used on all rocks. Thus, a relative value of magnitudes could be established between rocks or between environments for one rock.
Data Reduction and Analysis
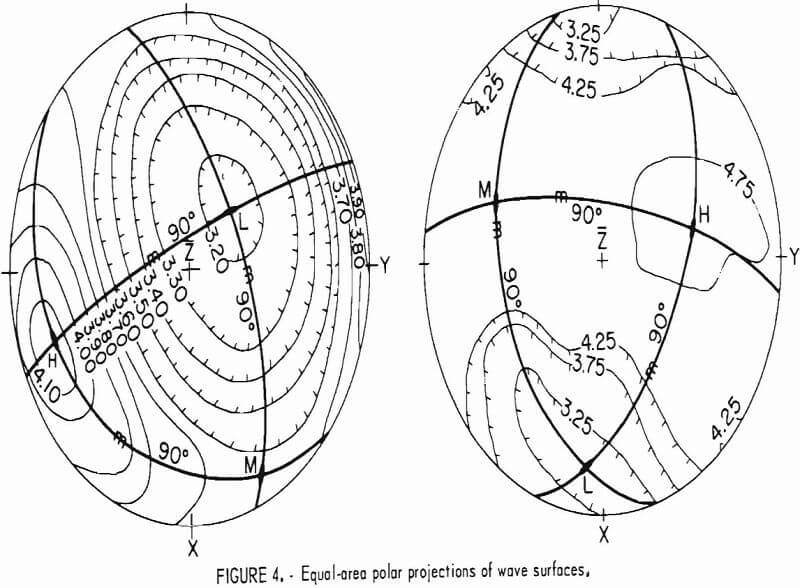
The relative amplitudes recorded in volts are plotted directly on equal- area polar projections. The procedure for contouring and interpreting the symmetry is like that given for elastic symmetry. The L, M, and H axes refer to the reference axes of lowest, medium, and highest amplitude, respectively.
Elastic Symmetry
Characteristics
Instead of being a property, elastic symmetry is a systematic description of the manner in which the properties of elasticity vary with direction when all possible transformations about a point are considered. (Symmetry in relation to rock is used in a statistical sense.)
The possible elastic symmetry systems for rock and the number of independent elastic constants associated with rock may be grouped as follows:

Since most of the fields of force that act upon a rock during its geological history are anisotropic and tend to cause preferred orientations of fabric elements, one would expect occurrences of the isotropic system to be rare. The isotropic system is placed in the “most likely to occur” column because it is convenient to use when the extent of anisotropy is very low.
Application
The use of ultrasonics on spherical specimens offers a convenient and direct method of determining the elastic symmetry of a material and its orientation within the material. In polycrystalline materials, especially rock, the elastic and other physical properties are effects of a usually complex internal structural fabric of the material. Since the cause-and-effect relationship between the various components (subfabrics) of the structural fabric and the elastic properties are not well understood at this time, a direct method of determining the elastic symmetry is almost imperative. The uses of elastic symmetry are given in two separate categories for convenience:
Direct uses in terms of elastic properties including velocity.
a. A prerequisite for reliable determination of the independent elastic constants from which the elastic properties can easily be determined for all orientations.
b. The symmetry of the velocity wave surface obtained expresses the symmetry of the elastic constant surfaces. For the orthotropic and transversely isotropic systems in which most rocks are classified at this time the elastic compliance modulus, S11-type surface, and the stiffness modulus, C11-type surface, will be very similar in appearance to the wave surface.
c. The average velocity obtained can be compared with average velocities computed from theory on the assumption that coupling between grain boundaries is perfect and that the individual grains have no more defects than the crystals used to obtain the single crystal values used in the computations Defects such as weak bonding between grains, and microfractures will lower the velocity and also affect other rock properties (especially tensile and shear strength). Thus, the ratio of measured to theoretical velocity, which is easy to obtain, should be an important factor in classifying rocks.
Making inferences about the fabric and other physical properties.
a. Several possible uses of this method are associated with Neumann’s principle: “The symmetry elements of any physical property of a crystal must include the symmetry elements of the point of the crystal.” In considering single crystals, this principle implies that relationships must exist between the symmetries of the various physical properties. In extending this principle to include the point groups of the fabrics of polycrystalline or amorphous materials where various structural subfabrics may exist, these relationships cannot be taken for granted, since the symmetry of one property may result from one structural subfabric, and the symmetry of another property may result from a different structural subfabric. For example, the arrangement of an accessory mineral, such as magnetite, in a rock may almost completely control the magnetic symmetry but have virtually no effect on the elastic symmetry. If any one of the other properties such as energy absorption and coefficient (or the ultimate tensile, compressive, and shear strength) is associated with the same structural fabric element or elements that control the elastic symmetry, a relationship will exist between the symmetry of that property and the elastic symmetry. The Bureau of Mines has found correlations between the symmetries of the elastic and absorption properties of many rocks. Correlation between elastic symmetry and tensile strength symmetry has been found in the five rocks tested for this purpose. In a few rocks, the velocity and the absorption symmetry differ; testing of the tensile strength symmetry in these rocks to see with which of these, if either, it correlates, may yield important basic information on rock physics.
b. Extending Neumann’s principle to rock and applying the general theory of elasticity, inferences can be made about preferred orientations (or lack thereof) of grains, pores, microfractures, or other defects. Comparing the experimental average velocity with the theoretical velocity can give very good insight as to whether the anisotropy is due to the orientation of the grains and pores or to such defects as microfractures. With the aid of confining pressure, it should be possible to largely remove the effect of microfractures and thus isolate the anisotropy that is due to preferred orientation of grains and pores. With variously sized spheres from one rock. It may also be possible to determine the approximate size of a fabric unit cell described in the list of definitions. This unit cell would then be the smallest volume that could be considered representative of the rock.
Specimen Preparation
The sphere-making technique starts with a rock core having a diameter 1/16 to 1/8 in larger than that of the desired sphere. The core is then cemented, on its side, to a board and core-drilled a second time in a direction perpendicular to the axis of the core. This process is repeated again in a third direction, orthogonal to the first two drilling axes. Edges or corners of the specimen are ground by hand until the specimen is roughly spherical in shape. It is then placed in the sphere-grinding machine and ground in several stages with progressively finer grinding components until finished. The machine can grind and polish spheres up to 8 in and has interchangeable grinding cups for spheres of different sizes.
In order to preserve unambiguously the initial orientation of the specimen throughout the sphere manufacturing process, a system of rectangular coordinates is designated in the specimen by drilling two very small holes of different diameter at right angles to each other. The holes permanently locate two reference axes and, perpendicular to these, a third axis. After the sphere is completed, a reference grid of meridians and parallels is carefully circumscribed on its surface with a two-circle goniometer to locate the positions, normally 73 directions, in which physical property measurements will be made. The spheres may be preconditioned to specific moisture-temperature environment or allowed to reach equilibrium at room conditions.
Apparatus
The apparatus has been described in the section of “Elastic Response to Ultrasonic Pulse” and in previous reports.
Test Conditions and Limitations
The specimen must be large enough to be reasonably representative of the parent rock mass excluding such things as field joints; often this is handled by stating that the smallest specimen dimension must be several times the grain or defect size. Perhaps a more suitable definition is that it must be at least the size of the fabric unit cell (“Definition of Terms”).
Analytical Procedure
The analytical procedure is the same as given in the section in “”Elastic Response to Ultrasonic Pulse” and in references 6-7, and 26. This procedure uses only the longitudinal pulse mode, and all measurements are diametral. The specimen holder on the acoustical bench is constructed so that the sphere may be rotated in 15° increments in a plane. Because the transducer-specimen contact is essentially a point, the insertion and exertion losses are large. Since the accuracy of this method is dependent on amplitude, the pulser and the amplifiers should be operated at or near their maximum capacity.
Data Reduction and Analysis
Elastic wave velocities are calculated by the relationship
V = dt-¹…………………………………………………….(1)
where d = the diameter of the sphere, and t = pulse transit time in the rock. Measured times must be corrected for instrument delays, etc., and these corrections are removed by calibrating the instruments with an aluminum standard of known traveltime.
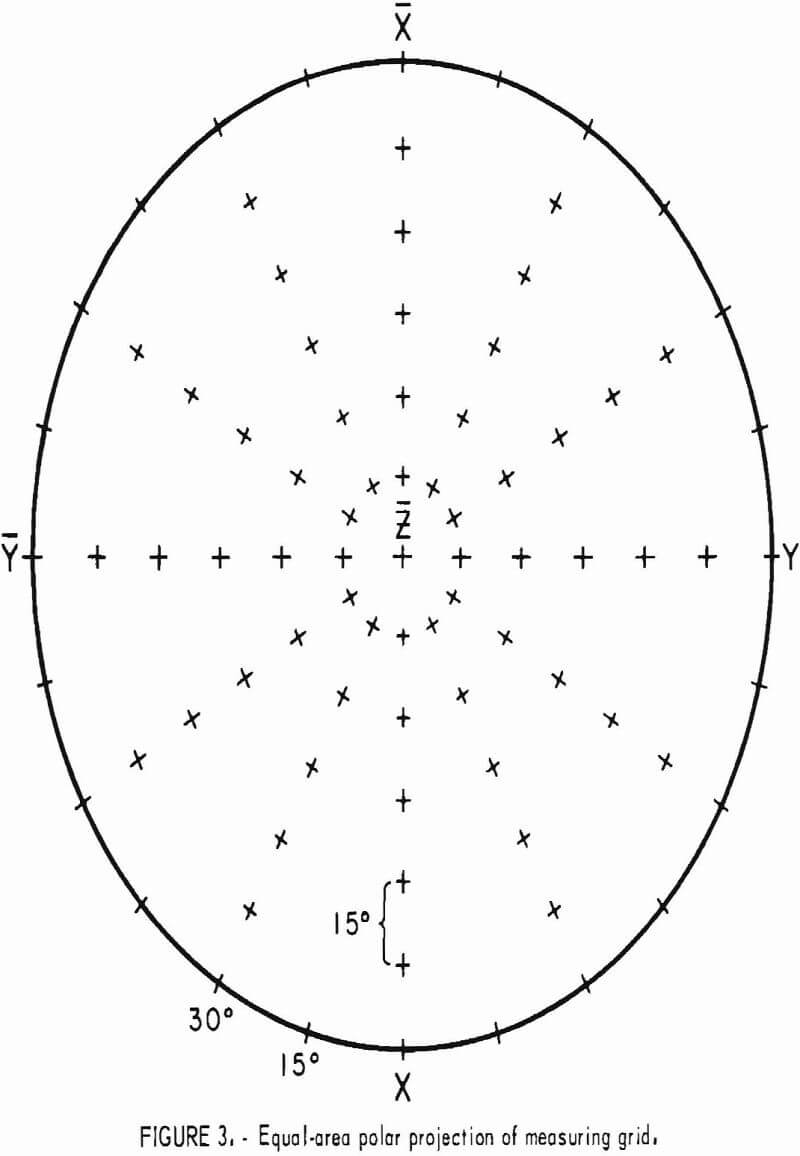
Velocities representing the wave surface for the 73 directions are then plotted on an equal-area polar projection of the lower hemisphere of the measuring grid (fig. 3) and contoured. An example of completed projection is given in figure 4. Since the wave surface possesses a center of symmetry, the upper hemisphere can be visualized by mentally projecting the lower hemisphere values through the center. When an axis of symmetry is located at the center of the projection, or if a plane of symmetry passes through it, the contouring is relatively easy. When no symmetry element coincides with the center, the whole process is much more difficult. In either case, the process is usually further complicated by inhomogeneities present at the laboratory scale. A good knowledge of symmetry concepts and of equal-area polar projections is a prerequisite for proper contouring and reliable interpretation. Symmetry concepts are given in any elementary book on crystallography. The use of equal-area polar projections is likewise given in various books; a text by Turner and Weiss is essentially recommended. All velocity surfaces have a center of symmetry. The axes and planes of symmetry that are associated with each possible symmetry system are given in tables 6-7.
In preparing the equal-area polar projections, the following symbols are used:
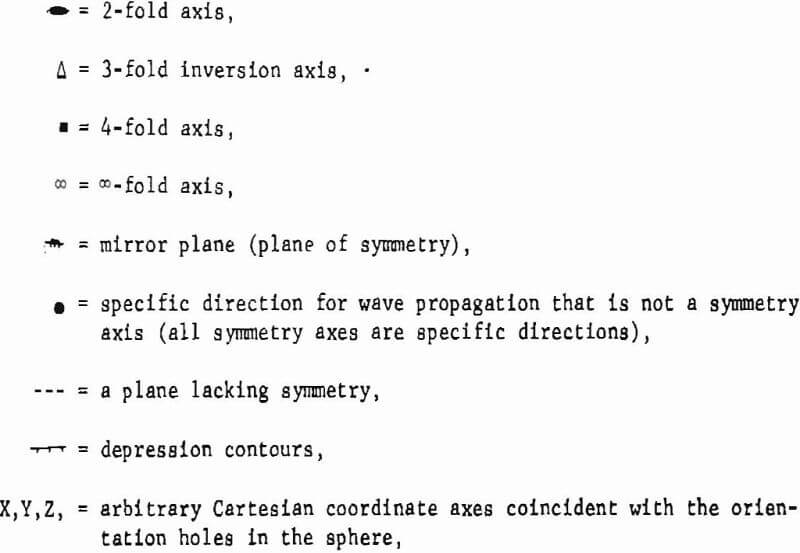
H = elastic reference coordinate axis of highest velocity,
L = elastic reference coordinate axis of lowest velocity,
and M = elastic reference coordinate axis of medium velocity.
For a better understanding of symmetry and the use of the symmetry symbols, see figure 5. The reference axes (L, M, and H) of the wave surface are analogous to the a, b, and c elastic coordinate axes of single crystals given in a previous report (7, table 2). Orientation conventions for fitting these axes
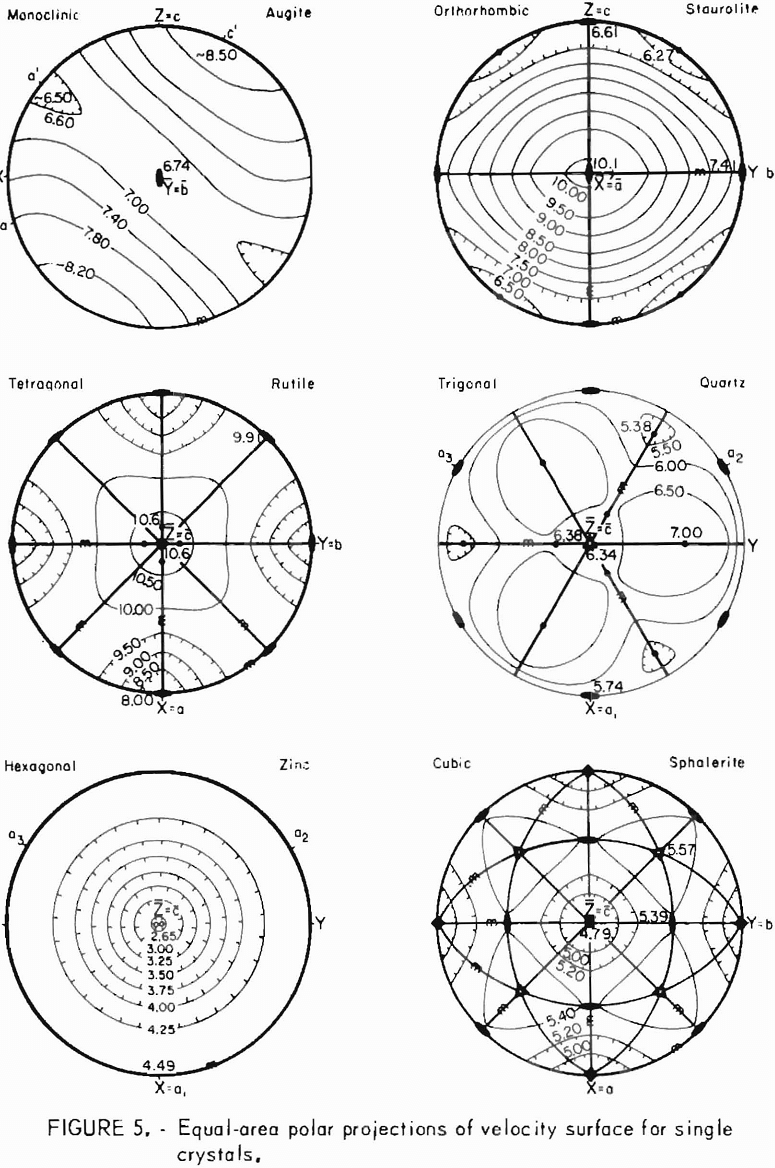
to a Cartesian , X1, X2 and X3 system are given in the next section, “Conventions,” and in a previous report by Bur. In the triclinic and monoclinic system, the L and H axes will include the directions of highest and lowest velocity. In the orthotropic and transversely isotropic systems, the H and L axes do not necessarily include the directions of highest and lowest velocity although they have in all studies made thus far. In the monoclinic system, only one of the H, L, and M axes will possess symmetry and coincide with the associated fabric symmetry axes. Thorough familiarization with references 4 and 7 is recommended for investigators intending to use this method.
The amount of anisotropy is given in terms of the velocity axial ratios
L:M : H……………………………………………………………………..(2)
normalized to the value along L. If higher or lower values exist than occur along the L and H axes, the maximum anisotropy can be given as
(Vmax – Vmin )/Vmin………………………………………………(3)
The repeatability of each individual measurement is usually well within 1 pct for a given environment. The accuracy with which the L, M, and H axes can be located will vary for each rock and has not been precisely determined; it is generally considered to be about one-half of the rotation interval or about about 7-½°.
Definition of terms
Anisotropy-Continuous variation of properties or fabric with rotation.
Attenuation symmetry-A systematic description of variation of acoustic energy attenuation with respect to direction.
Elastic constants-The constants relating to strains as linear function of stress.
Elastic symmetry-A systematic description of variation of elastic properties with respect to direction.
Fabric-The internal geometrical configuration of all the constituent rock elements, such as grain types, cleavages, pores, and microfractures.
Fabric unit cell-This will be defined in three essentially equivalent ways, all of which exclude the effect of field joints or other discontinuities
- The smallest volume of rock that contains the representative fabric of the parent rock.
- The smallest volume of rock that will give statistical homogeneity and possess statistical symmetry.
- The smallest volume of rock that can be expected to have bulk properties that are representative of those of the parent rock.
Isotropy-No variation with rotation.
Homogeneous-No variation with translation.
Neumann’s principle-“The symmetry elements of any physical property of a crystal must include the symmetry elements of the point group of the crystal.”
Neumann’s principle-For use with tensor, this principle can be stated as follows : “The components of a tensor representing a property will remain invarient under a transformation of coordinates governed by a symmetry operation valid for the structure under consideration.”
Point group-The symmetry elements of the fabric or properties that can be determined by symmetry operations excluding translations. (The point groups for the systems in rock are given in references.)
Statistical symmetry-The symmetry associated with a statistically homogeneous material or its properties in which case a symmetry operation will leave the description unchanged within a small error.
Statistical (or average) homogeneity-In terms of fabric, Paterson and Weiss define this term in this fashion: “The fabric of a body is statistically homogeneous on a certain scale when the average of the internal configuration in any volume element is the same for all volume elements with dimensions not smaller than the scale of consideration.” The size of the fabric unit cell would be the smallest possible scale of consideration.
Subfabric-The internal geometrical configuration of one type of fabric element in a rock; for example, the orientation of microfractures.
Symmetry elements-The center, n-fold rotation axes, symmetry, and reflection plane used in symmetry operations.
Symmetry operation-A linear transformation that leaves the appearance of the body or of analytical data unchanged.
Wave surface-The envelope of plane wave at a specified time, the waves having passed through the origin at t = 0. The wave surface is equivalent to the shape of a wave front expanding in all directions from a point source in an infinite medium.
Note: In classical theory, the preceding translations and transformations are referred to in terms of a point. In materials, however, this point must be allowed to have an area or a volume or dilemmas are soon encountered. If one could examine the unit cell of an ideal single crystal using a point that is much smaller than the unit cell, the crystal would appear to be inhomogeneous. If the point were the size of the unit cell, the crystal would appear to be homogeneous only for those translations that are multiples of the cell size. If the point covered many cells, the crystal would appear to be highly homogeneous. A similar examination of rock would yield the same result for a point smaller than the volume element. For a point equal to or larger than the volume element, however, the rock would be statistically homogeneous for all translations.
It could be argued that a special volume element is needed in layered rocks that would be similar to the one previously mentioned for translation along the layers and to the unit cell of a crystal for translations perpendicular to the layers.
In all cases, the symmetry of the unit cell or volume element is considered to be the symmetry of the material.
Orientation Conventions for Elastically Anisotropic Rocks
Characteristics
Conventions for orienting a set of Cartesian coordinates with respect to reference coordinate axes are based on the elastic symmetry of anisotropic polycrystalline or amorphous materials. (For further details concerning these conventions or the need for them, see Bur’s report.)
Application
The orientation conventions assure a consistent means of identifying the independent elastic constants of homogeneous anisotropic polycrystalline and amorphous materials. Their use by all workers in a field could avoid great confusion in future literature by allowing the experimental results of different laboratories to be directly compared without the use of tedious trans formations.
Specimen preparation and apparatus are not applicable in this discussion of orientation conventions.
Conditions and Limitations
These conventions based on the wave surface apply only to polycrystalline or amorphous materials. If used for single crystals, the results would be inconsistent with those obtained by use of the Institute of Radio Engineers (IRE) standards for single crystals, which are based on the morphology of the crystal, for the following reasons:
- For the monoclinic system, the directions of the elastic axes in the mirror plane and the size of the included angle will differ from the included angle. A similar problem can be expected in three dimensions for the triclinic system.
- The axial ratios of the elastic axes may differ from the axial ratios of the crystallographic axes. (Examination of single crystal data presented by Anderson and Liebermann and Simmons for many crystals, failed to reveal a consistent relation between the crystallographic and the elastic axial ratios.) For example, the shortest crystallographic axis may have the lowest, highest, or an intermediate velocity.
It is important to note that the first observation previously mentioned also applies between axes of the wave surface and axes picked on the shape of other elastic surfaces or fabric axes.
Analytical Procedure
The orientation conventions along with a complete description of the symmetry are given in table 6 for the elastic symmetry systems most likely to occur in polycrystalline and amorphous materials and in table 7 for the more unlikely elastic symmetry systems. The conventions closely parallel the IRE standards for piezoelectric crystals.
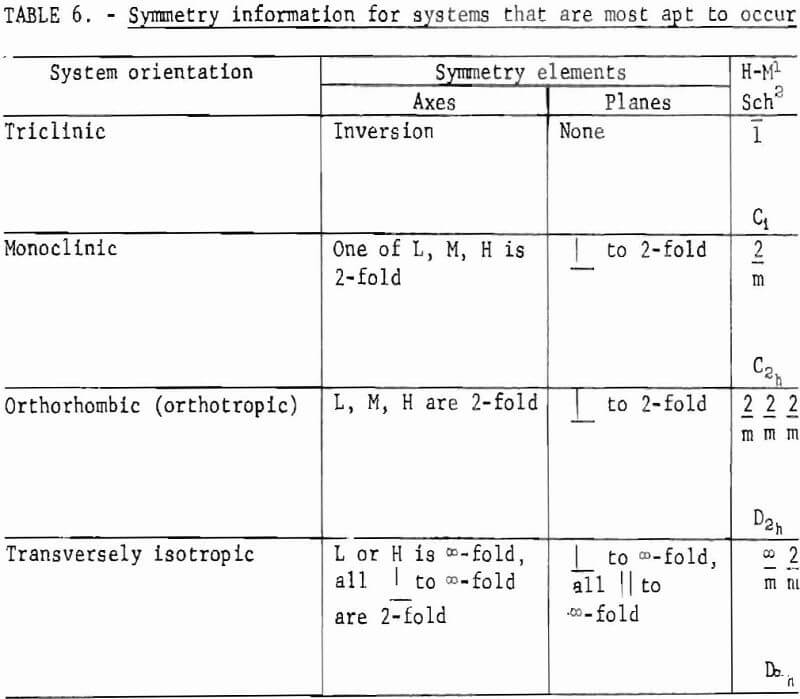
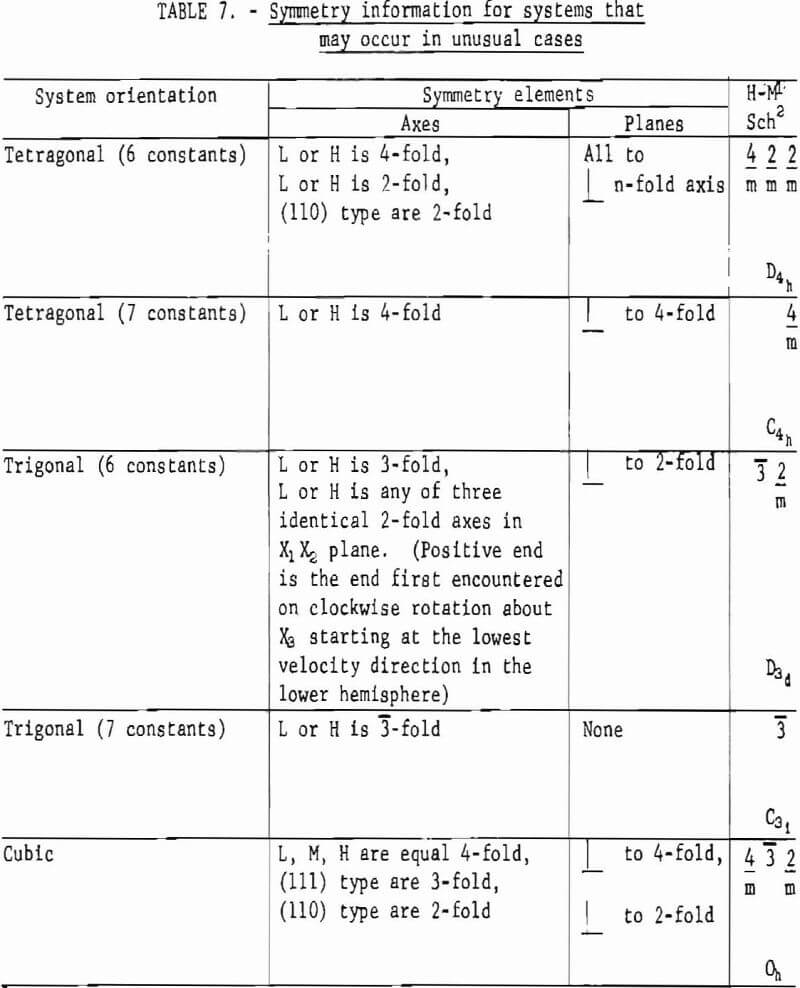
The recommended convention for each system is given in the first column of the tables, and supporting information is given in the second column. The symbols L, M, and H (low, medium, and high velocity, respectively) denote the reference coordinates obtained from the wave surface. The symbols X1, X2, and X3 denote the right-handed Cartesian system. The symbols α, β and γ refer to the angles between the coordinate axes of the wave surface: α equals the angle between the axis alined with X3 and the axis in the direction or the general direction of X2; β equals the angle between the axis alined with X3 and the axis in the X1 X3 plane; and γ equals the angle between the axes not alined with X3.
Properties Related to Petrofabric Homogeneity
Defect Frequency Orientation Analysis
Property
Defect frequency orientation (DFO) mode, defects/direction (azimuth).
Use of Property
Defect frequency orientation mode is used (1) to count the frequency of occurrence and orientation of microscopic discontinuities (defects) in thin section, in order to construct a two-dimensional diagram showing the variation of defect frequency with direction, and (2) to perform this analysis on three mutually perpendicular thin sections, chosen in such a manner that the DFO data can provide a measure of rock (fabric) anisotropy in three dimensions.
Specimen Preparation
See “Mineralogic Modal Analysis”.
Apparatus
See “Mineralogic Modal Analysis”.
Physical Conditions and Limitations
Each thin section is assumed to be representative of the population of all possible thin sections (family of parallel planes) parallel with a specific plane in the imposed three-dimensional reference system for describing the anisotropy of a given rock.
This analysis assumes that a set or sets of three mutually perpendicular thin sections represent a three-dimensional, solid model of rock anisotropv. In reality, the thin section set(s) represent(s) only three mutually perpendicular families of planes in a rock, as mentioned in the preceding paragraph. Since the nature of DFO’s is unknown in directions or planes not parallel with those principal planes of the reference system, it is assumed that such directions represent DFO’s that vary in uniform transition between adjacent principal planes.
Defects include the trace of closed and open microcracks and the trace of crystallographic discontinuities (for example, cleavage and twinning) that include grain boundaries. In general, defects have the approximate dimensions of the grain or small group of grains with which they are associated, or they may be some fractional length of these dimensions.
A basic assumption of DFO analysis is that defects are primarily planar features in most three-dimensional rock fabrics. Although less commonly defects may be lineations and points, an overall knowledge of the particular rock fabric will provide the necessary knowledge to interpret defects as lines or points in thin section rather than as traces of planes.
DFO analysis is most effectively carried out in rocks whose smallest grain sizes are no less than 0.1 mm (equivalent to U. S. Sieve series, mesh 18). In rocks with smaller grain sizes, each grain is a potential point defect; otherwise, fabric discontinuities tend to reflect larger anisotropic features that may be independent of the very small grains.
In rocks having a wide range of grain sizes (for example, Rockvillc Granite), a weighted average may be assigned to each defect. Thus, a large phenocryst would be given more weight because its defects could he much longer than those associated with smaller grains. This determination requires judgment by the petrographer in “weighing” the importance of defects. For example if one defect is judged to be twice the average length of all defects. Its orientation is tabulated twice rather than once. In rocks having a narrow range of grain sizes, weighting of defect lengths is not necessary.
Analytical Procedure
More than in all other microstructural techniques, DFO analysis is very much dependent upon the petrographer’s ability to judge the merit of each defect to be recorded. Merit is based on such criteria as mineral association length, spacing distance to adjacent defects, “average” grain size, and association with twinning, cleavage, grain boundaries, etc.
DFO analysis is performed on 1- or 2-in circular thin sections. The sections are held In the ring holder device for translating across the microscope stage with the mechanical stage and attached flexible cable drive mechanism (fig. 6). An arrow scribed on the glass slide holding the thin section designates the “zero-orientation” direction with respect to a three-axis coordinate system. This direction is set parallel with the front-back, manually-operated translation direction, Y, of the mechanical stage, and each orientation measurement of a defect is recorded in azimuth degrees clockwise from the zero direction.
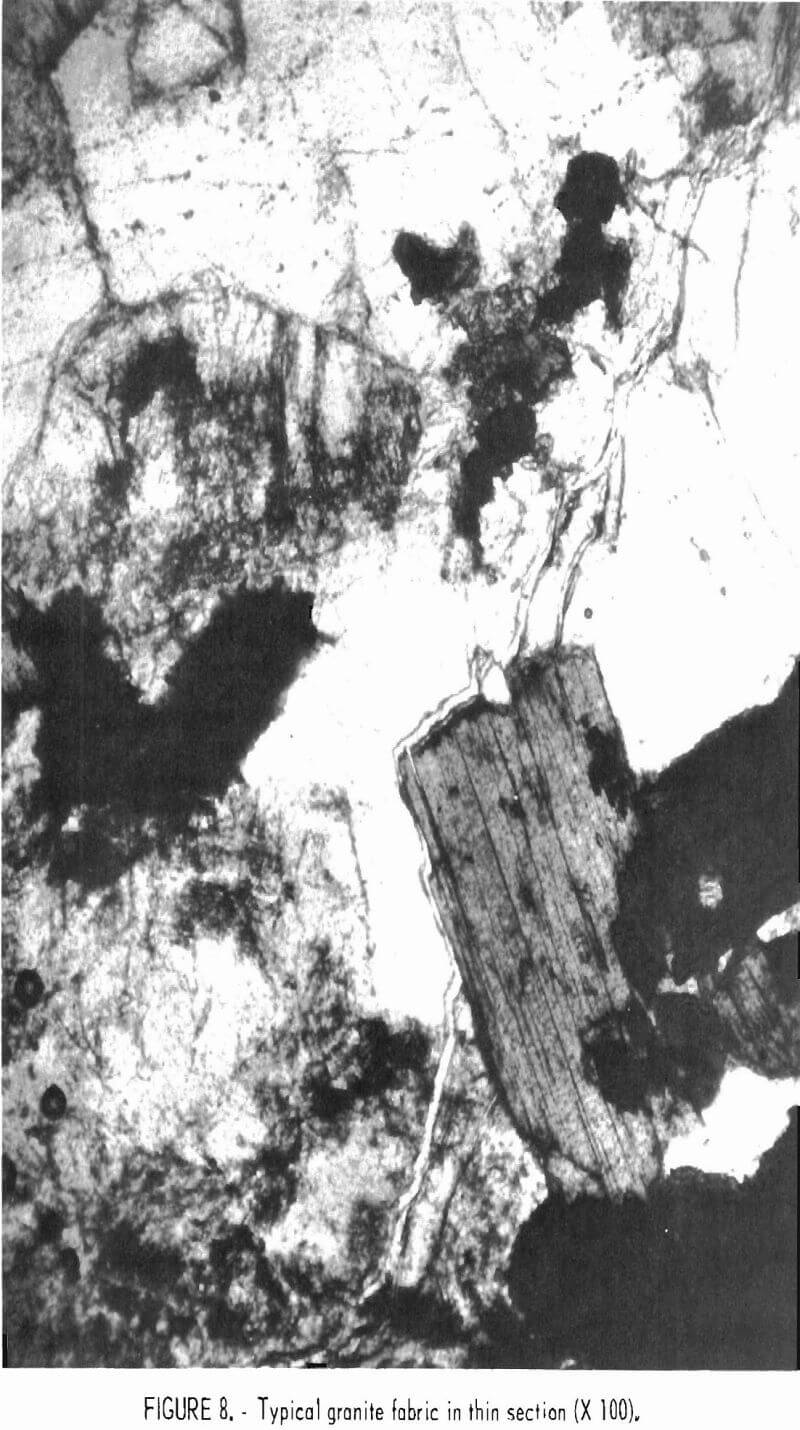
A series of parallel traverses is made across the thin section. In figure 7 each traverse line is composed of a series of microscopic fields of view (X 28) that slightly overlap. Each field of view is about 4 mm in diameter at that magnification. The slight overlap of adjacent fields of view is for reference purposes to assist the petrographer in translating a full field of view after all defects are counted and measured in the previous field of
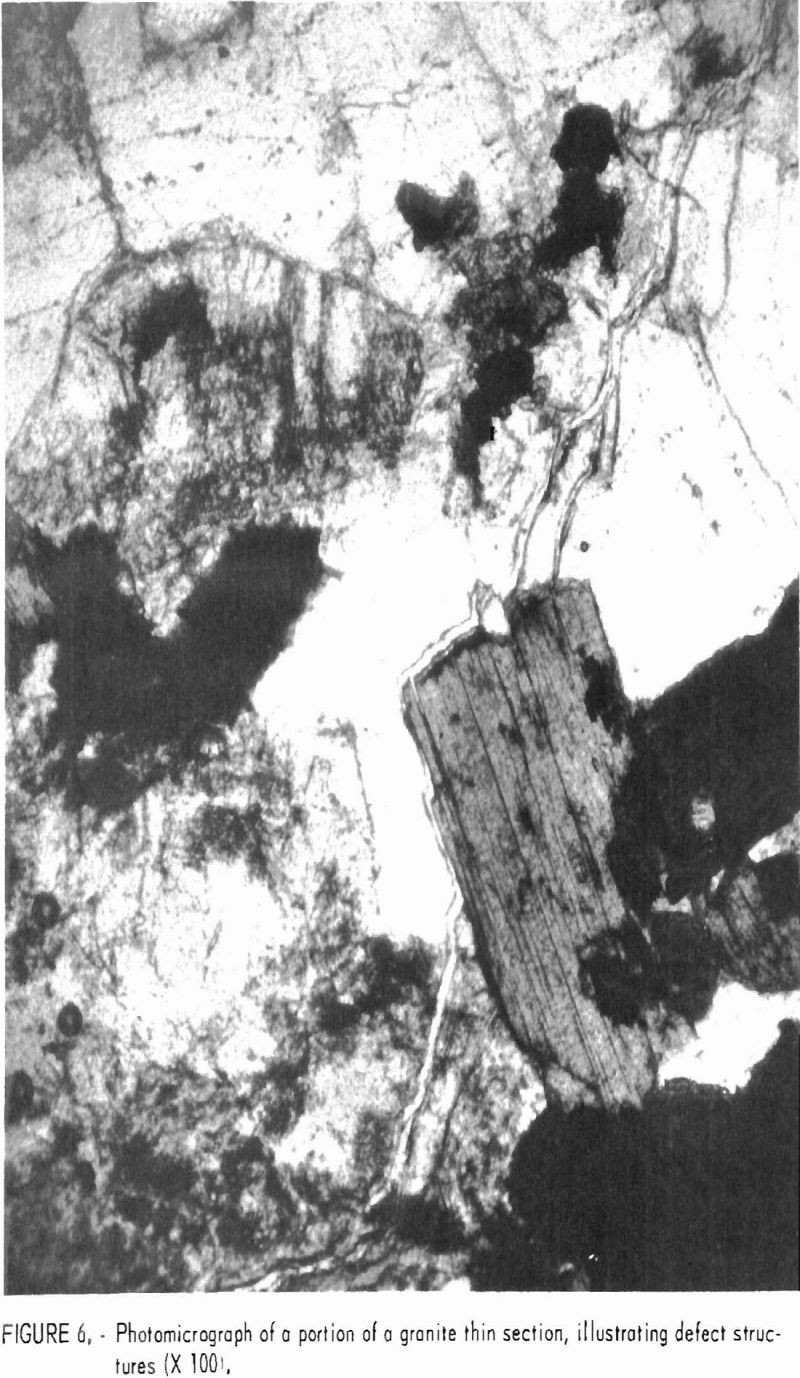
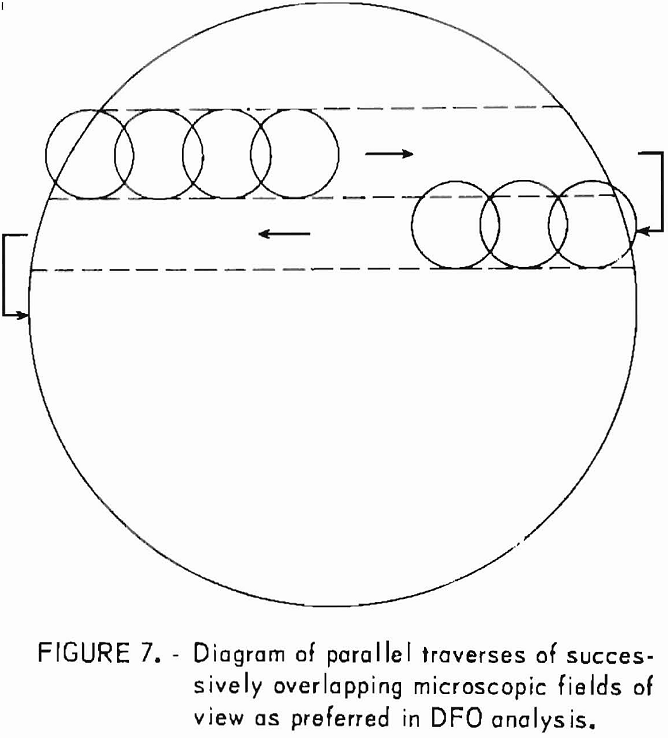
view. The experience and judgment of the petrographer are critical in selecting which defects in a field of view are to be counted and measured. Figure 8 illustrates such defects as cleavage, euhedral grain boundaries, twin lamellae, bubble trains, etc., as lines on the thin section. Each defect is, in effect, counted when its azimuth orientation is recorded on a tabulation sheet. A complete study of a 2-in-diam thin section consumes most of a man-day because a value judgment must be made for each measured defect. In general, 500 to 1,000 defects are measured on a 2-in-diam thin section, 200 to 500 on a 1-in section, and 150 to 250 on a standard thin section.
Further quantification of defect measurements may be made in the future by considering the length of each defect as well as its orientation. No work has been done on this task as yet, but the results could be useful, since larger defects are theoretically more influential in rock behavior than smaller ones for a given geometry, size of test sample, lithology, and grain size. Further, previous DFO studies have not been aimed at developing broad categories of measurement grouping; for example, in feldspar grouping, all feldspars with various types of defects associated with twinning, cleavage, and grain boundaries have been counted together rather than separately. Such smaller separate groups of counted defects could provide an estimate of the importance of the effects specific types of defects and/or mineral species have on the anisotropic structure and behavior of rock.
Data Reduction and Analysis
In typical Salisbury Granite, DFO analysis of a Y-direction, 2-in-diam thin section yielded 178 measurements of defects associated with quartz grains. The defects, all assigned to one group, included bubble trains, grain elongation, and microfractures crossing two or more adjacent grains. Each measurement corresponds to one defect; the measurement is an azimuth angle with respect to zero orientation estimated to the nearest 1° of precision.
Grouping these 178 defects into six equal angular intervals resulted in the following distribution of defect frequency orientations:

It is clear from the DFO groups that the greatest concentration of defect traces is parallel or subparallel to the zero orientation direction. Not so readily apparent is the fact that each defect direction is measured with a 180° sense of ambiguity, as indicated by two angular intervals representing each group, as shown above. Thus, it does not matter if the angular direction of a defect is recorded as 90° or 270° both angles refer to the same ambiguous direction. The direction may be somewhat analogous to an arrow with the head removed; the direction is unique, but the sense of direction is ambiguous.
In another rock. Barre Granite, groups of defects associated with the major mineral constituents were summed with respect to the aforementioned six angular intervals, and the results were compared with breaking strengths. The breaking strengths were calculated for a series of six disks, each loaded to failure along one of the six angles: 0°, 30°, 60°, 90°, 120°, and 150°. The comparison emphasizes the importance of DFO analysis in relating such micro- structural features as defects to the gross mechanical properties of rock:
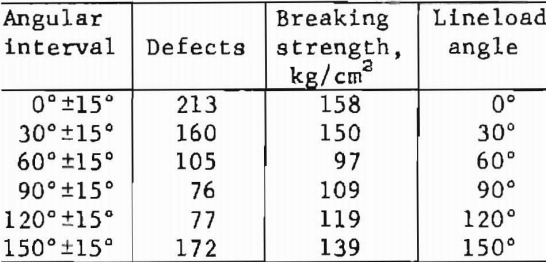
The data suggest that the direction of lowest breaking strength is approximately normal to the direction of most defects.
To eliminate the tedium and error in grouping and counting thousands of defect measurements, a “frequency count” program has been written in FORTRAN IV language for the computer at the Bureau’s Twin Cities Mining Research Center. The program has been debugged and has produced grouped results that have been verified by manually processed grouping.
The program requires that the computer scan an array of angle readings and keep a running total of frequency of observations for six 30° intervals: 345° to 14°, 15° to 44°, 45° to 74°, 75° to 104°, 105° to 134°, 135° to 164°. An array can include up to 1,000 angles, equavalent to 50 data cards, since each card can accept up to 20 angles.
Diametric Mineralogic Analysis
Property
Directional mineralogical mode, mineral percent/direction (azimuth).
Use of Property
The directional mineralogical mode is used (1) to determine the kinds and amounts of mineral constituents along any specified diameter of a circular thin section and (2) to compare the results with some property previously measured along the same diameter in a test sample from which the thin section was cut.
Specimen Preparation
See “Mineralogic Modal Analysis”.
Apparatus
See “Mineralogic Modal Analysis”.
Physical Conditions and Limitations
The technique is dependent upon carefully preserving, during the preparation of the thin section, its orientation to the test sample from which it was cut.
Each thin section diameter is assumed to be representative of the fabric and mineralogy along its corresponding diameter in the test sample. Although this is a safe assumption, It Is only approximately true because neither mineralogy nor fabric is exactly the same in one direction as in some other direction even if the other direction is parallel and slightly displaced from the one direction.
Analytical Procedure
The diameter to be traversed on a circular thin section is set parallel with the right-left translation direction of the mechanical stage. This direction is driven by depressing one or more keys on an electronic counter. The counter provides a petrographer with a rapid and efficient means of traversing the thin section and tabulating data along a traverse. The thin section is translated until an end of the desired traverse line coincides with the crosshairs intersection in the microscopic field of view; this position marks the start of the proposed traverse. Translation then proceeds along the diameter, and in the field of view the mineral grains appear to move past the crosshairs intersection.
The percentage of each mineral along the traversed diameter may be determined by either of two methods. In the first method, the traverse distance across each grain may be read directly from a millimeter scale associated with the right-left translation direction of the mechanical stage; distances can be estimated to the nearest 0.1 mm by a vernier scale. The aggregate distance across grains of each mineral species is summed; the sums of distances for all minerals in turn are summed for a total distance equal to the diameter across the thin section. The linear percentage of each mineral is easily computed by multiplying the sum of distances of each mineral by 100 and dividing by the total distance. This method is quite suitable for grains larger than 0.1 mm. For smaller grains, one must resort to a calibrated eye-piece scale by which distances of 0.01 mm (and somewhat less) can be estimated when magnification is increased from 28 to about 80.
In the second method, the electric counter is used to keep a running number total proportional to the sum of distances traversed across grains of each mineral. One counter key is assigned to one mineral for this purpose and rolls up a number total when depressed. Since the number total is not actual distance, it must be converted into distance by reference to the millimeter scale used in the first method, The counter also provides a running grand total number, which represents the sum of subtotals of all keys used in an analysis. At the end of a diameter traverse this grand total is proportional to the total traverse length (25 mm in a 1-in-diam thin section, and 50 mm in a 2-in section). This method is much more rapid and efficient than the first method because it uses more fully the capability of the counter to rapidly traverse a diameter.
Data Reduction and Analysis
The following examples illustrate the methods by which the percentage of each mineral along the traversed diameter is determined:
- Method 1.
100 (1.2 + 0.6 + 3.4 + 1.7 + 0.3 + 2.1 + 0.8)/50 = 20.2 pct linear (or directional) percentage. - Method 2.
Counter start No. 9,236 for a mineral
Counter end No. 10,341 for a mineral
Counter start “grand total” No. 81,623
Counter end “grand total” No. 90,035 (10,341 – 9,236) (100)
For the mineral: 90,035 – 81,623 = 13.1 pct along the specified diameter.
In typical Salisbury Granite, as a real example, diametric traverses across a circular thin section beginning at an arbitrary 0° diameter produced the following results that were compared with longitudinal pulse velocity, Vo:

These results show how such abundant data can be used in association with rock properties data measured in the same directions as the traverses.
Grain Elongation Analysis
Property
Grain elongation mode, average grain length/direction.
Use of Property
Grain elongation mode is used to measure grain size in rock as a function of direction in order to compare the result with some rock property measured along the same direction or with average grain size along some other direction.
Specimen Preparation
See “Mineralogic Modal Analysis”
Apparatus
See “Mineralogic Modal Analysis”
Physical Conditions and Limitations
Grain elongation analysis produces the best estimate of average grain size when the grain sizes of a rock are normally distributed with a small variance. If the variance increases, or the distribution is of some other order (for example, Chi-square, bimodal, etc.), average grain size has very little meaning. Most rocks are somewhere between normal and nonnormal in grain size distribution; Yule Marble and Sioux Quartzite, for example, have a normal grain size distribution
Although the application of grain elongation analysis has been restricted to a specific direction In a thin section, as just stated in “Use of Property,” the technique can be extended to planes or volumes in any rock by making, a series of parallel traverses across a thin section, as in the standard modal analysis, to obtain the average grain size of the rock. As with modal analysis, care must be taken to establish that the thin section is reasonably representative of the rock material.
Analytical Procedure
The size of each grain is defined as the distance between its boundary intercepts along the specific traverse direction. In present applications of this technique, the traverse direction is considered to be a diameter across a circular thin section cut normal to a core axis and represents some previously measured directional physical property such as longitudinal pulse velocity or load at failure.
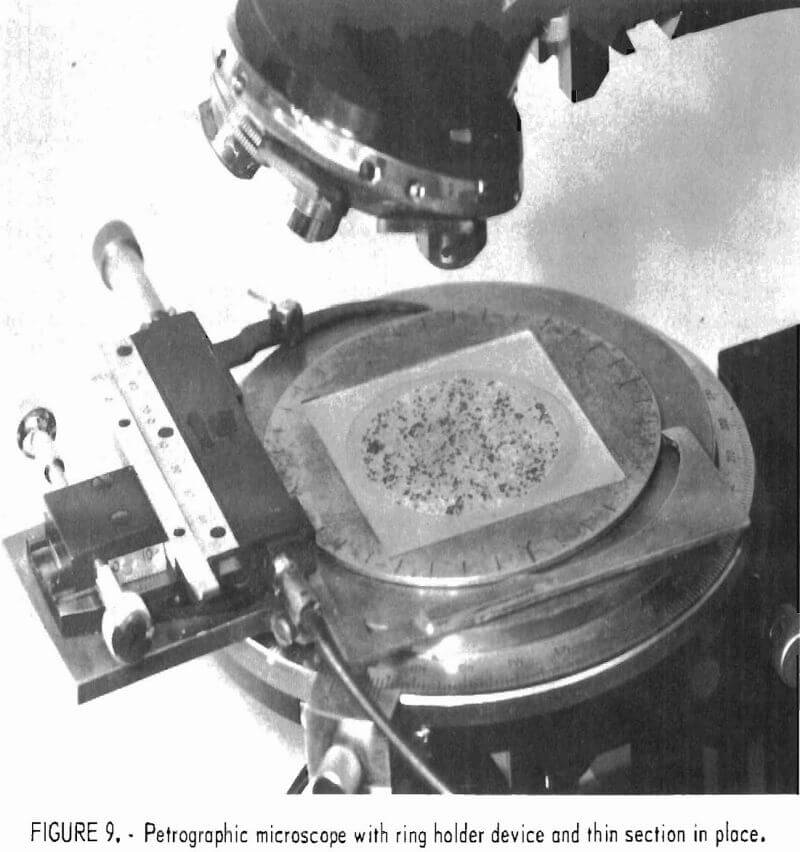
Only two sets of readings are necessary. One set includes the start and finish readings at both edges of the diameter; from these readings the diameter length is easily computed to the nearest 0.1 mm by a vernier scale. The readings are obtained by setting the diameter parallel with the right-left translation direction of the mechanical stage, which has a millimeter scale capable of recording translation distances up to 55 mm (two sizes of circular thin sections studied to date have diameters of about 25 and 50 mm). The right-left translation direction is driven by a flexible cable from an electric counter, and because of this arrangement, a traverse can be made across a 2-in-diam thin section in about 5 min at full speed (about 4 x 10 mph). The counter is activated by the operator’s right hand, and any one of the counter keys may be depressed to drive the thin section past the cross-hairs in the field of view. Circular thin sections mounted on square glass slides are inserted in the ring holder device (fig. 9); standard petrographic sections are inserted directly in the jaws of the mechanical stage.
As the thin section is driven across the field of view, the operator depresses a key on another counter with his left hand each time any mineral grain is traversed. Thus, the total number of intercepted grains will be recorded when the traverse has been completed.
Data Reduction and Analysis
As a hypothetical example, if 125 grains are counted along a 50-mm diameter, the average grain size is 0.4 mm. In two real examples, the average grain size measured on several thin sections of Yule Marble was about 0.3 mm normal to foliation and about 0.4 mm parallel with foliation; the average grain size measured on several thin sections of Sioux Quartzite was about 0.18 mm normal to bedding and about 0.23 mm parallel with bedding.
A comparison of average grain size with a physical property, directional breaking strength, from six Brazilian loaded disks of Yule Marble, is illustrated in the following tabulation:

The higher breaking strengths are clearly parallel with foliation planes in Yule Marble. Since average grain intercepts are larger in the direction parallel with foliation, grain elongation is essentially parallel with higher breaking strength directions.
Macrogrid Analysis
Property
Mineralogical surface fracture mode, mineral percent/cm² of fracture surface.
Use of Property
Mineralogical surface fracture mode is used to determine the kinds and amounts of all identifiable minerals on any smooth or rough rock surface
- for comparison with results obtained by standard petrographic analysis and
- to reveal any tendency of experimentally induced fracture surfaces in rock to include unusually large or small amounts of its mineral constituents.
Specimen Preparation
See “Mineralogic Modal Analysis”.
Apparatus
See “Mineralogic Modal Analysis”.
Physical Conditions and Limitations
The accuracy of this technique depends chiefly upon the petrographer ability to identify each mineral occurring at intersections of the superimposed macrogrid. Since any large surface is difficult, if not impossible, to examine on a microscope stage, a simpler magnifier, such as a binocular microscope with a long working distance or a hand lens can be of some help. However, the petrographer should be able to identify all the principal minerals of the rock on sight before he attempts this technique.
The petrographer’s ability to identify each mineral grain depends, in turn, upon his eyesight (natural or corrected) and upon the average grain size. If his eyesight is excellent, and if illumination of the surface is carefully controlled, he should be able to analyze a surface where the average grain size is about 1 mm or greater.
The spacing of grid lines in the macrogrid overlay should be approximately equal to the average grain size of the rock surface to be analyzed. The spacing may be several times this size, however, if great accuracy is not needed. In practice, a spacing of 3 mm seems to be adequate for most medium- to coarse-grained rocks.
Analytical Procedure
A transparent sheet with scribed grid lines of predetermined spacing is placed randomly on the rock surface to be analyzed. The surface may be smooth and flat, such as a lapped surface, or rough and irregular, such as a natural fracture surface. One count, recorded on a manually operated counter, is given to each occurrence of a specific mineral at a grid intersection. All grid intersections superimposed on the rock surface are examined in this manner; the mineral subtotals and the total counted intersections are recorded on a counter capable of summing the subtotals and grain total. The area (volume) percentage of each mineral in the rock or the area percentage alone on the fracture surface Is therefore easily computed.
Data Reduction and Analysis
If 450 grid intersections overlay a rock surface and if grains of mineral “X” occur at 150 intersections, then that mineral is presumed to occupy 33 pct of the surface area of the rock. This technique has been applied to fracture surfaces in a series of point-loaded Salisbury Granite disks to see whether any tendency for fracturing to include unusually large or small amounts of any mineral was reflected in breaking strength variations. In this study, the surface percentage of each mineral was comparable with its volume percentage obtained by standard petrographic modal analysis, and therefore its variations in breaking strength appear to be independent of mineral distribution. Moreover, the area percentages of each mineral are similar in different disks at different fracture orientations, and hence the rock appears to have a more- or-less homogeneous distribution of minerals.
Mineralogtc Modal Analysis
Property
Mineralogical mode, mineral percent/cm³ of bulk material.
Use of Property
The mineralogical mode is used to determine the kinds and amounts (volume- and/or weight-percent) of mineral constituents in a rock by which to assign the rock a descriptive name.
Specimen Preparation
Thin sections are mounted on (1) standard (26 by 45 mm) glass slides, (2) on 1-½-in-sq slides, or (3) on 2-½-in-sq slides. Slides 1-½- or 2-½-in square are used for mounting sections cut normal to axes of AX and NX cores, respectively. The standard-sized slides may be inserted directly in the jaws of the mechanical stage, but the square slides, because of their uncommonly large dimensions, are inserted in a ring holder device that is held in the jaws of the mechanical stage (fig. 9).
Apparatus
The two basic items of equipment for determining the standard mineralogical mode are the petrographic microscope and the Polaroid industrial camera. The microscope and essential accessories are arranged as in figure 10.
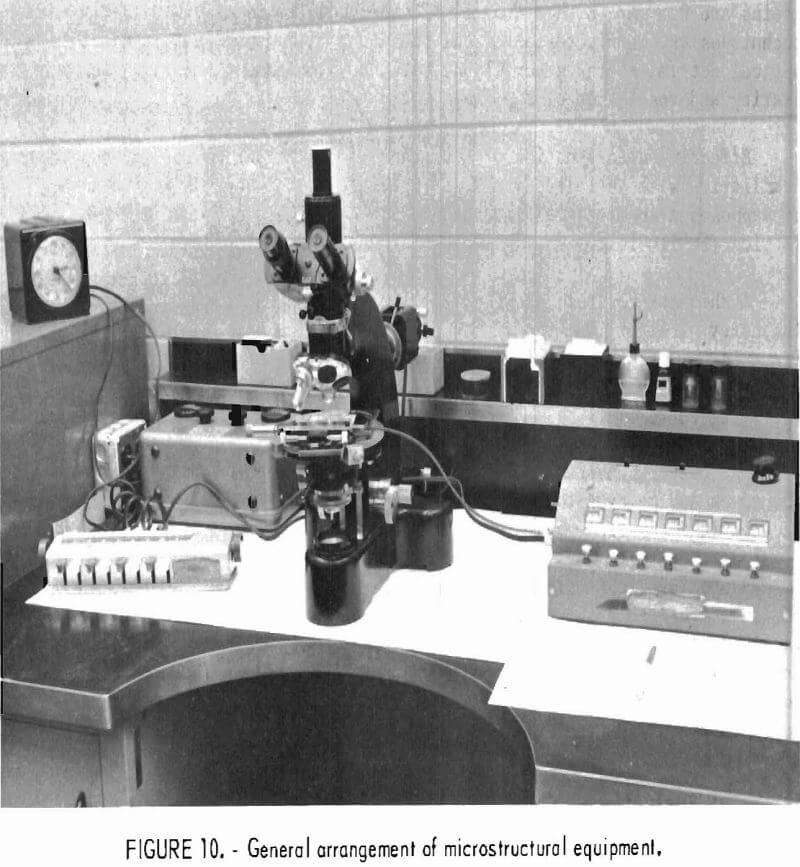
In figure 10 the ring holder device is in place on the microscope stage, in the jaws of a mechanical stage. A flexible cable from the electric counter (right side of fig. 10) is attached to the right-left screw shaft of the mechanical stage for transferring the power to drive the mechanical stage, the stage with ring holder and thin section can then be driven back and forth in the right-left direction at the will of the operator. When viewed through the microscope, the crosshairs intersection appears to be “traveling” across the field of view containing an image of a magnified portion of the thin section.
A manual counter for tabulating grain counts of minerals or points, particularly in techniques 1-3 as listed previously, is shown in the left foreground of figure 10.
Most frequently in microstructural study, X 8 eyepiece and a X 3,5 objective (N.A. = 0.10) are combined to give a low magnification field of view X 28 Less frequently, a X 10 objective (N.A. = 0.25) is inserted to provide X 80 magnifications for fine detail not satisfactorily clear under X 28. These two levels of magnification are adequate for studying rock sections whose smallest grains are 0.1 mm. Either crossed or uncrossed Nicols are used freely in all techniques at the discretion of the operator. Image contrast or specific optical determinations generally dictate the arrangement necessary for maximum clarity and resolution of the image.
Effective determination of the standard mineraloglcal mode presupposes familiarity with petrography and petrographic techniques, which, in turn, presupposes a knowledge of mineralogy, optical mineralogy, and petrofabrics.
A rheostat control, shown in the left background (fig. 10), regulates the intensity of light from the microscope light source for either transmitted light in thin section work or reflected light in polished section or surface work. In general, the light intensity is produced from a 5- or 6-amp optimum operating current.
The electric counter, shown in the right foreground (fig. 10), should be turned on and allowed to “warm up” for 5 to 10 min before use In order that the driving mechanism may operate efficiently.
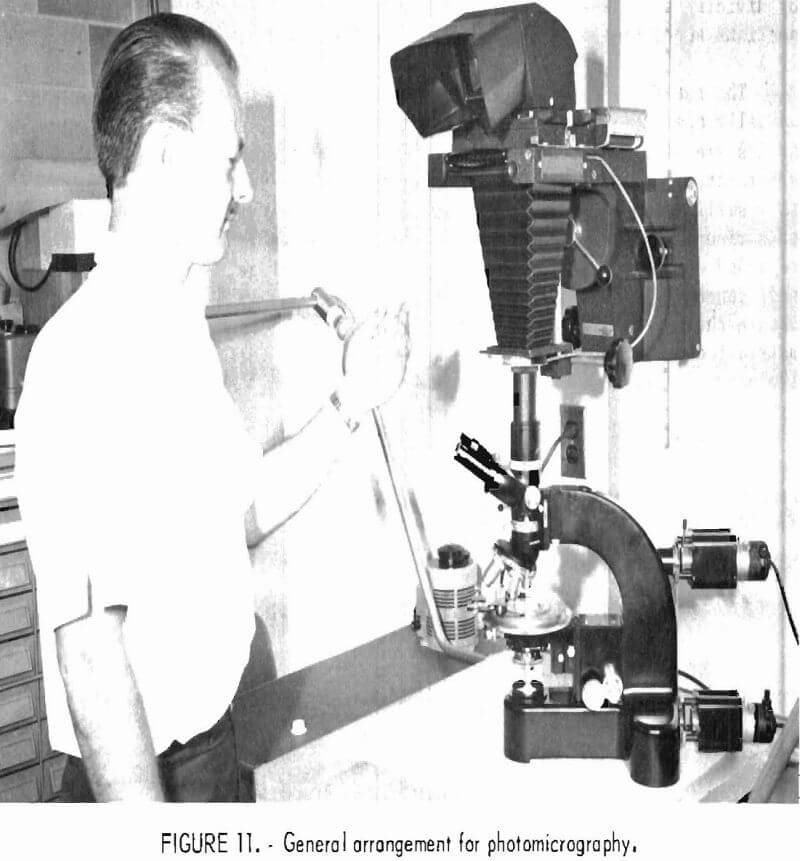
Photomicrographs are readily made by placing the microscope with its monocular tube extension under the Polaroid industrial camera as illustrated in figure 11. Most results are recorded with Polaroid PN-55 (print and negative) sheet film with a speed of ASA 50. Diaphragm and timer settings are dependent upon light intensity received on the ground glass screen, but in general, for an average thin section (not too transparent and not too translucent), F/8 and 1/8 sec is a useful setting.
The Polaroid industrial camera may be used also for photographing rock samples and other miscellaneous small items on the wooden base with object illumination provided by four inclined flood lamps. Part of this arrangement appears in figure 11.
Physical Conditions and Limitations
Average grain size should be greater than 1/16 mm (- 62.5 μm) for satisfactory application of this technique. In general, very fine-grained igneous or metamorphic rocks and clay size sedimentary rocks are not satisfactory, although the technique can be applied to them at the expense of considerable effort.
The thin sections chosen for modal analysis must be reasonably reliable representatives of some population of possible thin sections. This population could represent a rock mass of geographic, outcrop, hand, or test sample dimensions.
Analytical Procedure
A thin section (if of standard size, mounted on a glass slide, 26 by 45 mm, and standard thickness, 0.03 mm) is inserted in the jaws of a mechanical stage or, of of irregular size, in a ring holder device (fig. 9). The
mechanical stage is attached to the rotatable stage of a petrographic microscope. Illumination and focus are adjusted for maximum resolution. Assuming that the operator can readily identify the minerals present in the thin section or polished section (an assumption based upon preliminary optical study), the thin section is placed at some arbitrary position under the crosshairs, usually along an edge or corner of the section. The operator then proceeds to tabulate or count the occurrence of any mineral appearing at the crosshairs intersection as the section is translated across the microscope stage at repeated, small distances. Thus, if the increment distance chosen is 1 mm, the mineral occurring at the start and finish of that increment is recorded. A series of increment distances constitutes a traverse across the section, and a series of parallel traverses covering the entire section provides the input counting data for modal analysis. The increment distances along a traverse and the parallel traverses represent an imaginary grid superimposed on the section.
The mineral noted at a grid intersection is given a count of one, and the counts are summed as a running total while the section is being traversed. The percentage of grid intersections occupied by a given mineral is computed by dividing the number of points counted by the total number of grid intersections superimposed on the section, and then multiplying by 100.
The readings or counts for each mineral may be made easily with a manually operated counter. The sum of the number of counts for each mineral is its frequency of occurrence. The frequency of occurrence is converted into a percentage of the total thin section area, which is regarded as equivalent to a small volume of the rock. Therefore, to obtain the volume percentage of each mineral, its area percentage as based on a number of counted points is regarded as being identical with its volume percentage. The theory behind this concept has been established and is universally accepted. To obtain the weight percentage of each mineral, the volume percentage is multiplied by the specific gravity, and all results are recalculated to 100 pct.
Movement with the mechanical stage is required to traverse the thin section (or any other sample type) under the crosshairs from one distance increment to the next. In general, about 150 to 200 distance increments should be made for a standard thin section, 200 to 500 for a 1-in-diam thin section, and 500 to 1,000 for a 2-in-diam thin section.
Data Reduction and Analysis
A rectangular grid of 1,000 intersections covers a thin section of typical Salisbury Granite. The counts, C, for the following minerals (or mineral groups) and their equivalent volume percentages are as follows:

Standard Petrofabric Analysis
Property
Mineralogical deformation factor, three-dimensional orientation angles, Φ and p.
Use of Property
Mineralogical deformation factor is used (1) to measure the orientation of planar surfaces of discontinuity and linear fabric elements in a rock fabric and the orientation of certain optical properties in minerals of that rock fabric, all in relation to the plane of the thin section that is basic to this technique; (2) to use a universal stage attached to the petrographic microscope for obtaining these measurements; and (3) to generate orientation data by this technique for input on equal-area projections, which, in turn, can provide a graphic display of the data for statistical analysis and correlation with property data.
Specimen Preparation
See “Mineralogic Modal Analysis”.
Apparatus
See “Mineralogic Modal Analysis”.
Physical Conditions and Limitations
The universal stage is designed to accommodate petrographic slides (thin sections) most commonly of standard dimensions (26 by 45 mm). Although sections with smaller dimensions can be accommodated in the stage, larger sections cannot, such as the 1- or 2-in-diam sections mounted on 1-½- and 2-½-in-sq glass slides.
Extreme care must be taken to insure that the orientation of the thin section is known with respect to the sample of rock from which it was cut and to the measurements made on it when inserted in the universal stage. This three-dimensional orientation framework must be maintained in making the thin section, with respect to some common reference direction and to the correct “top and bottom” of the thin section. Furthermore, care must be taken to insert the section “right side up” in the universal stage, or else the petrographer will produce a set of erroneous orientation measurements.
In standard petrofabric analysis especially, as well as in other micro- structural techniques, the thin section must be representative of all possible thin sections cut from a test sample with specific orientation requirements for both the thin section and the sample.
At least 150 to 200 or more orientation measurements must be made on a standard thin section to supply enough data for subsequent statistical analysis. The number of measurements is also a function of grain size and number of separate mineral species in a given rock. In general, for each mineral, grain size is inversely proportional to the number of needed orientation measurements.
Some preliminary study of the petrography and general fabric characteristics of a rock is necessary before attempting U-stage work. Minerals must be known and identifiable, and the optical features of each mineral and the essential fabric features must be selected for measuring before U-stage work begins. Of course, not all features may be measured in detail because the petrographer may be interested only in those optical or fabric features that in his judgment have some first-order relation to a physical property. On the other hand, one or more factors may be added to the analysis in progress if a preliminary list of features to be studied has failed to include an important one overlooked in preliminary study.
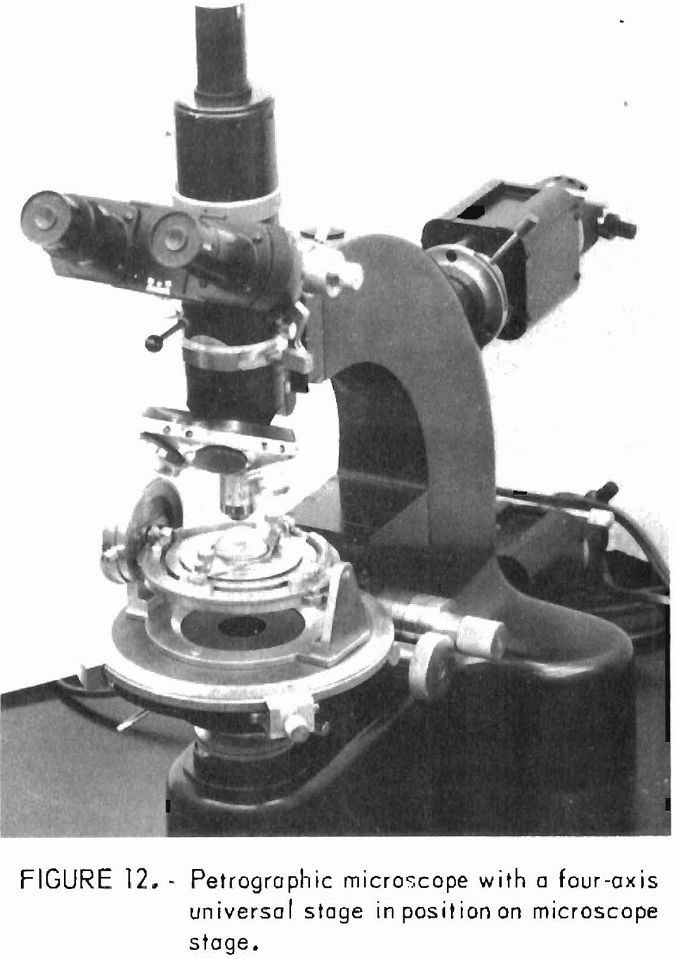
Analytical Procedure
The universal stage is attached to the petrographic microscope as in figure 12. The stage is meticulously centered on the optic axis of the microscope by the centering screws. This precise centering procedure is necessary to assure the petrographer that an object in the field of view will not move out of view when one of the rotation axes of the U-stage is moved.
The orientation of each fabric or optical feature is recorded by two angles, φ and p, where φ is an angle measured clockwise in a horizontal plane with respect to a zero reference position, and p is an angle measured in some vertical plane downward from a vertical axis (parallel to the optical axis of the microscope). In figure 13, P is the intersection of the pole normal to an inclined plane with the spherical surface and represents the unique position of that plane in space, as defined by the two polar angles, φ and p.
All features measured by the U-stage are regarded as poles or normals to a planar surface that they represent, unless they actually are linear fabric or optical features and not planes. The petrographer proceeds with this technique by tabulating and p for each fabric or optical feature. The fine points of procedure in manipulating the universal stage is dependent upon the fabric or optical features of a particular mineral; to describe the multitude of these fine points is needless here because excellent descriptions are available.
Petrofabric study with the U-stage is a complex and tedious technique that requires a thorough knowledge of optical mineralogy and an ability to think in three dimensions.
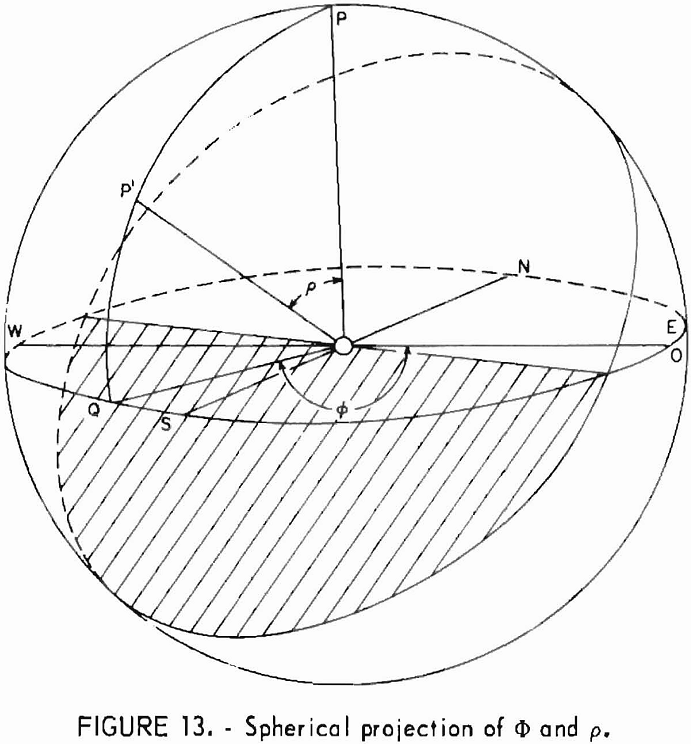
Essential to analysis of the tabulated angles, and p, is the equal-area projection (~ Schmidt net). Each and p combination is plotted on this projection as though the feature or DFO were a pole whose intersection with the southern hemisphere of a spherical projection is plotted on the equatorial plane after being projected from the spherical surface (fig. 14)
where N = north pole,
S = south pole,
P = intersection of pole (normal to a plane) with the spherical surface,
and X = intersection of PN on equatorial plane.
The equatorial plane is the plane of the equal area-projection. The purpose of the equal-area projection is to provide a means for plotting projected “P’s” in two dimensions so that valid statistical analyses (contouring, density, distributions, etc.) may be performed on the plotted points. To perform such analyses, the plotted points must be distributed on the two-dimensional projection surface with the same density that they would have displayed on the three-dimensional spherical surface. Hence, the projection must be “area-true.” Discussions of this principle are contained in Phillips’ work.
Data Reduction and Analysis
The effectiveness of U-stage measurements in three samples of typical Salisbury Granite, Yule Marble, and pumice from Newberry Crater, Oreg., was discussed by R, E. Thill in his M.S. thesis. Thill demonstrates that in Yule Marble, the lowest velocity direction coincides with the preferred orientation of calcite optic axes; in Salisbury Granite, the highest velocity direction parallels planes of a “primary” set of microfractures in quartz; and in pumice, the highest velocity direction is parallel with the direction of maximum preferred orientation of elongate vesicles.

Transgranular-Intergranular Analysis
Property
Transgranular-intergranular fracture ratio, (T/I) dimensionless.
Use of Property
The transgranular-intergranular fracture ratio is used to sum the calculated transgranular and intergranular distance segments along a fracture path, by means of the petrographic microscope and ring holder accessory, in order to show the tendency of a fracture to exhibit preference for either transgranular or intergranular failure. The tendency is expressed as a ratio, T/I. The ratio T/I may then be compared with a property associated with the fracture, such as breaking strength.
Specimen Preparation
See “Mineralogic Modal Analysis”.
Apparatus
See “Mineralogic Modal Analysis”.
Physical Conditions and Limitations
The millimeter and vernier scales on the right-left translation direction of the mechanical stage can be used to measure increment distances along a traverse only if individual grains are larger than 0.1 mm. For smaller grains, a calibrated eyepiece scale must be used in the microscope; this device allows measurement of distances to 0.01 mm or less if magnification is raised to about X 80.
The technique produces distance data from which to compute a transgranular-intergranular ratio. This ratio is at best approximate, because (1) the irregularity of a fracture trace in a thin section can be measured only approximately, and (2) the thin section with its fracture trace is assumed to be representative of any and all sections taken through a test sample (rock disk) normal to the sample axis and the fracture plane.
The technique is also limited to simple, clean fracture surfaces, such as are produced by point loading or rod loading. Multiple fractures, such as are commonly produced by Brazilian loading, make analysis extremely complicated because it is difficult to decide which fracture represents the initial failure plane in the sample.
Analytical Procedure
The fracture trace across the diameter of a circular thin section (cut through the center of a disk normal to its axis) is set approximately parallel with the right-left translation direction of the mechanical stage. The section is translated with the electric counter drive mechanism (flexible cable attachment) until one end of the fracture coincides with the microscope crosshairs intersection. Magnification is set at X 28. Initial readings are recorded on a tabulation sheet in millimeters along the two, mutually perpendicular translation axes of the mechanical stage.
A numerically coded reference sheet is consulted at the end of each traverse Increment for assigning a number to the increment that best represents the characteristics of the fracture trace along that Increment. Number assignments are dependent upon the discretion and experienced judgment of the petrographer, and in this respect, such assignments cannot be made routinely by an operator lacking sufficient experience. An example of a coded reference sheet follows for the case of transgranular-intergranular analysis in Charcoal granite:

where C = fracture trace increment associated with cleavage,
I = fracture trace increment unrelated to cleavage, or randomly positioned along or through a mineral grain,
T = transgranular, coded numbers,
I = Intergranular, coded numbers,
and H = computed fracture trace increment in mm, as hypotenuse of measured increment mechanical stage movements along Y and X direction (Y = back and forth movement, X = right and left movement).
Hypotenuse distances are then summed by grouping them according to specific coded numbers; the result of this summation is a list of all code numbers, 1 to 24, with a distance total associated with each number. From the list, the distance totals may be summed to a grand total distance representing the entire fracture trace length, and each total distance may then be calculated as a percentage of the entire length.
The ratio of transgranular to intergranular fracture, T/I, is computed for each thin section fracture trace length by summing distance totals for numbers 1 to 12 and dividing this total, T, by distance totals for numbers 13 to 24 (I total). This T/I ratio is an overall ratio for all minerals along a fracture trace. In addition, secondary T/I ratios may be computed for each mineral species, as in K-feldspar, by dividing the distance total of 1 to 2 by the distance total of 13 – 14.
To obtain Y and X distances for H computations on the data sheet, the thin section is translated in a right-left direction, X, by the flexible cable from the electric counter and in a front-back direction, Y, by manual movement of the knurled knob on the mechanical stage. Position location along the fracture trace is continually maintained with reference to the crosshairs intersection in the microscope field of view. The ring holder device is used in conjunction with the mechanical stage to hold securely irregular-sized thin sections, such as the 1- or 2-in circular sections.
Data Reduction and Analysis
The following data were obtained from a study of a fracture trace in a thin section of Charcoal granite. For simplification purpose, data are presented from only one-half of the fracture trace (that is, from the center of a 2-in-diam section to its rim) as follows. H, Y, and X are in millimeters
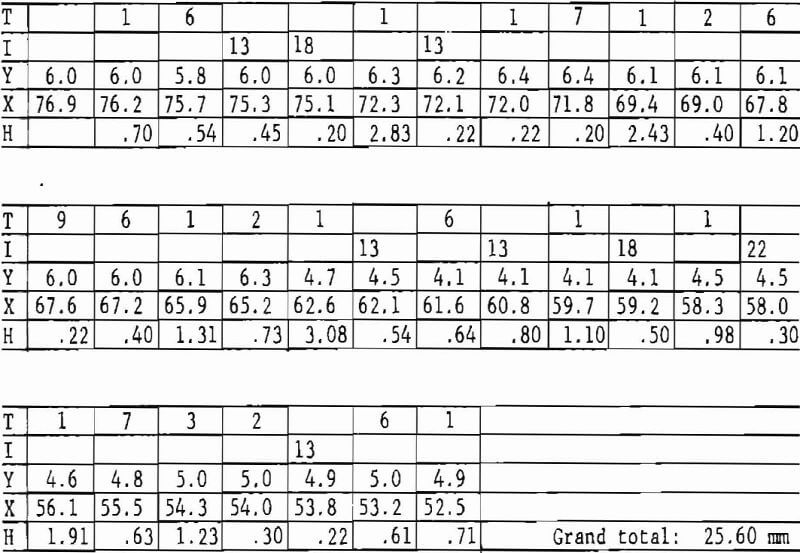
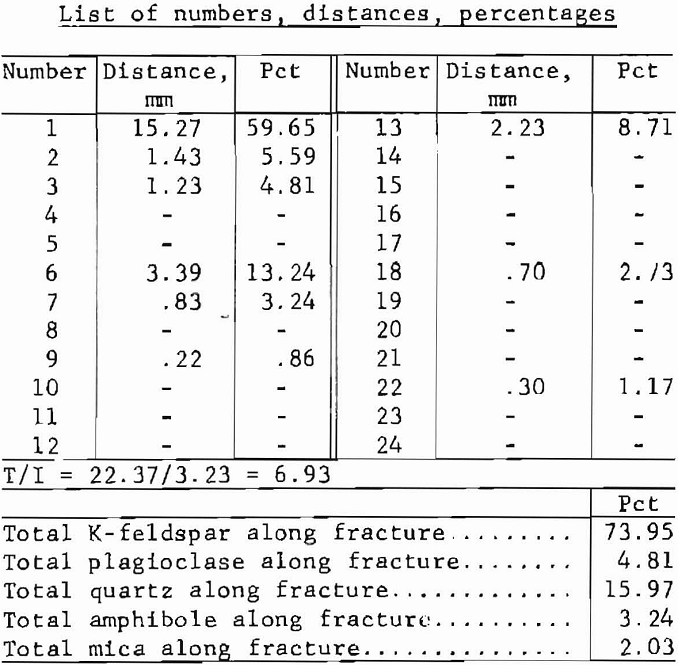
The two photomicrographs showing portions of a fracture trace in typical Rockville Granite (figs. 15-16) illustrate transgranular-intergranular analysis. An examination of these photomicrographs clearly emphasizes the variation in fracture trace morphology in a composite of different grain sizes, shapes, orientations, and mineral species.
In another rock, Tennessee marble, the following tabulation illustrates a useful result of transgranular-intergranular analysis. Breaking strengths and T/I ratios are clearly and consistently proportional:
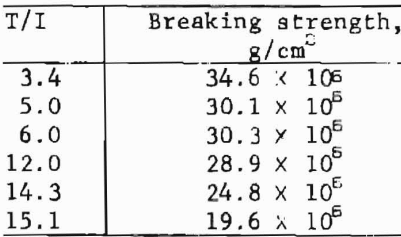
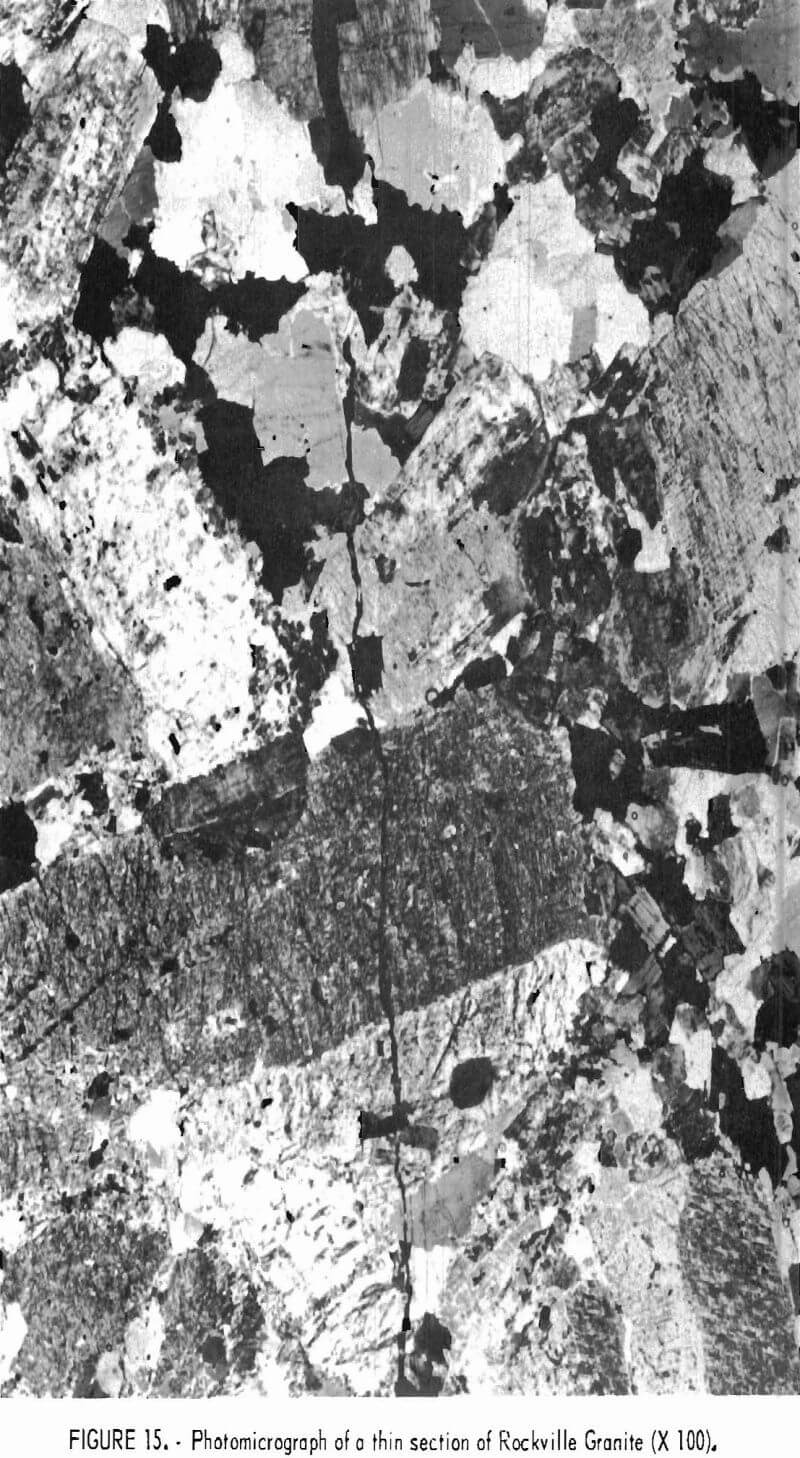
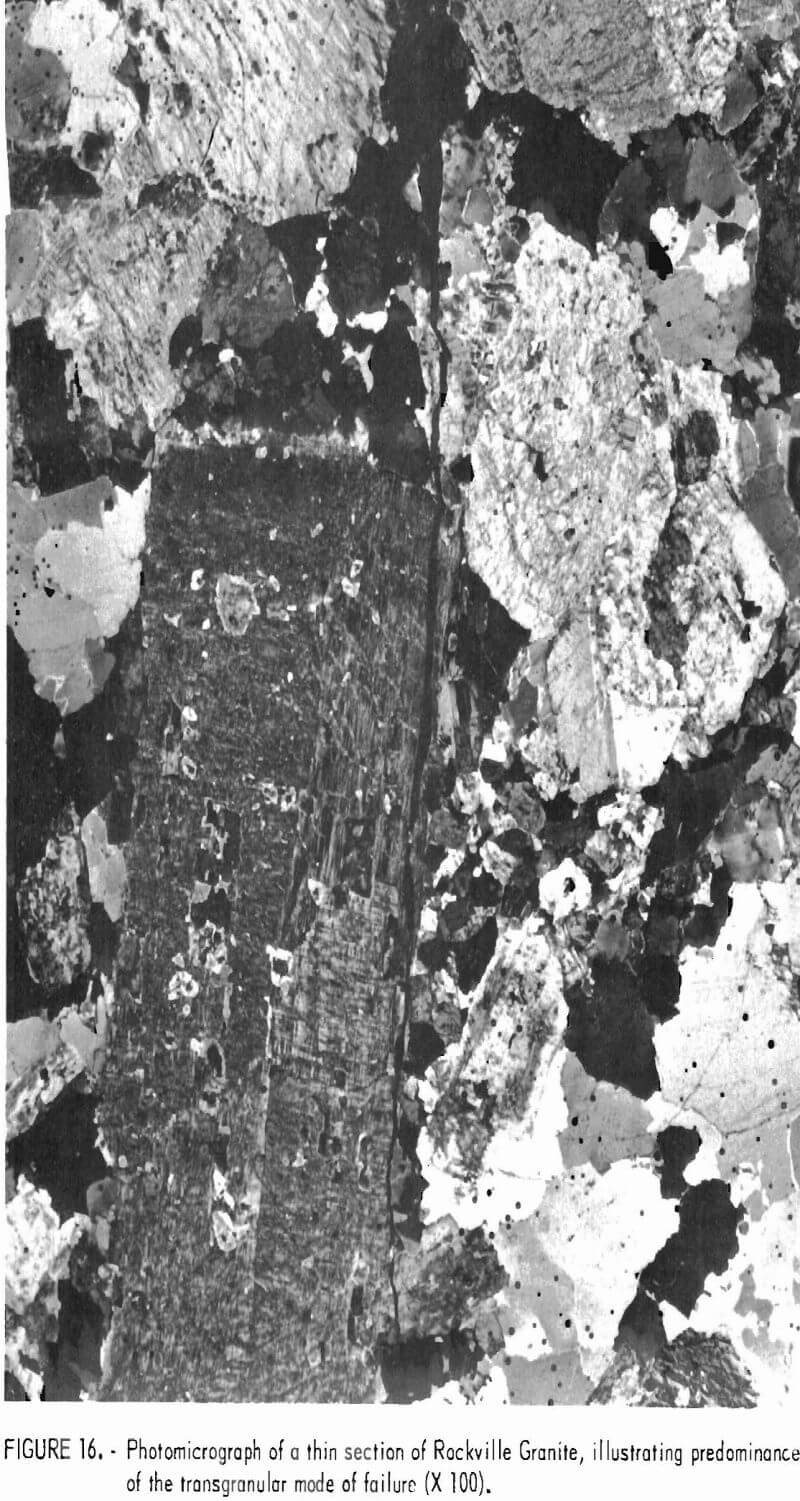
Parameters Related to Macroscopic Behavior of Geologic Formations
and their Responses to Explosive Charges
Explosion Detonation Rate
Parameters
Detonation velocity of an explosive in rock.
Applications
Detonation velocity is a very important parameter in determining the effect of explosive detonation in breaking rock. Since the stress-wave reflection-breakage mechanism is important in breaking rock, the shape of the stress wave will affect the amount of rock broken. Starfield and Pugliese have shown that strain wave shapes are greatly influenced by the detonation velocity of an explosive.
Since explosives are confined in production blasting, the detonation velocity of an explosive should be measured with the charge in a borehole. The detonation rate will be higher when the measurement is made with the charge in a borehole than with the charge lying on an exposed surface.
Experimental Procedure
For work with such explosives as ammonium nitrate prills and fuel oil (AN-FO), the borehole is first cleared of water by a blast of compressed air. The AN-FO will be desensitized if allowed to stand in water too long. If the hole cannot be blown dry, a plastic liner must be inserted into the borehole before the prills are poured into the hole. The drill hole should also be checked for shifted rock slabs before the charge is placed in the borehole. The charge must be placed carefully to prevent breaking the insulation covering the lead wires.
Two methods for measuring detonation velocity have been used in the field:
Chronograph counter-contactor method-Contactors are simple “make” circuits with a pulse generator circuit operating the start-stop sections of a microsecond counter. Two contactors are inserted in the charge a known
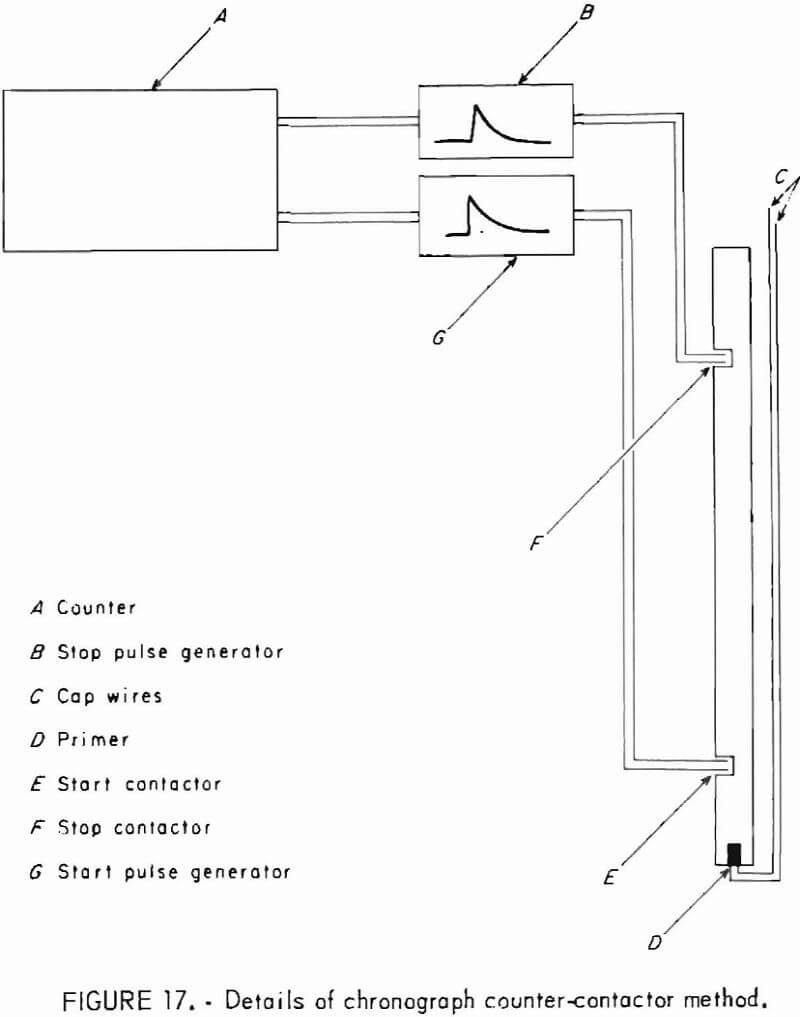
distance apart (fig. 17). As the detonation front moves along the explosive length from the point of initiation, the start contactor leads close to complete the start circuit and activate the counter. The start contactor should be placed at least one charge diameter away from the point of initiation of the charge. At this distance from the primer, the detonation rate has stabilized. As the detonation front moves past the stop contactor, the contactor leads are closed , and the counter stops. The time interval reading displayed on the counter is the total time the detonation front took to move from the start contactor to the stop contactor. The quotient of the distance interval divided by the time interval recorded on the counter is the detonation velocity. The accuracy of this method depends on the steady-state character of the detonation rate. Any fluctuations in the detonation rate between the contactors cannot be determined from the time interval reading.
Continuous detonation-rate probe method-Since the first method will not measure incremental fluctuations in the detonation velocity, a continuous detonation rate probe can be placed along the axis of the charge. Several easily constructed probes have been used in the field. Nicholls and Duval describe their probe as a threaded nylon rod wrapped with Nichrome resistance wire and encased in a thin-wall aluminum shell. This protective shell acts as an electrical return lead and is not in contact with the resistance wire.
The probe is inserted in the charge before the charge is lowered in the borehole. The probe is powered by a constant current source; as the detonation proceeds along the length of the charge, the aluminum shell collapses around the threaded wire and continuously shorts out the probe behind the reaction front. The resultant decreasing resistance causes a voltage drop across the probe, which is displayed as a voltage change with time on an oscilloscope and photographed by a Polaroid camera. The slope of the photographed trace is proportional to the detonation rate. This probe can be made of any length to match the length of charge and the distance over which the detonation rate is to be measured. Gibson, Bowers, Summers, and Scott designed a probe consisting of resistance wire coiled on an insulated copper wire. The insulated wire acted both as an electrical return lead and as a core for winding the resistance wire. The operating principle is the same as for the probe used by Nicolls and Duvall. Larocque, Kapeller, and Darling describe a continuous detonation rate, probe with a series of resistors instead of the resistance wire. When the detonation front moved up the charge, the probe shorted behind the reaction front. A constant current was fed to the circuit, and the voltage across the unaffected portion of the probe was displayed on an oscilloscope. The resulting oscilloscope trace gave a step decrease in voltage. If the detonation velocity changed, the variation appeared as a longer or shorter horizontal step of the oscilloscope.
Data Reduction and Analysis
The detonation impedance of the explosive, defined as the product of the mass density and detonation rate, is used in calculating the ratio of the detonation impedance of the explosive to the characteristic impedance of rock:
![]()
where Z = ratio of explosive to rock impedance, dimensionless,
W1 = loading weight-density of the explosive, lb/ft³,
VΔ = detonation velocity of the explosive, ft/sec,
W2 = weight-density of the rock, lb/ft³,
and Vr = longitudinal-wave propagation velocity in rock, ft/sec.
The pressure, or stress, transferred from the explosive to that of the rock is dependent to some degree upon the ratio Z.
The amplitude of the strain pulse produced in rock is dependent upon the detonation pressure of the explosive but is not directly proportional to it. In Bureau field studies on explosives, the detonation pressure of an explosive was calculated from the explosive loading density and detonation velocity by Brown’s approximation:

where P = detonation pressure in lb/in²,
W1 = weight density in lb/ft³,
and V4 = detonation velocity in ft/sec.
Field and Laboratory Explosive Cratering
Parameters
The dimensions of a crater formed in rock by the detonation of a buried explosive charge are the parameters.
Applications
Explosive cratering has been used in the mining industry to develop information for designing production blasts and evaluating the performance of explosives. It is a blasting method that has been used to break rock and to remove overburden. Explosive cratering is used in research to examine scaling laws and to study the mechanism of rock breakage by explosives.
Experimental Procedure
Field crater tests can be performed on any relatively flat, exposed rock surface. For laboratory cratering, the size of the rock block is determined by the quantity of explosives being used. In laboratory cratering, the rock block must be large enough so that stress wave reflections from the bottom and aides of the block are not involved in crater formation. For 0.3 g of explosive, a typical block size is a 2-ft cube.
Drilling equipment is required to drill a hole in the rock cube. The explosive charge is placed in the bottom of the drill hole, which is between 0.5 and 6.0 in deep. Explosive cratering has been performed with virtually every type of explosive, with a wide variety of charge geometries, and with charge weights ranging from 10 -4 to 10 6 lb of explosives. Nuclear crater tests have involved energies equivalent to 10 8 lb of TNT. Depending on the size of the crater, earth-moving equipment may be required to remove broken material from the crater. For very large craters, drilling is used to establish the true contour of the crater, and surveying instruments are used to measure the dimensions, particularly those of the larger craters.
Crater tests are performed by drilling a hole in a rock, placing an explosive charge in the drill hole, and detonating the explosive. All loose and broken material is removed from the crater, and the crater dimensions are measured. Figure 18 shows the crater test geometry. Figure 19 shows the explosive or charge depth, Ds ; the crater depth, Dc; and the crater radius Ra. The charge depth is usually the depth to the center of the explosive charge. Crater volume, Va, is the volume of the crater formed in the rock mass. Crater tests are described in previous reports.

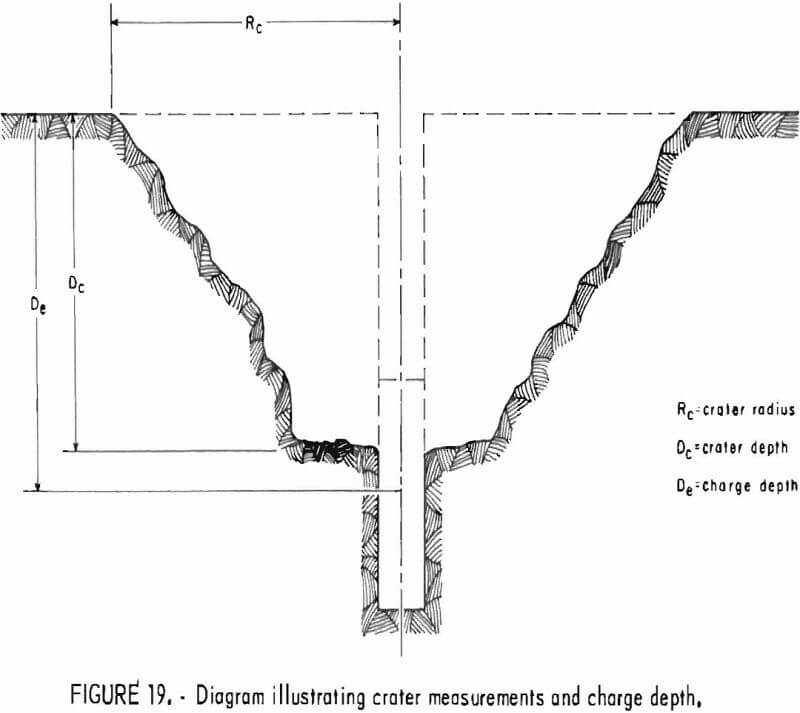
Data Reduction and Analysis
For some applications several individual craters are formed in one rock mass. Charges are detonated over a range of charge depths for plotting crater dimensions as a function of charge depth. Figure 20 is such a typical curve. Two important parameters determined from curves as shown in figure 20 are optimum charge depth and critical charge depth. The optimum charge depth is the charge depth at which the largest crater is formed, and the critical charge depth is the minimum charge depth at which no crater will be formed. Although optimum charge depths are usually defined for crater volume, optimum charge depths for crater radius and crater depth are sometimes used. Sometimes the optimum charge depth for crater volume is not equal to the optimum charge depth for either crater radius or crater depth.
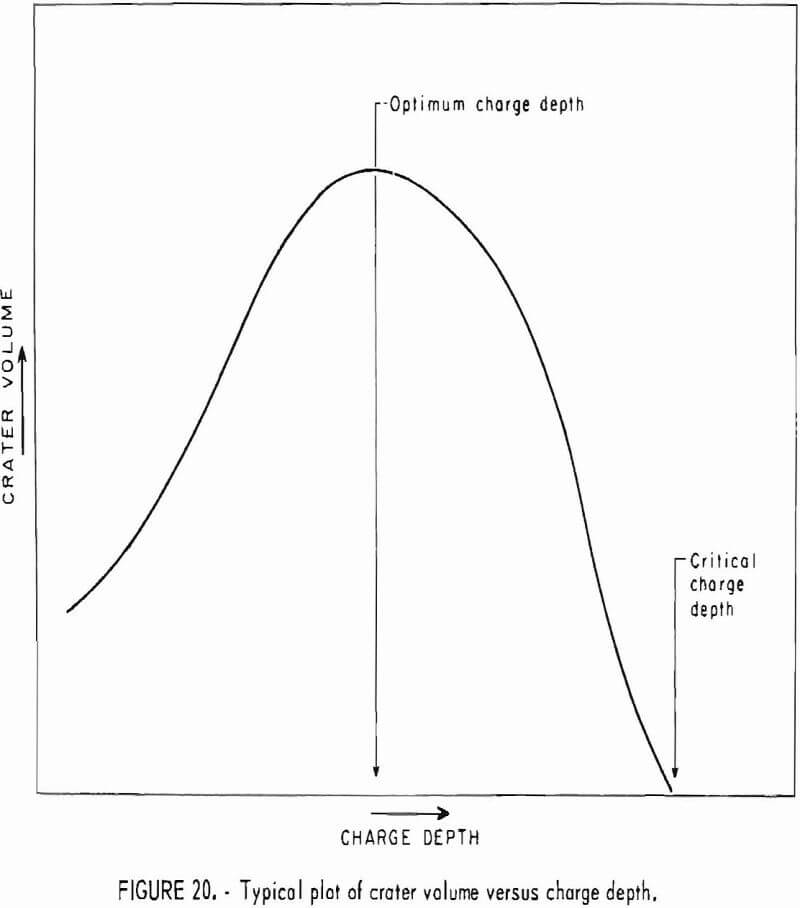
Fracture Phenomena of Rock Masses by Explosive Charges
(High-Speed Photographic Measurements)
Parameters
The fracture phenomena of rock masses are measured in terms of flyrock velocity, explosive detonation velocity, shock velocity, and particle velocity. These are to be considered as examples and not as an all-inclusive list.
Applications
High-speed photography is an engineering tool that can be applied to measure virtually any dynamic property. Experiments can be performed in the laboratory or in the field.
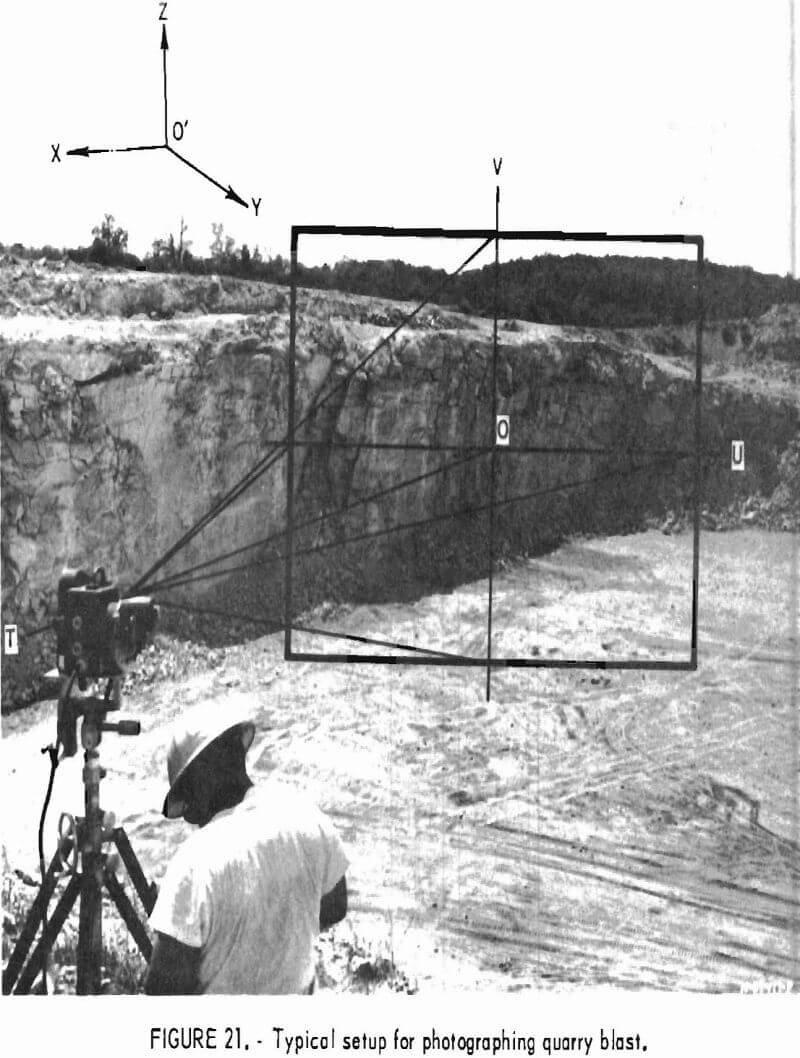
With currently available high-speed photographic equipment, virtually any subject can be photographed. The primary limitations are illumination, equipment availability, and photographic technique. Typical considerations of equipment include camera framing rate (framing mode), camera writing speed (streak mode), lens types, total recording time, synchronization of camera with the event, film type, and auxiliary light sources. A good general purpose text on high-speed photography was written by Hyzer.
Experimental Procedure
Flyrock Velocity
The detailed events typical of rock breakage in a quarry occur so rapidly and cover such a wide area that the phenomena cannot be observed by the unaided eye. A framing camera operating in the range of 1,000 to 5,000 frames/sec offers a means of slowing down the action so that the gross effects of the breakage process may be observed and studied.
A typical camera setup for a multiple-hole quarry blast showing the viewing area of the camera is given in figure 21. The light intensity and position of the sun at the time of the test are important factors in determining the camera position and film characteristics.
Before a blast is photographed, a sketch or survey plot of the area is made showing the camera position, the quarry face, and a known reference point. A target should also be included in the camera field of view to serve as a check of the scale factor.
Since the optical axis of the camera is usually at some azimuth and elevation angle to the quarry face, correction must be applied to displacement measurements of the film. This correction may be made by so orienting the projector to the projection screen that the azimuth and elevation angles are the same as in the quarry, or by applying appropriate trigonometric corrections. High-speed photography, as applied to quarry blasting, is described in references. Flyrock velocity measurements from small charges in the laboratory are discussed in a previous report.
Data Reduction and Analysis
Flyrock Velocity
A plot showing the contours of flyrock and shothole gages as observed in a quarry blast is shown in figure 22. Flyrock displacement against time curves are constructed from these contours. The slope of a straight line through these data yields the velocity. Figure 23 shows typical curves of flyrock velocities in granite
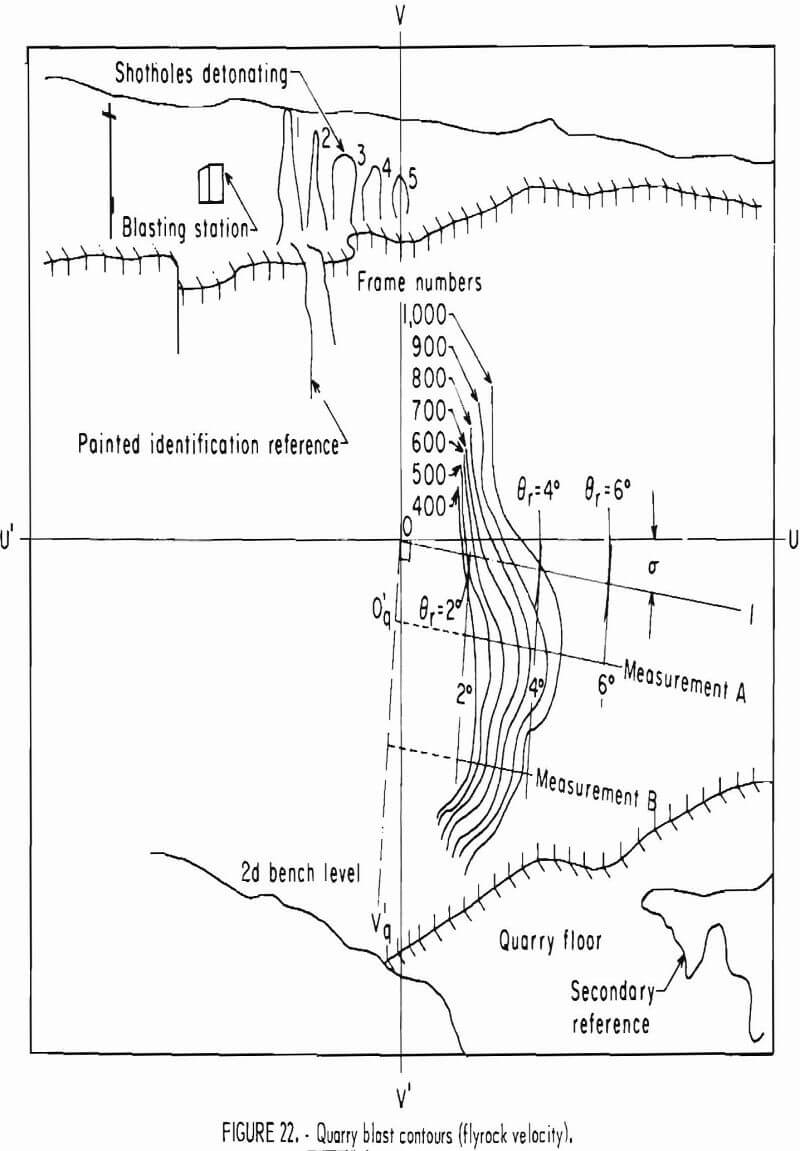
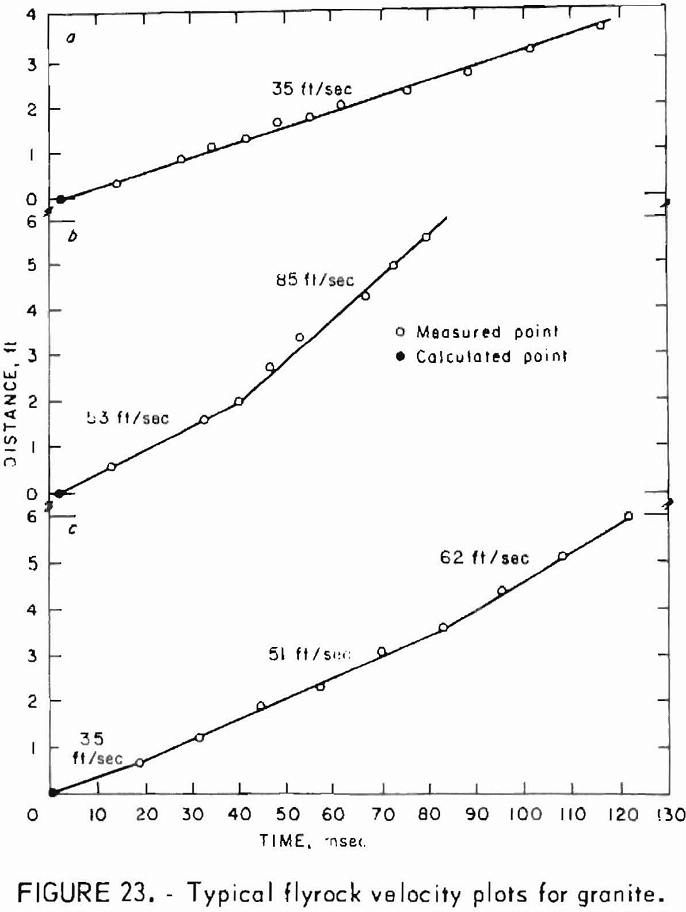
Flyrock velocity, stemming velocity, initiation time, first movement, and other qualitative effects can be obtained from film analyses of quarry and laboratory blasting studies. Analyses of quarry blast films indicate that step increases in horizontal flyrock velocity sometimes occur in the early stage of rock movement (fig. 23). These increases most probably result from in-flight impact between rocks. The higher velocity of the later rock slabs cannot be explained by reflection breakage theory alone since this theory predicts that the first slab will have the highest velocity. Because the expanding explosive gases accelerate fractured rock that offers the least resistance, both the expanding gases and reflection breakage thus play important roles in quarry production blasting.
Detonation Velocity
The detonation velocity of an explosive charge may be measured with a streak camera. The streak camera differs from a high-speed framing camera in these ways:
- The camera film plane or image converter views the subject through a slit plane.
- Only the portion of the image framed by the slit is transmitted by the lenses and focused on the film plane or image converter tube. Because a single vertical slit is generally used, the camera does not see the entire subject, but only a thin zone along its surface. Thus, the time scale of event occurring along this zone is extended, and the resulting record is a streak or smear on the film plane.
Figure 24 is an idealized cross section of a cylindrical charge detonated along the bottom surface. Since the camera slit is oriented along the axis of the explosive charge (AB), the advancing waveform appears as a streak on
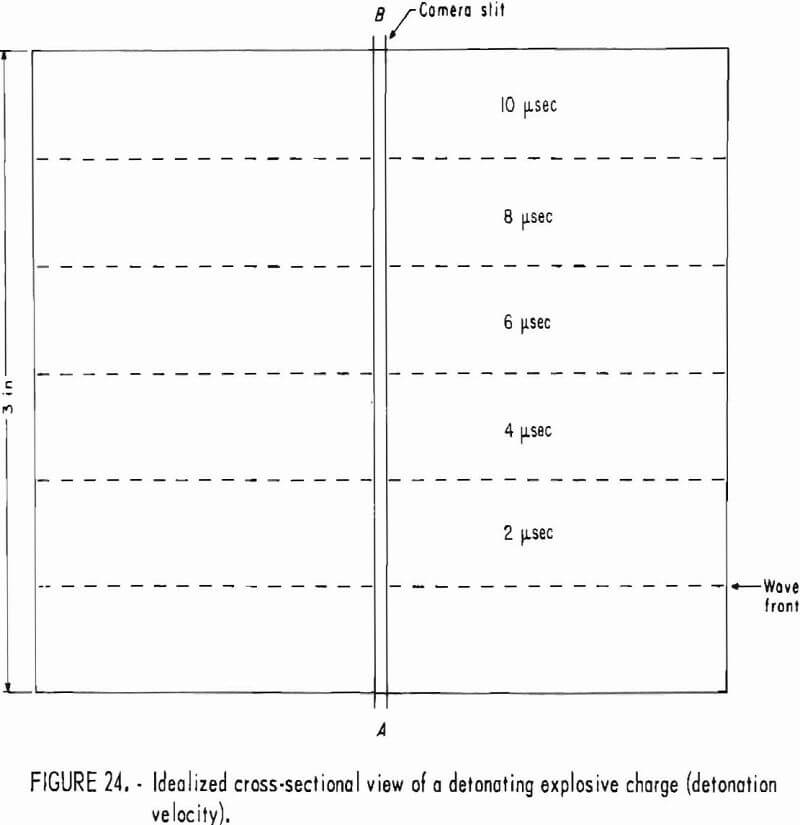
the film. As the event is self-luminous, no additional lighting is required. Figure 25 is the distance-time curve taken from the camera streak record for the slit orientation in figure 24. The slope of the curve determines the detonation velocity.
The detonation velocity record gives a reliable indication of explosive performance. The explosive detonation pressure, the most important single detonation parameter, can be approximated from the detonation velocity and the explosive density :

where P = detonation pressure, psi,
W1 = average loading weight density, lb/ft³,
and Vd = detonation velocity, ft/sec.
Equation of State Measurements Shock and Particle Velocities
The fundamental shock relations in a rock medium can be derived from the laws for the conservation of mass, momentum, and energy. It is assumed that explosive loading will introduce a plane shock wave into the rock specimen that travels with constant velocity, U. In the region behind the shock front the particle velocity, Up, the pressure, pl, and density, pl, are assumed to be constant. The material ahead of the shock wave is undisturbed with a pressure, po, (which can be neglected) and a density, po. Using one-dimensional shock wave theory, the pressure is given by
Pl = Po Us up…………………………………………………………..(2)
The volumetric strain is given by
ε = ΔV/V = up/Us……………………………………………………(3)
Equation of state measurements are determined by simultaneously observing shock and particle velocities in explosively loaded rock specimens with a high-speed streak camera. The described method is taken largely from Sadwin.
Figure 26 is a diagram of the experimental setup that covers a pressure range of 1 to 50 kb. The camera is oriented with the slit parallel to the axis of the rock cylinder. Illumination is provided by an argon bomb. Since equation of state measurements require several pounds of high explosives, tests are usually conducted in the open air with suitable protection for personnel and equipment.
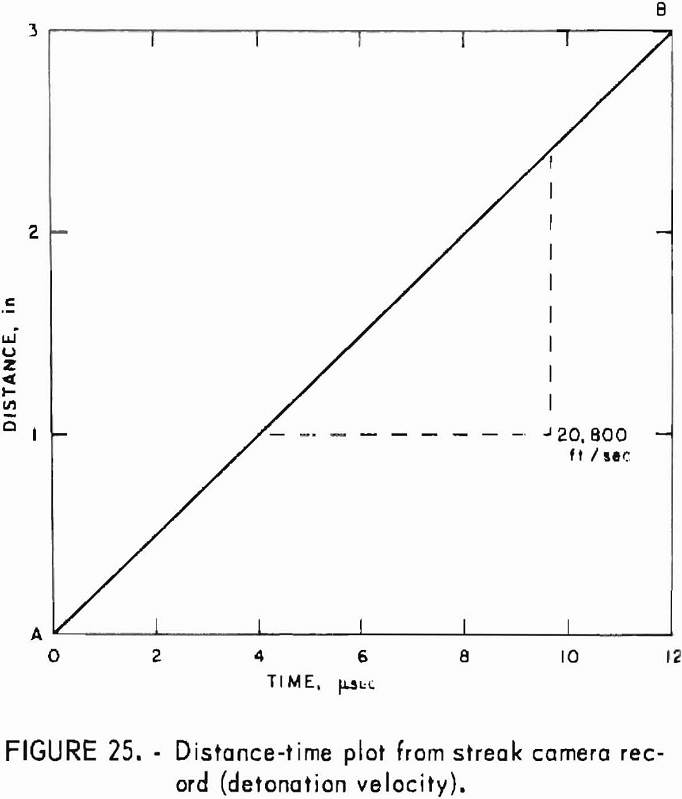
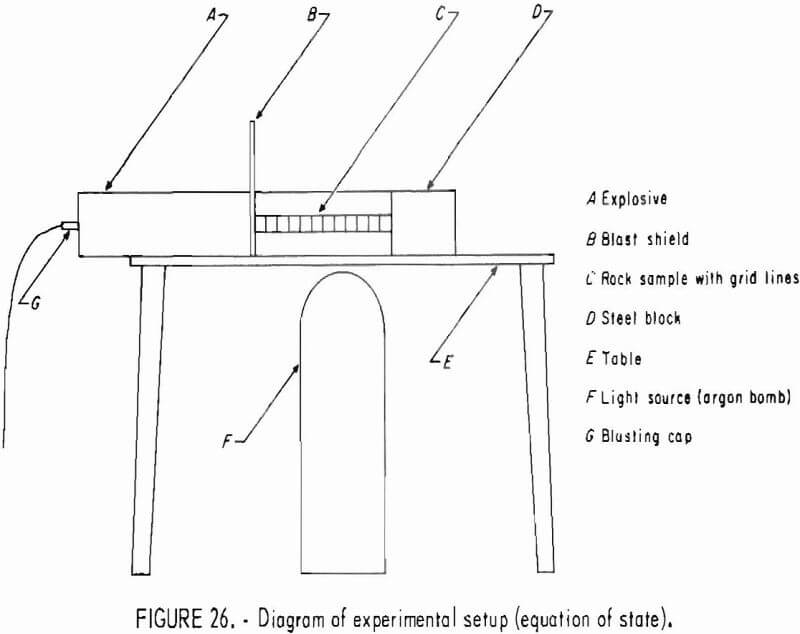
The arrival of the explosive-induced shock wave at each grid line in the rock sample produces a bend in the grid line. The shock velocity, Us, is proportional to the slope of a line drawn through tests bends. Particle velocity, up, is proportional to the slope of the grid line after the (bend) arrival of the shock wave.
The combined data from the streak camera records and density values from equations 2-3 will yield the dynamic pressure-strain curves for a material. Figure 27 shows a typical curve for granite. The equation of state measurements yield valuable information on the pressure-volume behavior of rocks under dynamic loading conditions and are of considerable interest in blasting research.
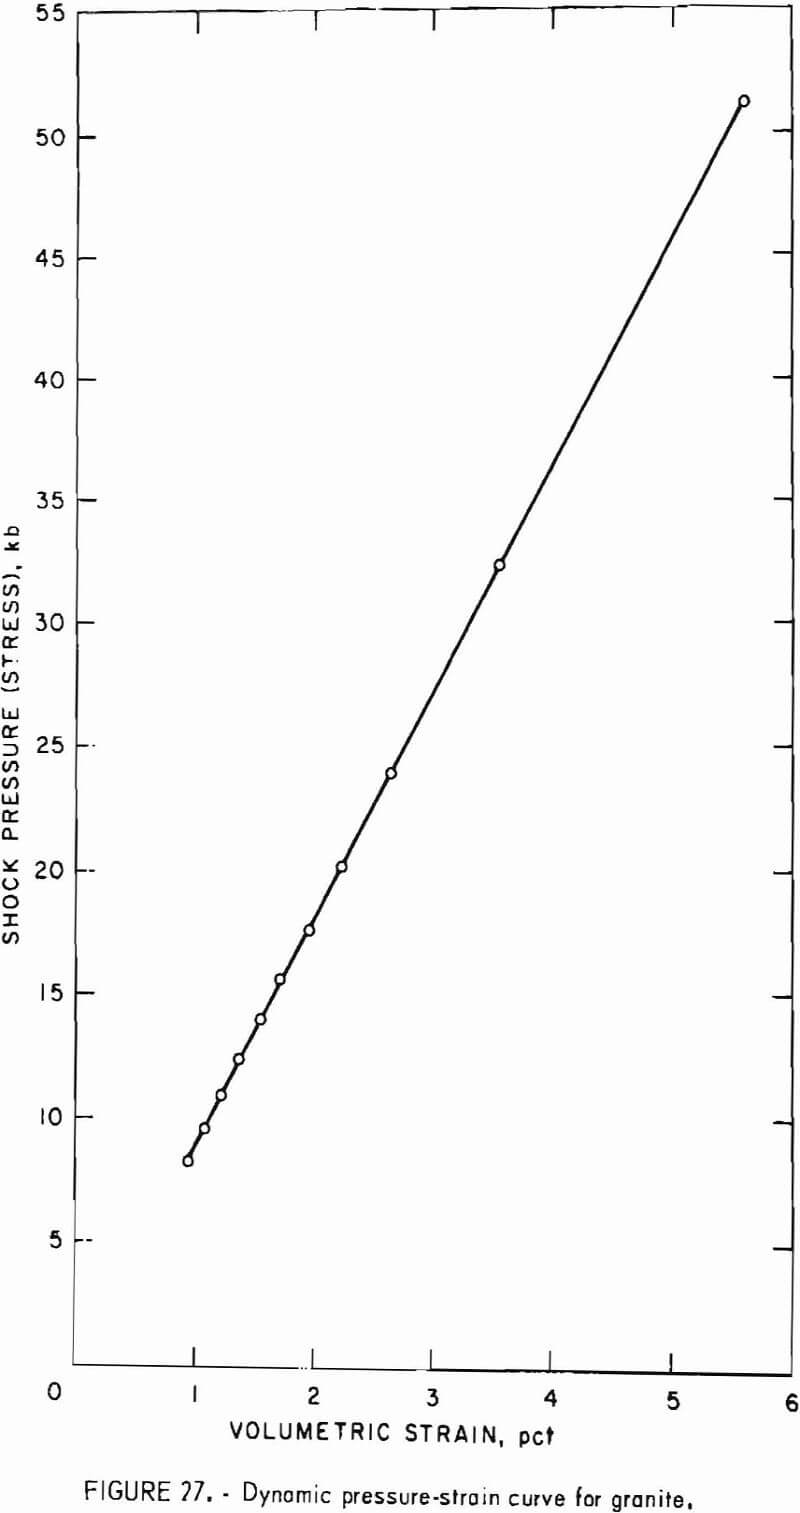
Propagation of Seismic Waves in Rock Mass
Parameters
Field measurements of longitudinal and shear velocity of seismic waves in rock masses exposed on the surface of the earth.
Applications
Field measurements of longitudinal and shear velocity of rock are used in seismic prospecting and to determine the in situ dynamic elastic constants of rock.
Experimental Procedure
To measure longitudinal and shear velocities, an explosive is detonated in a shallow drill hole. The wave motions generated on the rock surface are measured by velocity gages or accelerometers at several distances from the source and recorded with a tape recorder, oscillograph, or an oscilloscope. Zero shot time is determined by an ionization probe attached to the charge. Velocities are computed from the time intervals between the detonation of the explosive and the arrival of a longitudinal or shear wave at each gage. Shear wave arrivals are most frequently recorded by transversely oriented gages; that is gages between the gage and the source. Figure 28 shows a typical experimental setup for measuring longitudinal and shear velocities.
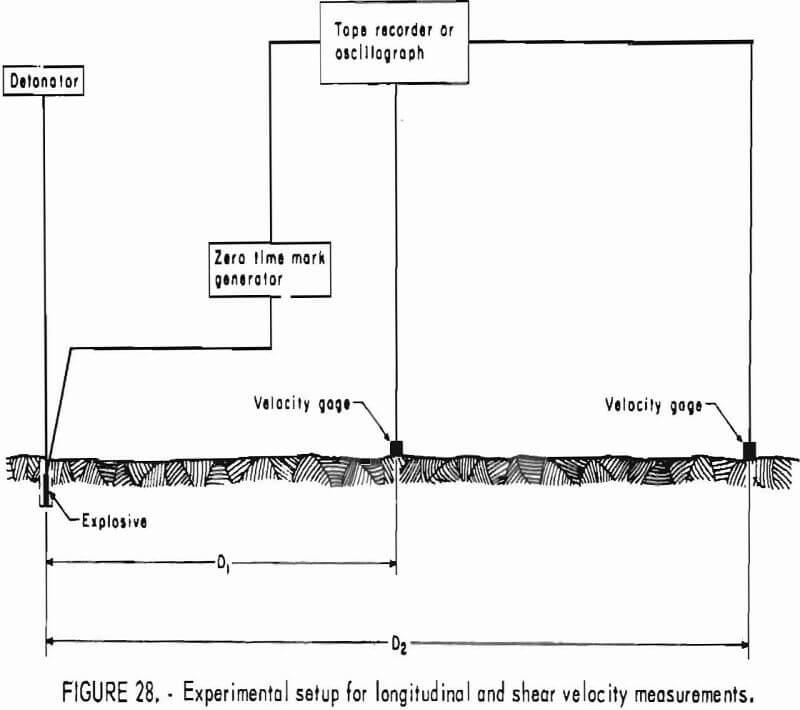
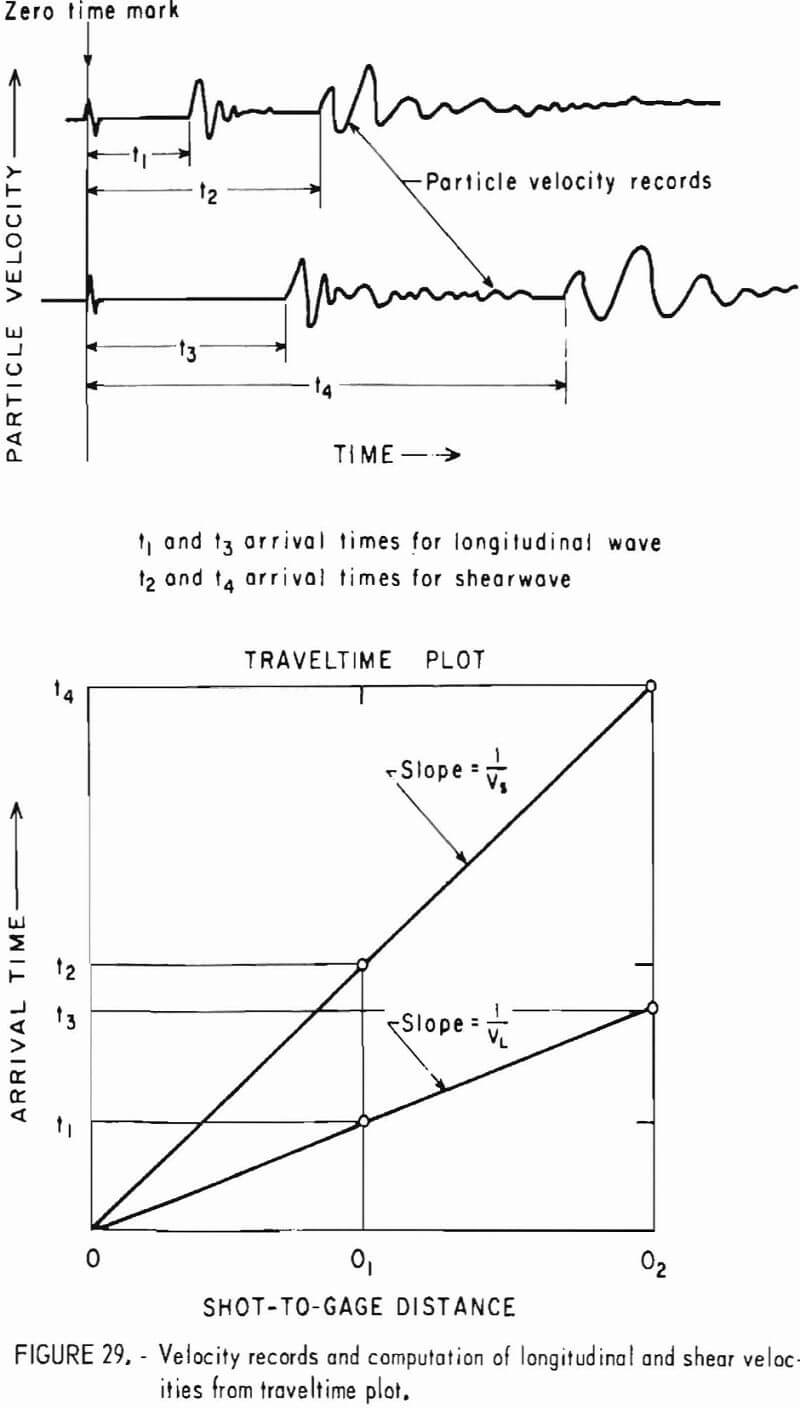
Data Reduction and Analysis
Longitudinal and shear velocities are computed by dividing the shot-to-gage distance by the time interval between the detonation of the charge and the arrival of the appropriate seismic signal at the gage position. These velocities can also be computed from travel time curves as shown in figure 29. Figure 29 shows some typical particle velocity records and the computation of longitudinal and shear velocity from a traveltime curve.
Refracted Seismic Waves in Layered Geologic Formations
Parameters
The thickness, dip of layered geologic rock formations and the longitudinal velocity of seismic waves are the parameters.
Applications
Seismic refraction measurements are used to determine overburden thickness for applications in mining and construction. In addition, this method is used in prospecting for minerals and petroleum. Seismic refraction techniques can be used to determine the depth of fracturing above the roof of an underground opening.
Experimental Procedure
Test site preparation varies with the location in all cases, however, a survey of the area is made with the positions of the gages and the shothole carefully measured. Care must also be exercised in the emplacement of gages. The kind of gage used and the material on which the gage is placed determine which is the best emplacement procedure. For example, accelerometers are generally cemented directly to the solid rock, but velocity gages are often just set on surface soil from which the turf has been cleared or are buried below a foot or so of soil.
The test site should be located in an area free from interference by extraneous vibrations caused by heavy equipment or low-flying aircraft. The test area should also be as far as possible from power lines likely to cause appreciable electrical interference.
The seismic refraction method requires several transducers to detect the the arrival of seismic waves. Usually particle velocity gages are used, or in some applications, accelerometers are used. Displacement gages are less frequently used.
The gages are connected by shielded cables to a recording device, usually an analog magnetic tape recorder or a direct-writing oscillograph. Direct recording on an oscillograph requires an amplification stage between the gages and the oscillograph. Although the tape recorder system also uses an oscillograph for final display, the amplification stage is between the tape recorder and oscillograph. The arrangement allows the data to be played back at varying degrees of amplification.
The initiation time of the seismic pulses is usually recorded with a zero time mark generator. This device receives a pulse from the detonator that sets off the explosive charge and records the zero time on the tape recorder or oscillograph.
The field layout consists of several transducers placed in a straight line on the surface. At one end of the gage line an explosive charge is detonated in a shallow drill hole, and the resulting vibrations are detected by the gages and recorded on the tape recorder or oscillograph.
The number of gages employed and their spacing depends on the number of layers to be measured, the relative depth of the layers, and the general quality of the data. Usually an array of five to 14 gages is used. The spacing of the gages depends on the depth to be investigated and the thickness of the layers, with the total spread made several times longer than the greatest depth to be measured. Spread length may range from one to several hundred feet.
Figure 30 shows a sectional view of a field layout with the first arrival wave paths for a three-layer case.
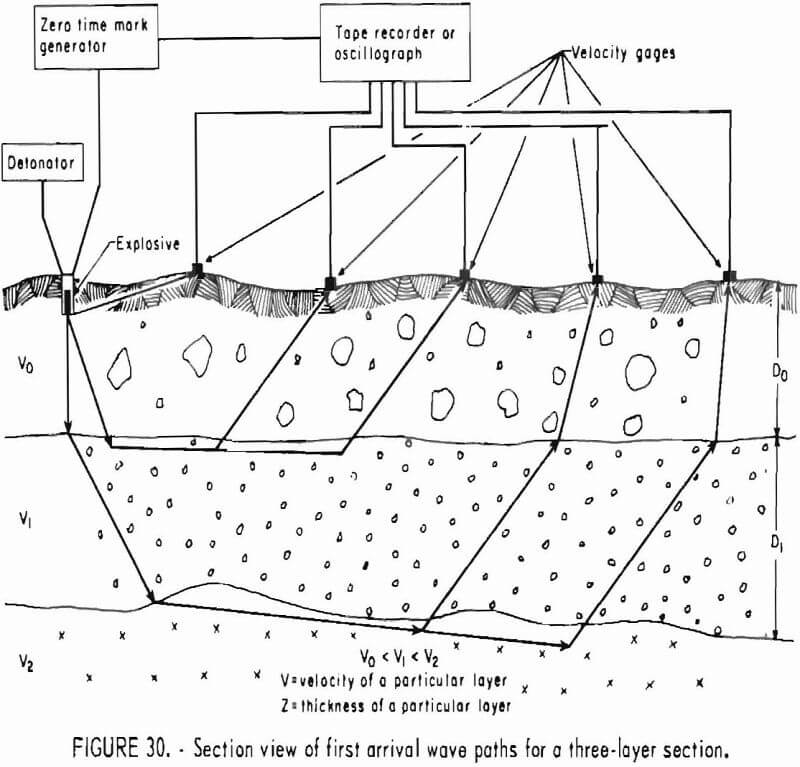

Data Reduction and Analysis
The arrival of the longitudinal wave is determined by the first motion recorded for each gage in the array. The time interval between shot initiation to first arrival Is used to calculate rock thickness and velocities.
Figure 31 shows a typical traveltime curve for a three-layer case and the associated calculations.
Considerable experience is required to interpret the data since the scatter in the data often makes it difficult to determine just how many layers are present. Under these conditions, knowledge of the sub-surface geology is necessary for a reliable interpretation of the data. More information on the refraction method can be obtained from other sources.
Stress Waves Generated in Rock by Explosives in Laboratory Tests
Parameters
The detonation of a small explosive charge in laboratory blasting tests is assessed in terms of free-surface particle displacement, free-surface particle velocity, and radial strain or tangential strain generated in materials.
Applications
Measurements of wave motions generated in materials by explosives in laboratory blasting are used in model studies of problems in blasting research and in seismology.
Experimental Procedure
Experiments can be performed with both two- and three-dimensional models. Three dimensional models can range in size from 2-ft cubes up to 5-ft cubes. Two-dimensional models with diameters of 6 in up to several feet and thicknesses of ¼ to 1 in can be used.
An explosive charge is placed in a drill hole in a two- or three-dimensional model. Capacitive gages or strain gages mounted on a free surface or imbedded in the model are used to measure the wave motions generated when the explosive is detonated. The wave motions are recorded for an oscilloscope and photographed with a Polaroid camera. Figure 32 is a diagram of the experimental setup. Figure 33 shows a typical strain time record.
Capacitive gages or strain gages can be positioned for several shot-to-gage distances. Changes in wave parameters with distance can be studied by detonating one charge with gages at several distances or by using one gage and detonating several charges at different shot-to-gage distances.
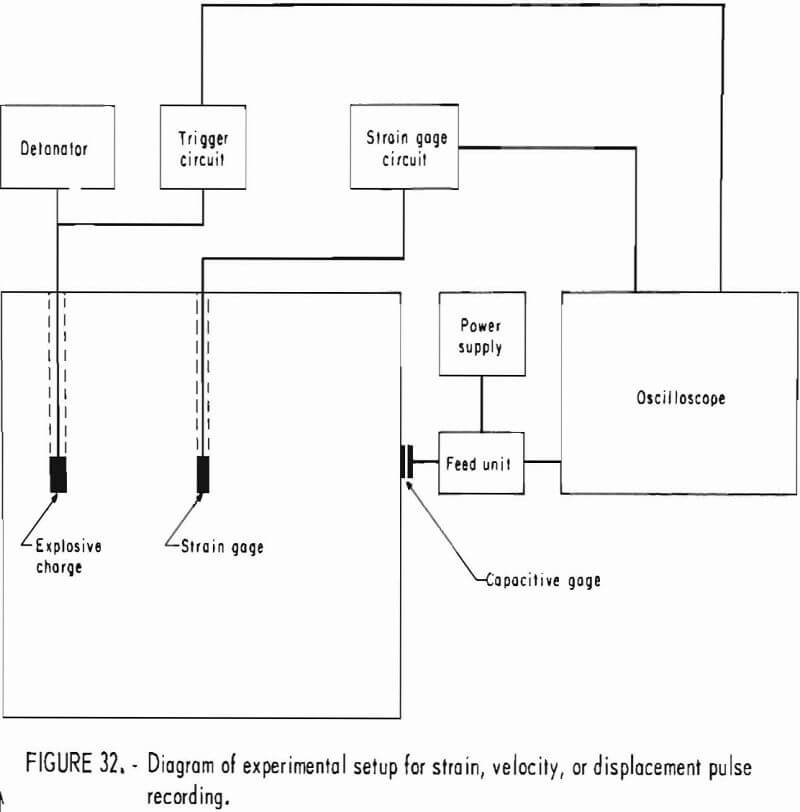

Capacitive gages are mounted on the surface of a three-dimensional model. Although capacitive gages can be used with two-dimensional models, strain gages are more convenient and more reliable with such models. Capacitive gages with appropriate circuits can be used to measure free-surface displacement or free-surface velocity. Descriptions of capacitive gages are given in a previous report.
Strain gages can be used with two- or three-dimensional models. With two-dimensional models, the strain gages can be mounted on any flat surface. Strain gages are used in three-dimensional models by first mounting the gage on a drill core and then cementing the core in a drill hole. The imbedded strain gage technique for laboratory blasting is similar to that used in field tests and is described by Obert and Duvall.
Data Reduction and Analysis
The following parameters are frequently determined from strain wave measurements: Peak strain, full strain, rise time, fall time attenuation, strain energy,and impulse parameters. Quantities determined from strain pulse measurements are described in a previous report. Measurements of peak strain, fall strain, rise time, and fall time are shown in figure 33.
With free-surface particle displacement pulses or free-surface-particle velocity pulses, peak amplitudes, fall amplitudes, rise times, and fall times can be determined. Particle velocity values can be obtained by numerical differentiation of the particle displacement pulse. Displacement values may be obtained by numerical integration of the velocity pulse and acceleration by differentiation of the velocity record. Elastic relationships for isotropic materials can be used to determine strain from free-surface particle velocity pulses. Parameters determined from free-surface displacement and velocity are described in a previous report.
Stress Waves Generated in Rock by Explosives
Parameters
Field measurements of radial strain, tangential strain, radial particle acceleration, or radial stress are used in assessing strain waves generated in rock by explosives.
Applications
When studying the effects of detonating an explosive charge in a drill hole or cavity in rock, three zones have to be considered; (1) The source zone in the cavity, (2) the transition zone surrounding the cavity, and (3) the seismic zone. Field measurements of wave motions produced by explosive detonation have been made in the seismic zone.
The seismic zone, in which the stress pulse propagates in a nearly elastic material, is the region beyond the transition zone. Since the rock is not perfectly elastic, absorption and dispersion occur in the seismic zone. Waveform measurements in the seismic zone are important since the stress-wave reflection-breakage mechanism operates at a vertical free face in this zone.
The linear-array tests described in this references have been conducted in undamaged rock. The test sites have been located on quarry property far from any active face or blasted area. Although these sites have been on quarry properties because the rock surface there is usually well exposed, these tests can be conducted on any large exposed outcrop if permission to blast can be obtained.
Upon detonation in a borehole, explosives produce a stress (or strain) wave in rock. A range of explosives from black powder to cast composition B have been studied in regard to strain wave generation in rock. Short cylindrical charges —for example, 2-½ by 2-½ ft—have been used in determining the effects of decoupling, method of initiation, charge diameter, and explosive type on the amplitude and frequency of the waveform produced in rock. The effects of long cylindrical charges — for example, 2-½ in by 27 ft have been studied to determine the actual waveform produced in rock by a one-hole production blast for two different explosives. Starfield and Pugliese also used a computer model to simulate the compressive strain wave generated in rock from end detonation of short and long cylindrical charges. Although multihole production blasts with long cylindrical charges can be studied, these require a larger test site, such as a small quarry.
Experimental Procedure
The test site should be clear of overburden so that rocks, mud, and loose dirt will not fall into the shotholes and gage holes during the time of testing. In wet weather, an exposed rock surface will provide a better working environment for the field investigators.
The drill-hole collars should be on high ground so that surface water will not flow into the holes. If water is present, the holes may be ringed with grout. In all cases, the holes should be plugged when not being used.
Measurements of direct longitudinal and, in some cases, shear wave motions generated within a rock from explosive detonations have been made with strain gages. Pressure gages, displacement gages, velocity gages, and accelerometer. The recording equipment and gage mounting techniques are also described in the references.
The gage to be used must have the sensitivity and frequency response necessary for accurately measuring the wave motion in rock. For measurements in model tests, refer to the chapter, “Stress Waves Generated in Rock by Explosives in Laboratory Tests”.
The drill holes in the arrays are vertical and bottomed so that the gages and charges placed in the holes have a common horizon. The holes in the central part of the array contain the gages, and the holes located at each end hold the charge. The charges and gages should be located at a distance from any free face (1) to eliminate the possibility of cratering and (2) to eliminate the effects of reflected waves on the direct longitudinal and shear waves arriving at the gage position. Likewise, the drill holes are placed in undamaged rock to eliminate internal reflection and gross attenuation of these direct waves.
The length of the arrays can vary depending on the number of shotholes and gage holes and the distance over which the wave propagation is to be measured. Although one, two, or three arrays can be employed, these arrays should be far enough apart so that blasting in one array will not damage the rock near any of the other arrays. The linear arrays should be parallel to each other so that any anisotropic effects will be common to each array.
An example of array length would be 140 ft; if three arrays are used, spaced at least 50 ft apart, the rectangular test site area needed would be 140 by 100 ft. Hole depths of 30 ft have been used for 3-ft cylindrical charges , and 50-ft depths have been used for cylindrical charges 27 ft long.
A factorial design should be used to randomize the effects of variation in the rock, shot to gage distance, and repeated shooting in the same hole.
Data Reduction and Analysis
Seismic wave propagation laws are important in determining the amplitude and shape of the wave form at distances comparable with the burden in production blasting. The shape of the waveform impinging on a vertical free face is important in measuring rock breakage by the reflection mechanism. The falloff of amplitude and change of frequency of the waveform can be determined by the linear array method.
Given the shot-to-gage distances, the longitudinal and shear wave propagation velocities in the seismic zone can be determined from the arrival times of the waveform at the gages. The propagation velocity is the reciprocal of the slope drawn through the arrival time-distance data plotted on linear coordinates.
Displacement and velocity records can be differentiated with respect to time to provide velocity and acceleration records respectively. Velocity and acceleration records can also be integrated to provide displacement and velocity records.
Vibrations Produced by Surface or Underground Blasting
Parameters
Vibrations produced by surface or underground blasting are measured in terms of amplitude and attenuation with distance.
Applications
The amplitude and attenuation of ground vibrations are significant parameters that help describe the character of rock masses and could be used as an indication of rock mass strengths in advance of excavation. Regression analysis to determine the attenuation of explosion-generated vibrations has been used extensively by the Bureau of Mines. The principal applications have been
- To develop propagation equations for seismic parameters of quarry or underground blasts.
- To suggest a safe charge weight per delay to be used in blasting in urban areas.
- To study the effect of a presplit crack in reducing vibrations.
- To study the effect of decoupling on an explosion-generated strain pulse.
- To predict and record vibrations from nuclear events.
- To compare explosives by measuring their strain wave output.
Although the references listed do not represent a complete bibliography on each subject, they illustrate how regression analysis of vibration data has been used to study specific problems. Although most of the referenced work was done with open pit blasts, essentially similar techniques have been applied to the underground study at White Pine, Mich.
Experimental Procedure
After an accurate survey of the test area has been made, the gage array is designed, and the gage stations are located and surveyed. The method of gage emplacement varies with the type and size of gage used and with the formation (rock or soil) in which the vibrations are being measured. In rock, directly mounting the gage to the rock with epoxy is the most positive system. Other systems for use in rock include a cylindrical mount cemented into the borehole, an expansion mount in a borehole, and an external mount bolted to the rock onto which the gages are secured with threaded studs. Extreme care is required to insure that the mount does not damp the vibrations transmitted to the gage or introduce a high-frequency resonance into the system. In soil, the gage is usually buried.
After the gage line has been established, the major geologic features in the area should be recorded to correlate with anomalies in the vibration data.
Seismic measurements usually involve particle velocity, particle acceleration or particle displacement, although strain is sometimes measured, The gages used to measure particle velocity, particle acceleration and particle dlsplacment are the velocity gage, the accelerometer, and the strain gage, respectively. The emplaced gage is connected by an appropriate cable to the recording equipment which may be either a direct-writing oscillograph or an FM magnetic tape recorder. With the direct-writing oscillograph, the signal from the gage is passed through an appropriate amplifier and recorded directly. With the tape recorder, the signal is recorded on tape and later played back through another amplifier onto an oscillograph. The tape recorder has a wider dynamic response and greater flexibility. Since the amplification and speed can be varied during playback, the investigator can produce an optimum record for analyzing both amplitude and frequency. This feature may be important when the operator is inexperienced or when he is working under unfamiliar conditions where vibration amplitudes and frequencies are difficult to predict.
Expected vibration amplitudes are estimated from the size of the shot, the distance of the shot from the individual gages, and prior experience. Amplifier gains are set for the expected amplitudes and gage sensitivities. The amplitudes are overestimated rather than underestimated so that the recorded traces will not be overdriven. After the gains are set and checked, all equipment is checked out to see that it is functioning properly. Before the blaster is ready to fire the shot, the recording equipment is turned on. When the recording equipment has been checked out and reaches full chart driving speed, the operator signals to fire the blast. The equipment is turned off when the operator is sure all the significant vibration data have been recorded.
Data Reduction and Analysis
Measurements obtained under field conditions are subject to normal instrumental errors as well as to data scatter caused by the inhomogeneous nature of rock and soil. Since repeatability is often of a low order, the data are best analyzed statistically. An explanation of one of the more common analytic procedures follows; this analytical procedure was used in the quarry blast studies. Another analytic technique was employed in the underground studies and is described in detail by Olson and Fogelson.
Log-log plots of maximum amplitude as a function of distance have shown that the amplitudes attenuate according to a power law. For acceleration, dimensional analysis has shown the form of the propagation equation to be
AWb = K(D/W)n………………………………………………………….(1)
where A is acceleration,
W is the charge weight,
K is an empirical site constant,
D is the distance between the charge and the gage,
b is the scaling factor,
and n is the slope of the regression line.
The range of charge sizes fired at a site should be at least two orders of magnitude to give a realistic estimate of the scaling factor. The data from each shot are fitted to a least-squares regression line. Normally, several repetitions of each charge size are fired. Shots of the same size are tested statistically to see if one regression line can be fitted through the data.
The regression lines from all the shots at the site are then tested to see if they have a common slope. If a common slope is found, it is fitted through the midpoints of each regression line, and new extrapolated intercepts are calculated. From the plot of the intercepts as a function of their charge weights, the scaling factor, b, and the site constant, K, are computed. When the gages are far enough from the charge to assume a point source condition, scaling factors near 0.33 (cube root) are common, but when recording vibrations closer to long, cylindrical charges, scaling factors near 0.5 (square root) often result. A propagation equation thus obtained is valid only for the site at which the tests were performed, since each site has its characteristic K and n, and even b.
The property of attenuation reflects, and is governed by the elastic properties of the rock mass. It may also be a useful estimator of in situ rock strength since it is affected by faults and joints, factors that are of importance in determining the strength of an excavated opening.
Properties Related to Inelastic Deformation and Strength of Surface
Abrasiveness
Property
Abrasiveness is assessed in terms of relative abrasiveness, g.
Use of Property
Relative abrasiveness is used as a drillability index for diamond drilling as shown in two previous reports.
Sample Preparation
Approximately 2,500 g of the desired rock type is prepared by chipping and crushing. A 1,600-g sample from the chips that pass through a ¾-in screen and are held on a 3/8-in screen, is divided into four 400-g (±1 g) charges with a sample splitter.
Apparatus
The apparatus consists of a steel paddle rotating at 627 rpm within a steel drum rotating at 74 rpm in the same direction. The dimensions are shown in figure 34.
The steel chosen for the paddles was an oil-hardened, nondeforming, precision ground flat stock (18 by 1 by ¼ in). The steel has the following chemical analysis; Carbon, 0.90 pct; silicon, 1.20 pct; tungsten, 0.50 pct; chromium, 0.50 pct; vanadium, 0.20 pct. The paddles were cut to 3-in lengths and numbered.
The drum is lined with a wire mesh to lift the crushed rock up so that it will cascade into the path of the rotating paddle.
Analytical Procedure
The new paddles are wiped off with acetone and cleaned in an ultrasonic cleaner in a soap solution and distilled water for 15 min each.
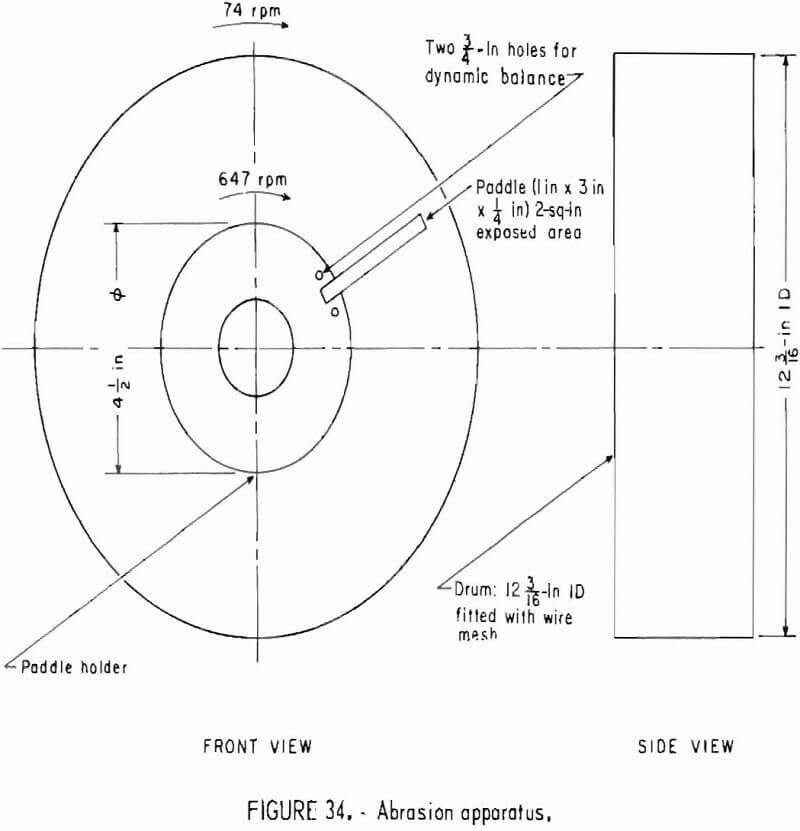
Then they are oven dried and placed in a desiccator for at least 24 hr. The paddles are weighed to the nearest 0.1 mg.
The drum is loaded with a presized charge of 400 g of rock, and the pre-weighed paddle is inserted into the slot in the hub. The abrasion apparatus is run for exactly 15 min. The paddle is removed and cleaned in the ultrasonic cleaner and dried and weighed as described earlier. To avoid the effects of work-hardening on the paddle surface, the drum is cleaned, and the procedure is repeated four times. The total weight loss of the paddle is an indication of the abrasiveness or toughness of the rock. To obtain a good average for the relative abrasiveness, three tests should be run. The test method has been described by Burbank. The product from the tester can be given a standard screen analysis to find the relative friability of the material.
Data Reduction and Analysis
The relative abrasiveness is the mean paddle weight loss for three tests. The weight loss for each test is the total weight loss for the four runs.
Comminution Resistance
Property
Comminution resistance is assessed in terms of coefficient of rock strength, f, energy/unit volume.
Use of Property
This strength parameter of rock is used as a drillability index in percussive drilling.
Specimen Preparation
Ten rough rock samples of about 7.5 cm³ (7 ,500 mm³) (7.5 x 10 -6 m³) are prepared by chipping or crushing the parent rock specimen or sorting by screening to select the minus 1-in (25.4-mm), plus ¾-in (19.1-mm) material.
Apparatus
The test apparatus consists of a steel tube 3 in (76 mm) ID by 26 in (660 mm) long fitted into a hardened base that serves as a sample holder. A 5.3-lb (2.36-N) cylindrical weight suspended 25 in (635 mm) above the samples provides a means for fragmenting the sample under an impact load (fig. 35).
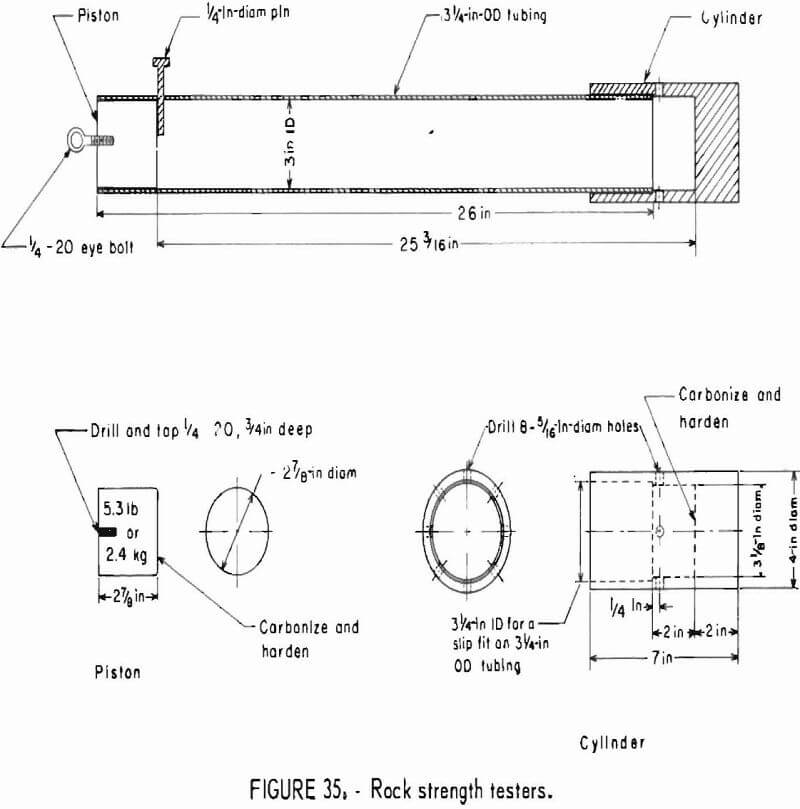
Test Conditions and Limitations
Because this test is performed on the sample in the same condition as it was when chipped or crushed from the parent rock specimen, the original condition of the rock should be retained as much as possible.
Analytical Procedure
The relative strength of rock is measured by a modification of the original Protodyakonov test, which is based on the concept that the energy required to break a certain volume of rock is proportional to the strength
The five groups of broken samples are combined and screened, and the undersize of 0.5 mm is weighed. The weight divided by the density of the sample W/P, gives the solid volume, V, of the minus 0.5-mm material.
Data Reduction and Analysis
The coefficient of rock strength, f, is expressed as the ratio of the number of drops of the weight, n, to the calculated volume, V, of the minus 0.5-mm material produced.
f = n/V…………………………………………..(1)
where volume (cm³) = W/P;
W = weight of the minus 0.5-mm material,
and P = density of the material.
In practice, after the coefficient of rock strength is determined for one assay, a larger or smaller number of drops is tried to determine the minimum coefficient of rock strength number. The minimum coefficient of rock strength number is used because it represents the most efficient use of energy required to produce the minus 0.5-mm material. After a minimum coefficient of rock strength number had been found, two additional determinations should be made to verify the result.
The coefficient of rock strength correlates to some extent with the volumetric resilience, R, the value of which is determined by

where σo = compressive strength,
and K = bulk modulus of the rock.
The relationship between the coefficient of rock strength and the volumetric resilience is shown in figure 36, from which the following empirical equation is derived:
f = 0.54R0.422…………………………………………(3)
Table 8 shows the values of the coefficient of rock strength and its relevant properties for some of the rock types used in percussive drillability study at the Bureau’s Twin Cities Mining Research Center. The relationship between energy per unit volume of rock removed by percussive drilling and the coefficient of rock strength is shown in figure 37.

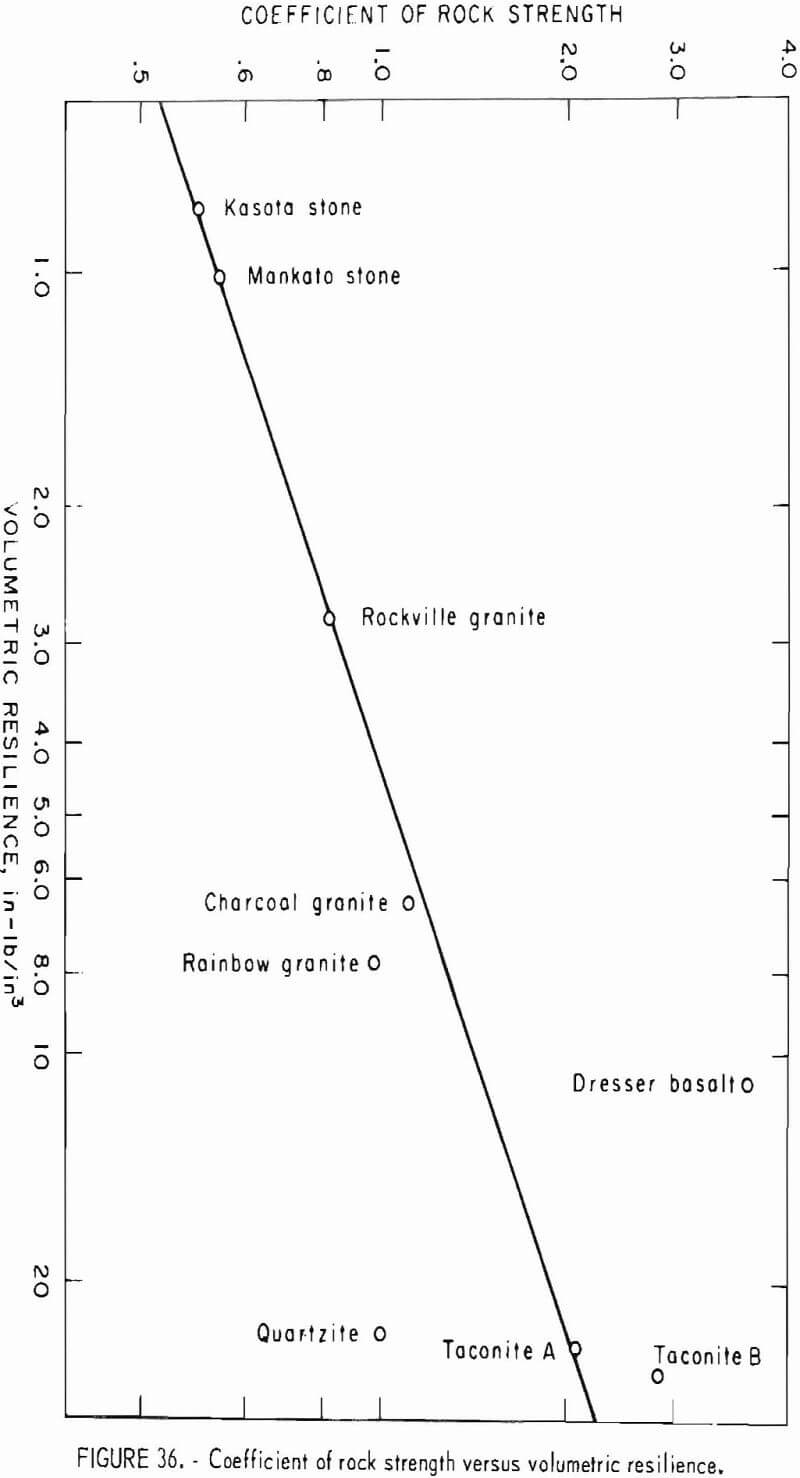
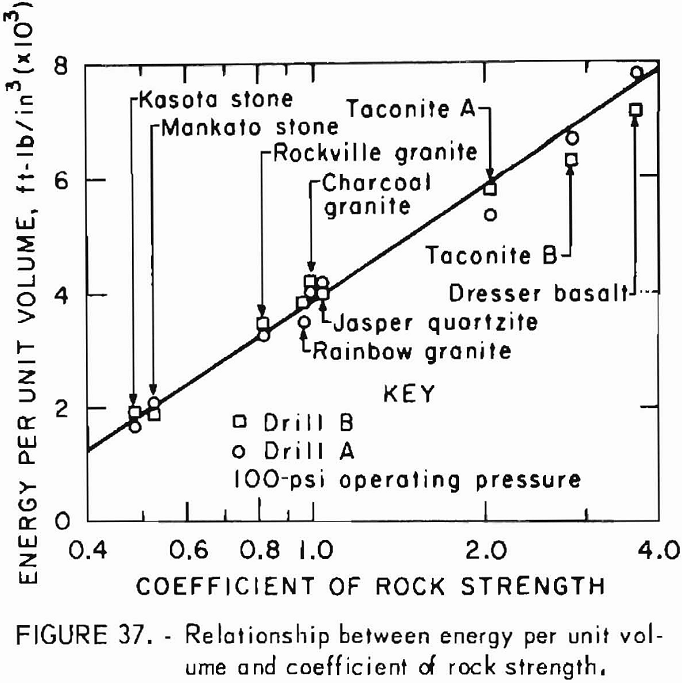
Inelastic Deformation of Surface
Property
Shore scleroscope hardness, dimensionless, is used in determining the relative inelastic deformation of surface.
Use of Property
This surface property is used to determine a relative hardness number for minerals and rocks that can be correlated with indentation hardness scales.
Specimen Preparation
The rock specimens are prepared in a convenient size and shape with at least two parallel ground or lapped surfaces. The distance between the parallel surfaces must be less than 3 in. The most commonly used specimen is a core with prepared ends that is later used for other mechanical property tests. With the use of a V-block, the test can be performed on a 1/8-in flat ground on the side of the core.
Apparatus
The Shore scleroscope used (fig. 38) consists of a frame from which a diamond-tipped hammer is dropped from a fixed height onto the specimen surface.
The principle measurement is based on the observation that the harder the material, the higher the rebound of the hammer. Since some of the energy of the falling hammer is dissipated by producing a minute indentation on the specimen surface, the height of the hammer rebound is always less than the fixed height. Height of rebound is indicated by the pointer on a dial gage. Scale divisions on the dial are predetermined by dividing into 100 equal parts the range from zero rebound of the hammer to average rebound of standard quenched tool steel. Twenty more scale divisions are added to adapt the instrument to testing materials harder than the quenched tool steel standard.
Test Conditions and Limitations
Tests are carried out on air-dried specimens at room temperature
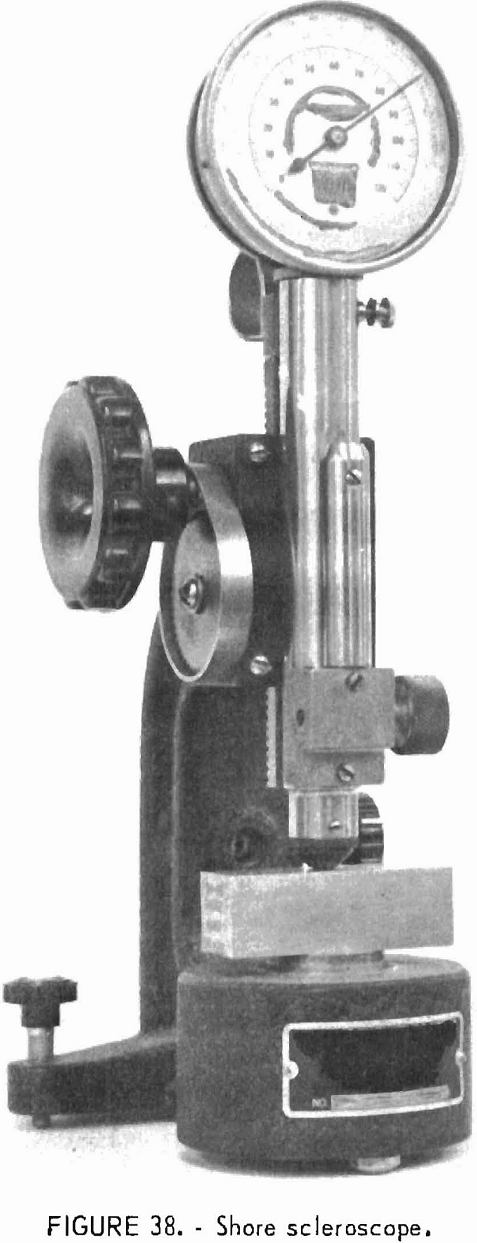
Analytical Procedure
The test specimen is placed upright on the base of the instrument, and the hammer is dropped. The amount of rebound of the hammer is read from the dial indicator of the instrument. Five drops are made along an arbitrary diametral axis of the test surface of the core. The core is then rotated 90° on its longitudinal axis, and five more drops are made. The same procedure is repeated at the opposite end of the specimen to give a total of 20 readings for each specimen. Ten specimens of each rock are tested for a total of 200 drops.
Data Reduction and Analysis
The Shore hardness number (dimensionless) is taken as the mean value of the 200 dial readings obtained in the test. This number is a relative measure of hardness that can be correlated with indentation hardness scale.
Inelastic Deformation of Surface Under Oscillatory Point Load
Property
Pendulum sclerometer hardness, λ-¹ (dimensionless) is used to determine the inelastic deformation of surface under oscillatory point load.
Use of Property
Pendulum sclerometer hardness is a surface property used to determine an index related to the cutting, drilling, and comminution hardness of a rock.
Specimen Preparation
Although the size of the sample is not critical, a convenient size is about 2 by 2 by ½ in. The 2- by 2-in test face should be polished on one face with 120 grit, or finer, silicon carbide. A lapping machine is used to assure a uniform surface.
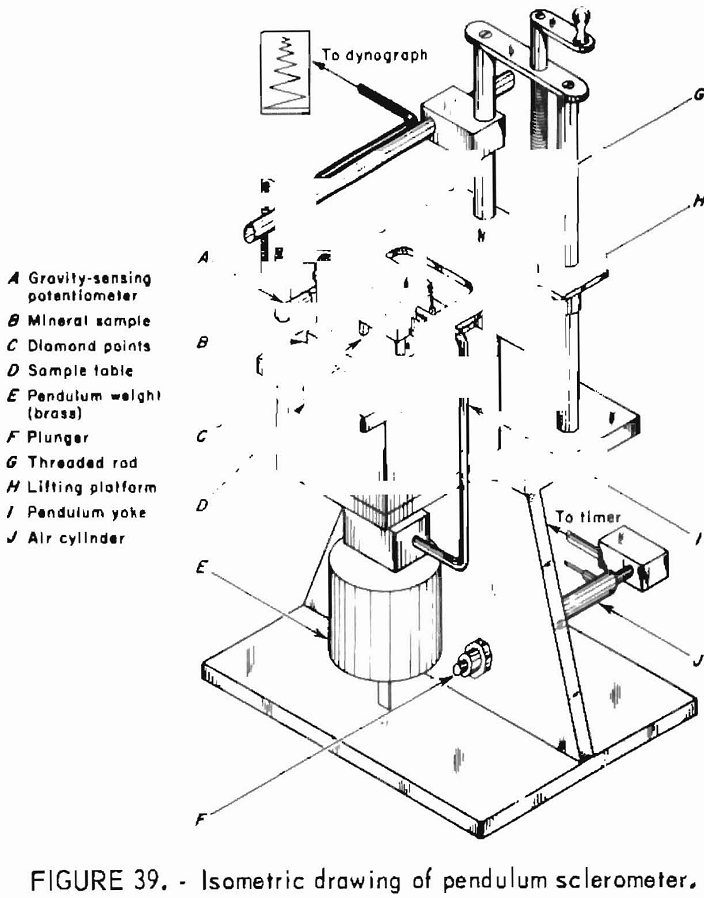
The pendulum sclerometer apparatus is shown in figure 39. The movable part consists of a yoke in the form of a rectangular frame, I, supporting a plastic block holding two diamond points , C. The lower part of the pendulum yoke is fixed in another plastic part connected to a short rod holding the brass pendulum weight, E. The length of this rod, which controls the period of the pendulum oscillations, is adjusted to give a period equal to 1 sec.
Test Conditions and Limitations
This test can be applied to any rock specimen with a flat, polished surface or to smooth-surfaced blocks of metals or alloys. The test should be confined to materials ranging in hardness from 1 to 9 on Mohs’ scale of hardness, equivalent to a pendulum sclerometer hardness range of about 20 to 1,600.
Analytical Procedure
The pendulum weight is supported by the lifting platform, H, (fig. 39) through the rectangular framework or yoke I. The pendulum is lowered to allow its weight to rest on the two diamond points, C, contacting the mineral sample, B. The threaded rod, G, lowers or raises the platform, H, and therefore the pendulum. In the raised position, the points do not touch the sample, and the points can be changed or moved to vary the test site or the specimen. In the lowered position, with the diamond points resting on the sample, angular displacement of the plunger, F, starts the oscillatory motion. The air cylinder sets the plunger in motion. When the cylinder returns, a coordinated timing switch starts a clock.
The oscillatory motion of the pendulum is dissipated in the force causing penetration of the diamond points into the sample. The oscillations decay with time at a rate dependent upon the hardness of the sample; that is,
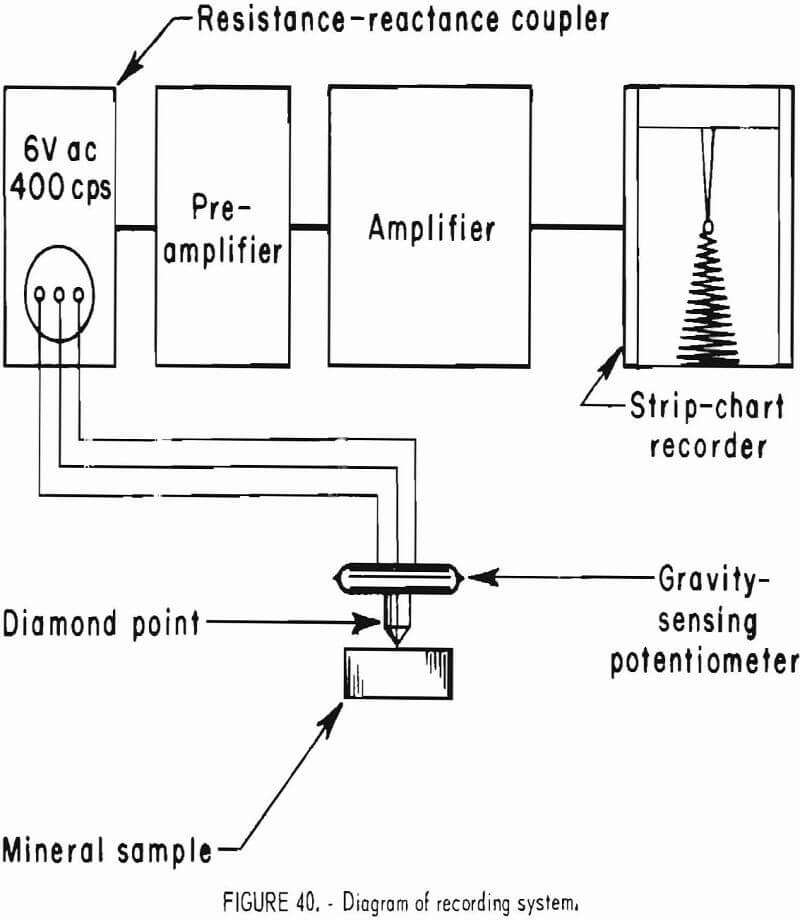
relatively soft samples allow more rapid penetration of the diamond points and, therefore, more rapid decay of pendulum motion.
An electrolytic gravity-sensing potentiometer, A, continuously indicates the angular position of the yoke. This device, which changes resistance as a function of angle of inclination, is located on the frame of the pendulum yoke at the same elevation as the diamond points. It is connected to a resistance-reactance coupler of a recorder that supplies 6 V at 400-Hz excitation (fig. 40). The oscillations of the pendulum are recorded on a strip chart that usually moves at 5 mm/sec.
A typical recorder trace for a very soft mineral is shown in figure 41. In this trace, after about 0.5 min the amplitude is one-half the initial amplitude.
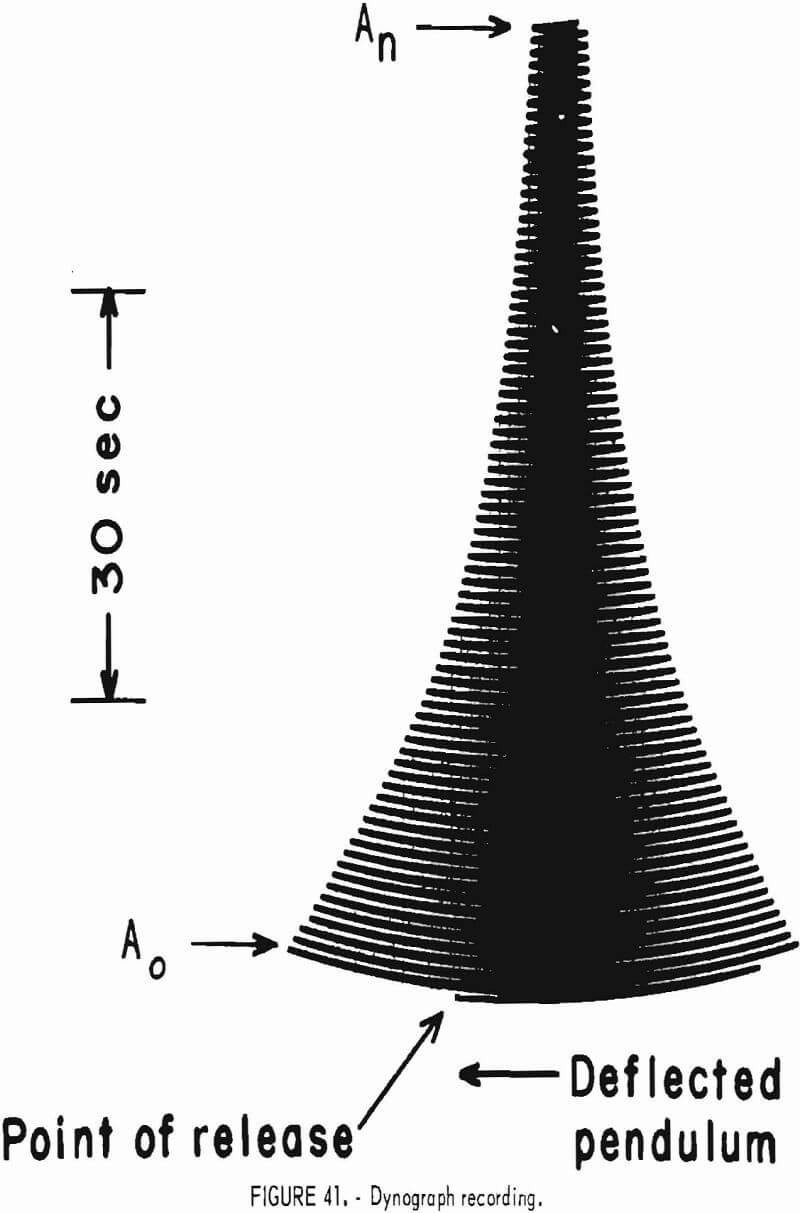
Data Reduction and Analysis
The equation governing the pendulum motion is found in the general expression for harmonic-damped oscillations;

where An = amplitude in mm after n periods,
A0 = Initial amplitude in mm,
e = base of Naperian logarithms,
λ = pendulum damping coefficient,
and n = number of periods.
This equation can be given a more usable form to find the reciprocal of λ (λ-¹):

The values of λ-¹ are dimensionless numbers ranging from about 40 to over 1,600 for minerals of hardness comparable with Mohs scale range 2 to 9. The λ-¹ value has been termed the specific damping.
A sample calculation, using equation 2, gives this result:

When working with rock samples, it has been found necessary to obtain about 30 A0/An ratios. These are most conveniently obtained by taking measurements at 10 different sites on the rock and running 3-min tests on each site. The A0 and A60 become the first A0/An ratio, the A60 and A120 become the next A0/An ratio, etc. It is valid to use the same penetration site for three (or more) determinations, since the diamond points are continuously moving deeper into new layers of possibly slightly different texture or composition.
Figure 42 shows a curve of pendulum specific damping values, λ-¹, as functions of microhardness values for all of the classical Mohs minerals except talc (Mohs hardness = 1), topaz 8, and diamond 10.
The microhardness values, expressed in kilograms per square millimeter, are those found by Bowie and Taylor. Correlation is fairly good, considering that both series of values are on a linear scale. Some workers consider apatite a poor choice for the Mohs’ rank of number 5 since it lies somewhat off the smooth curve.
Figure 43 displays specific damping as a function of Mohs’ hardness number, again for all Mohs’ values except 1, 8, and 10. Again the correlation is good except for apatite.
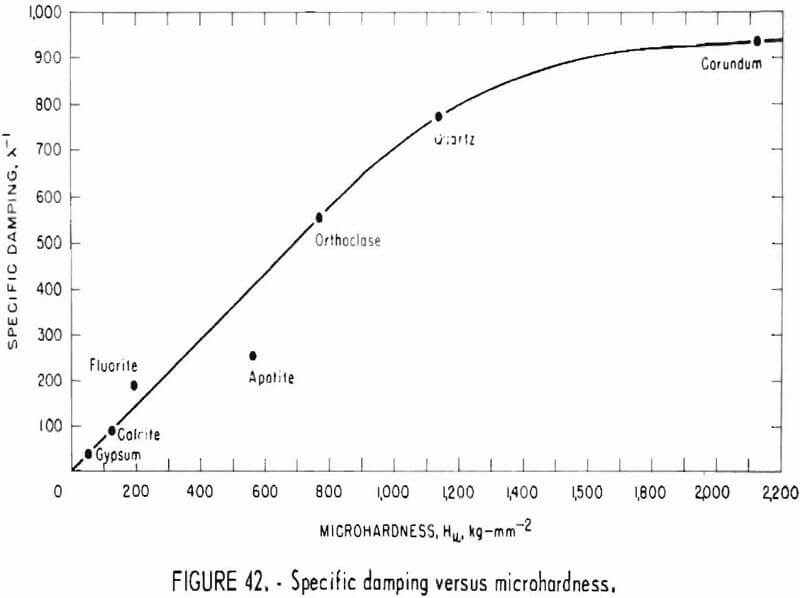
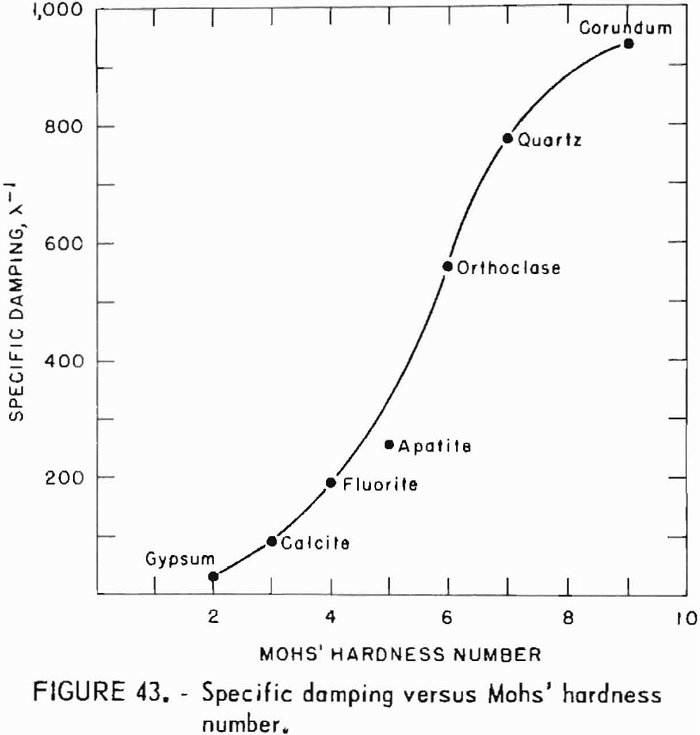
Figure 44 plots specific damping as a function of surface energy values for the same Mohs’ minerals as before. The surface energy values are those reported by Kuznetsov. The curve shows only fair correlation because of the break near the orthoclase value.
Interfacial Phenomena (Solid/Solid)
Property
Interfacial phenomena (solid/solid) is determined in terms of wear, inches, 2.54 x 10-³ m.
Use of Property
Wear, a surface property, is used to determine quantitatively the removal and relocation of material between two solids in sliding contact.
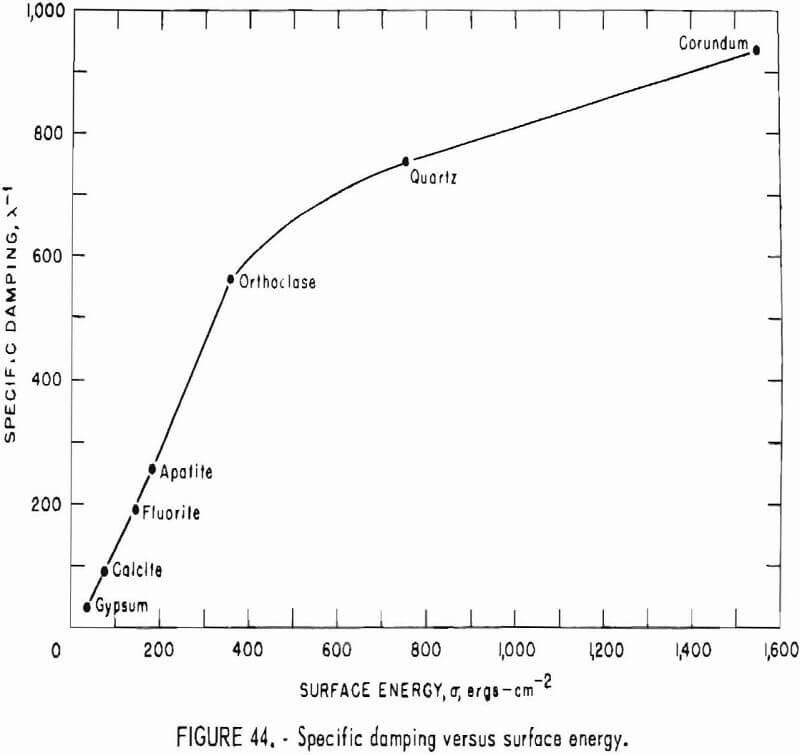
Specimen Preparation, Apparatus, Limitations, and Test Conditions
See “Interfacial Phenomena and Surface Interactions”.
Analytical Procedure
The wear is sensed by a transducer and displayed on a recorder scaled in inches (2.5400 x 10-² m). A typical wear trace is shown in figure 45.
Data Reduction and Analysis
The wear value is obtained from the change in the wear trace as measured by the transducer. In this manner it is possible to measure the total wear to the nearest 0.001 in (2.54000 x 10 -6 m). Figure 46 shows how the concentration of soap solution affects the wear of quartz on diamond matrix material. The soap is an intervening phase in this case.
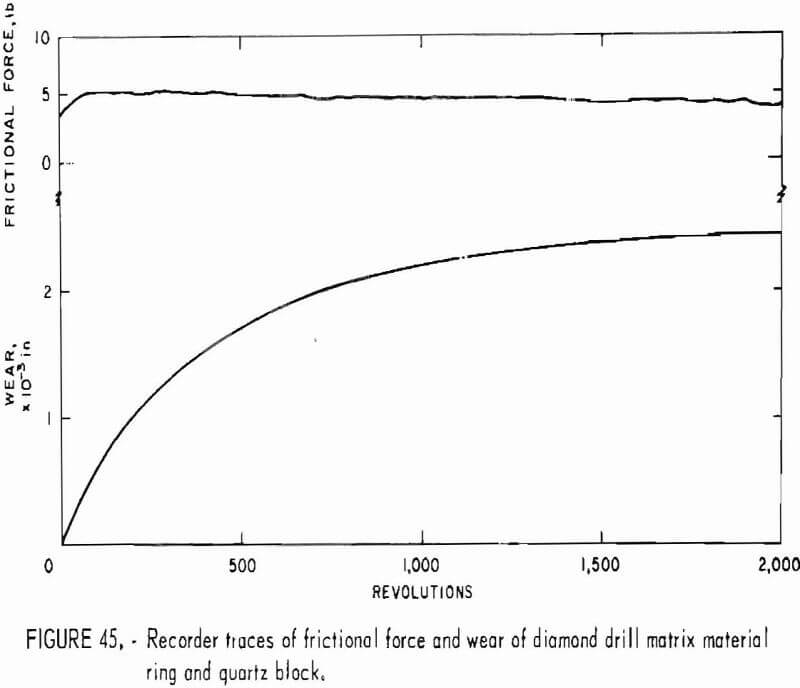
Surface Interaction of Solid/Liquid
Property
Surface interaction of solid/liquid is assessed in terms of streaming potential, Es (millivolts).
Use of Property
The zeta potential of the solid/liquid system is calculated on the basis of the streaming potential. Driving pressure for flow and the solution conductivity are also required for the calculation. The knowledge of the zeta potential assists understanding in the study of the effects of an intervening phase (liquid) between two solids as in boundary lubrication phenomena.
The zeta potential which exists at the solid/liquid interface, is an important parameter in evaluating solid/liquid exchange such as adsorption. Adsorption studies of ionic species at the solid/liquid interface can be evaluated by determining the streaming potential. The model in figure 47
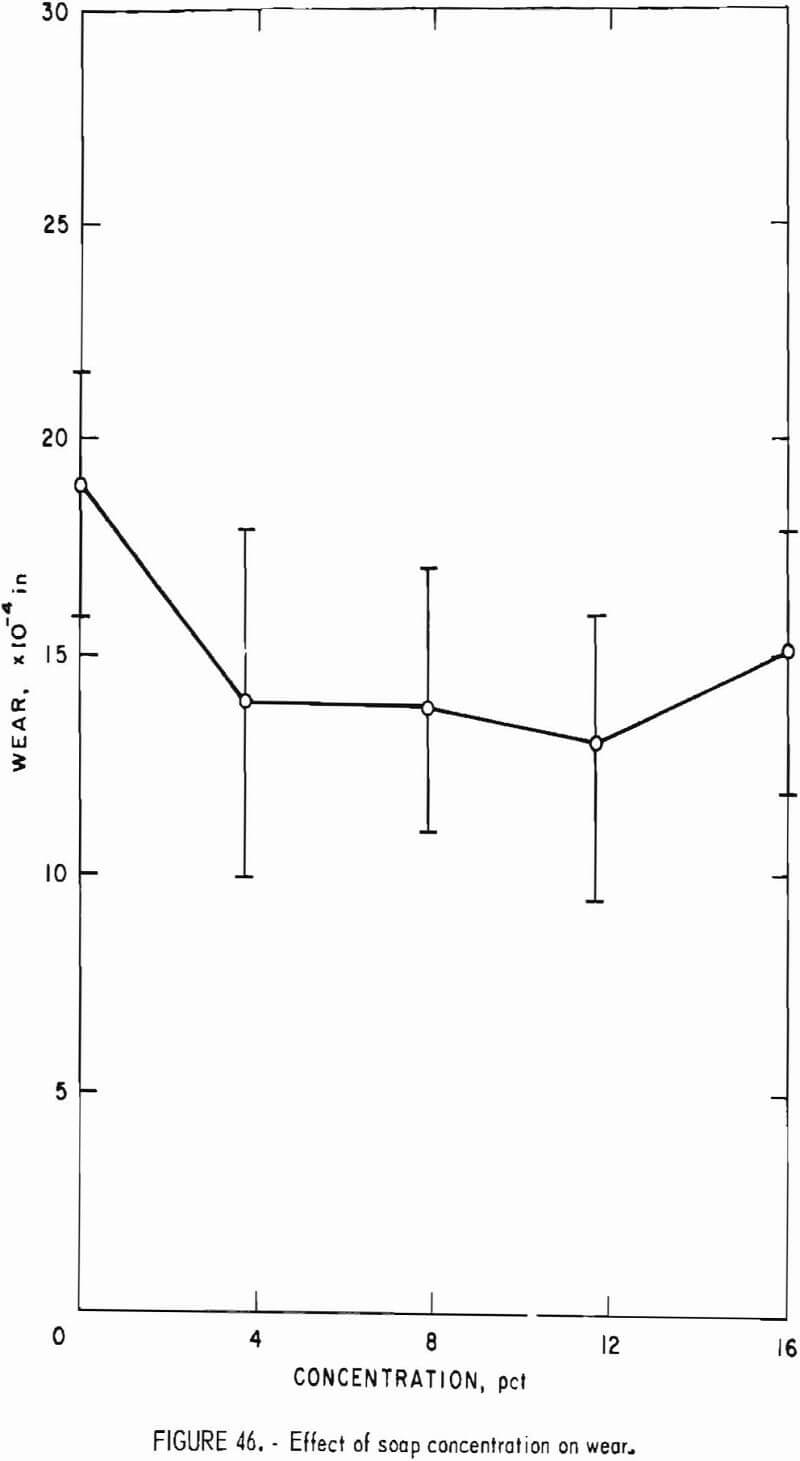
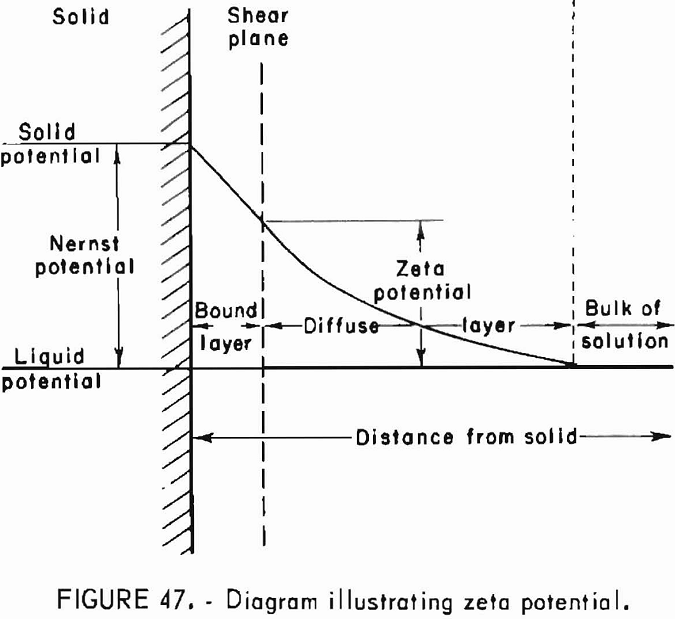
defines the zeta potential as the fall in potential between the outer surface of the adsorbed monolayer of ions on the mineral and the region out in the bulk of the solution where the diffuse layer of hydrated counter ions ceases to exist. In water with very low ionic concentration, the quartz is usually negatively charged; the bound layer (fig. 48) contains cations, and the diffuse layer contains both cations and anions, with a preponderance of anions, most of which cluster near the bound layer.
Specimen Preparation
The streaming potential apparatus (fig. 48) is like that described by many workers, including Fuerstenav, Lorenz, and Osipow.
The packed mineral is held in the glass tube, E, between two platinum-rhodium alloy disks, F, which have many small holes in them and also act as electrodes. A total of about 1,000 ml of solution can be poured into either of the reservoir flasks, A. Nitrogen under pressure, I, feeds through the manifold system to force the solution through the crushed plug of mineral.
Test Conditions and Limitations
This streaming potential measurement procedure can be applied to all minerals classed as nonsoluble. Another restriction is that reactive systems (carbonate-acid solutions) will yield meaningless data, Although the usual solvent is water, streaming potential teats on quartz have been run with acetone. Ionic solutions have even been streamed through particles of paraffin wax, and potentials have been measured.
Analytical Procedure
After being conditioned in the ionic solution, the mineral is transferred as a slurry into the tube (apparatus disassembled and tube held vertical), and the solution is allowed to drain away. More slurry is added until a packed condition is attained upon reassembly of the glassware components. Solution is added in an amount equal to the capacity of one of the reservoir bulbs. An electrometer is connected to the electrodes, and nitrogen under about 4 cm of mercury pressure is routed to the flask with the higher solution level. When the levels in the two bulbs are the same, the hydrostatic head is zero, and
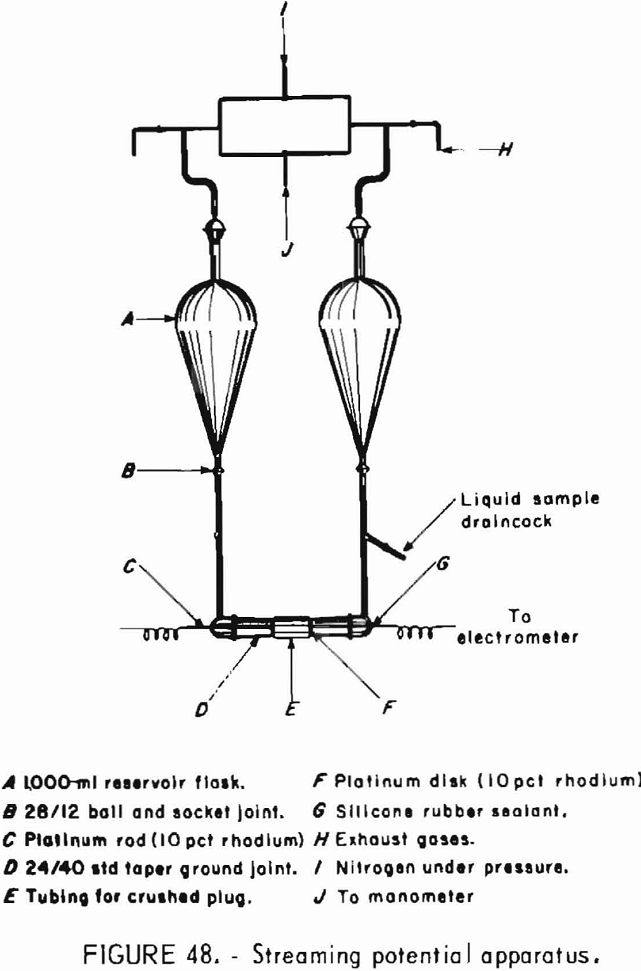
the only driving force is the nitrogen gas. The operator reads the exact driving pressure from a manometer in the system at the moment of equal solution levels and notes the electrometer reading at the same time.
Data Reduction and Analysis
Calculation of the zeta potential can be based upon the following: The transport of charges by the liquid moving through the porous plug creates a streaming potential between the ends of the plug; and this potential causes a conduction current to flow through the plug in a direction opposite to that of the liquid flow.
In the steady state, the convection current, which is proportional to the pressure difference, P, just equals the electrical conduction current, which is proportional to the potential difference, E (streaming potential). The factor of proportionality has been determined mathematically by equation 1 and is independent of the dimensions at the plug of material:

where Es = streaming potential, mV,
ΔP = pressure difference, mm of Hg,
ζ = zeta potential, mV,
Kd = dielectric constant of liquid, dimensionless,
η = viscosity of liquid, centipoise,
and π = specific conductance of liquid, umhos/cm.
For dilute aqueous solutions at 25° C, equation 1 reduces to equation 2, in practical units:

This equation is known as the Helmholtz-Smoluchowski equation. Since the solutions are dilute, the viscosities and dielectric constants of the solutions are considered not significantly different from those of water, and these values for water are used in all zeta potential calculations. Therefore, the experimental measurements are of Es (measured in millivolts), of P (measured in millimeters of mercury), and of π (measured in micromhos per centimeter).
Zeta potential values are usually calculated from the average of five readings of the streaming potential, Es. Figure 49 shows, how the zeta potential varies with the concentration of two different solutes streamed
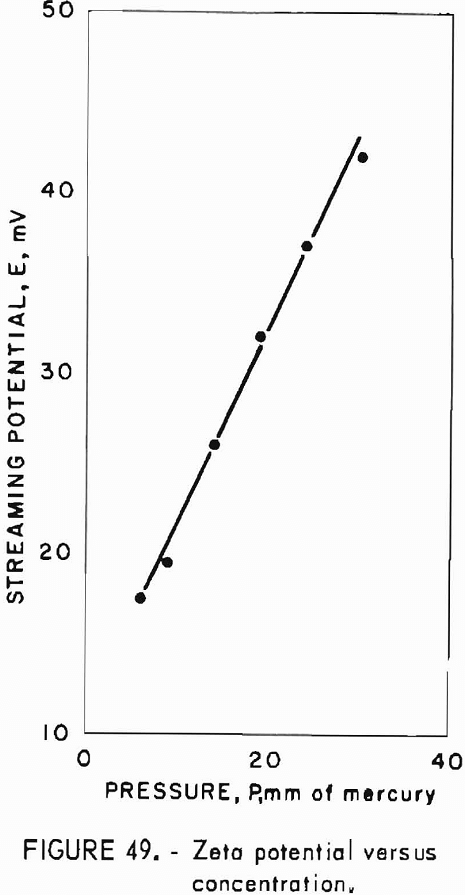
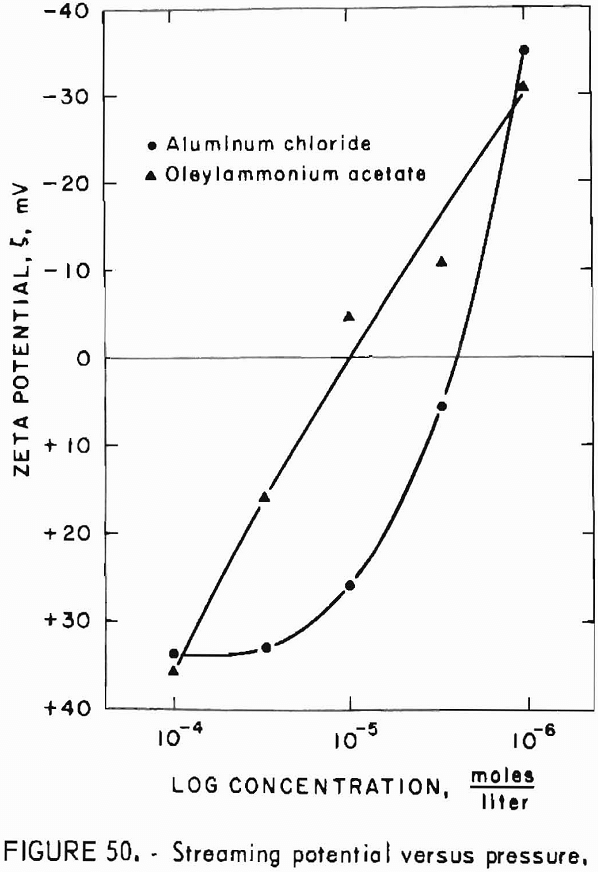
through a crushed plug of Charcoal granite. These typical data were obtained in the fallowing way: The solution with the lowest concentration level, in this instance, 10 -6 M was used first in the streaming potential cell, followed in turn by the next higher concentration level. The concentration levels were raised by adding an appropriate amount of either 10-³ or 10 -4 M solution to the solution already in the cell. One sample of crushed Charcoal granite was used for each solution that was run through it. The curve in figure 50 is derived from experimental values and is given to show the nearly constant value of the ratio E/P, which is a measure of reproducibility. The pressure, P, used in the calculation was read out from a manometer to an accuracy of 1 mm of mercury. The specific conductance, π, was read from the conductance bridge potentiometer with an accuracy of about 1 pct.
Section Two-Physical Properties
Basic Properties
Specific Weight
Property
Bulk density is given in terms of kilograms per cubic meter (kg/m³).
Purpose
Bulk density is used to determine the weight per unit volume of a rock. The specific weight or bulk density is used as a basic parameter in several other tests.
Specimen Preparation
The test sample preparation is controlled by the other tests to be performed. See description under “Volume Measurements”.
Apparatus
A bulk volume measuring system and a precision balance are the only equipment required.
Test Conditions and Limitations
The only limiting condition is the capacity of the measuring instruments. Samples should be dried for 72 hr at 105° C before being weighed.
Analytical Procedure
Bulk volume is determined as described in the section on bulk volume. The sample is accurately weighed on a precision balance.
The ASTM Standard C 20-46 (1961) describes a system for determining the bulk density by weighing in water. The procedure described on page 115 is preferred to the wet method because it permits the testing of materials that are water-sensitive.
Void-To-Bulk Volume Ratio
Property
Porosity, (dimensionless).
Use of Property
Porosity is used to determine the percentage of voids in the bulk volume of a rock.
Specimen Preparation
The bulk volume procedure controls the sample preparation. A sample of any size or shape can be used as long as it will fit in the sample holder (approximately 32-mm diameter and 25-mm depth).
Samples are cleaned in an ultrasonic cleaner to remove any loose particles from the surface and dried for 72 hr at 105° C. Prepared specimens are kept in a desiccator until the measurements are made.
Apparatus
The apparatus consists of a gas supply (helium), a dual-tube, 100-in manometer, a sample holder, and a burette. The burette and sample holder are surrounded by a water jacket supplied from a constant temperature water bath. The sample holder is fitted with inserts and spacers to be used for samples of different sizes (fig. 51).
Test Conditions and Limitations
This test is limited to measuring the surface-connected pores and openings in rock. Although gases other than helium can be used, they reduce slightly the precision of measurements in rocks with very small pore size.
All temperatures must be stabilized before testing begins and atmospheric pressure read on a precision barometer for accurate results
Analytical Procedure
The sample is placed in the sample holder with spacers and inserts added to minimize the void space in the holder. If odd-shaped (not right cylinder) specimens are used, the void space can be filled with glass beads. The sample holder is closed, and the water jacket is put in place. The water pump is started, and the system is allowed to come to equilibrium temperature.
With the vent valve, 4, open, the mercury level Is adjusted to zero with the leveling bulb, 1. Valve 2 is opened and closed to equalize pressure on the small U-tube , 2. With valves and 8 closed, the tank regulator valve, is opened and adjusted to give the desired reading on the dual tube manometer. After the readings have stabilized and been recorded, the
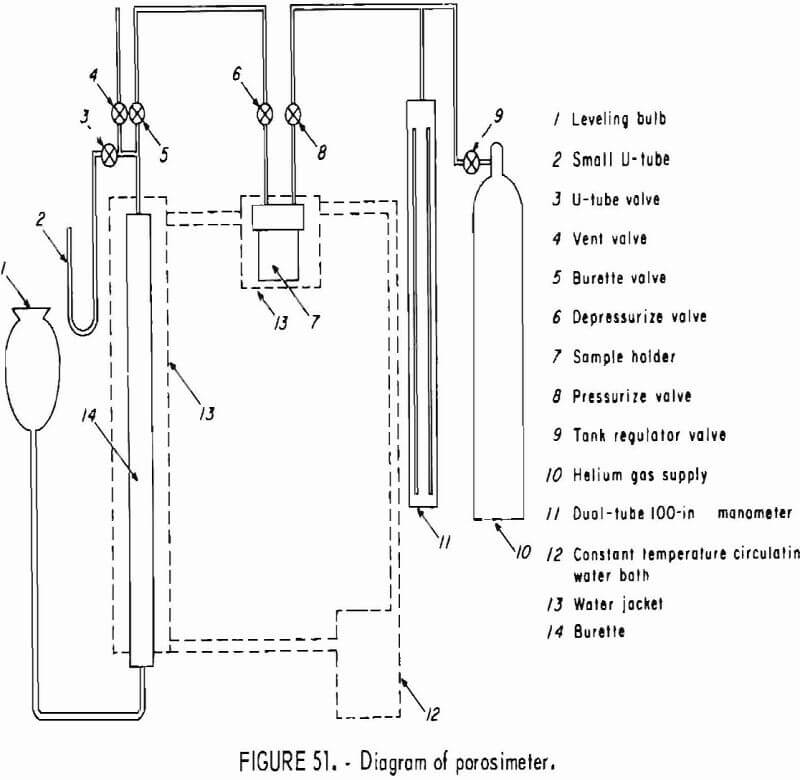
pressurized valve, 8, is opened. After the manometer has restabilized , the pressure valve is closed, valves 5 and 6 are carefully opened, and the gas contained in the sample is allowed to expand into the burette. The leveling bulb is lowered, and the gas in the burette is brought to atmospheric pressure, Final adjustment is made with valve 8 open. The small U-tube is filled with a low vapor pressure organic fluid for greater sensitivity.
Readings recorded during this procedure are the barometric pressure, manometer pressure, burette level, and system temperature. Critical to the operation is that sufficient time be allowed for the gas to stabilize at the system temperature after each expansion. The entire procedure is repeated without the sample to obtain a zero reading.
Data Reduction and Analysis
The void volume in the cell is calculated from the equation

where VB = volume of the bomb, cm³,
Vb = volume of gas measured in the burette , cm³,
Ps = absolute pressure in the bomb (manometer plus barometer), cm,
Pb = absolute pressure of gas in the burette, cm,
and Y = deviation factor from Boyles’ law (table 9).
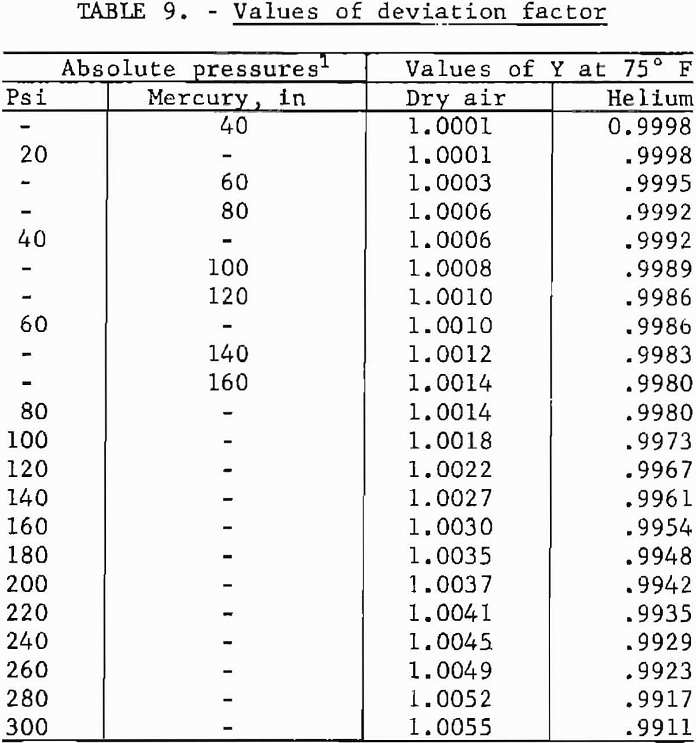
The grain volume of the sample being tested is obtained by subtracting the Vb with the sample from Vs without the sample. The porosity is determined from

where V1 = bulk volume, cm³,
and V2 = grain volume , cm³.
Volume Measurements
Parameter
Bulk volume, cubic centimeters (cm³).
Purpose
Bulk volume is used to determine the true volume (including pore volume) of a rock specimen. The volume of the sample is used in determining other properties including density and permeability.
Specimen Preparation
Samples are normally prepared as right cylinders with a diameter from 8 to 33 mm and a length-to-diameter ratio of 1:1 to 1:2. For fine-grained rocks with no vugs or cavities, the only critical parameter is the size. For coarser grained rocks and those with vugs or cavities , the sample is prepared so that the ends are parallel to within 0.05 mm. Sides are uniform to within 0.05 mm. After being prepared to size, the samples are cleaned ultrasonically
Apparatus
Rocks amenable to the apparatus (see “Test Conditions and Limitations”) are tested in a mercury immersion cell consisting of two vertical hollow cylinders connected at the base (figs. 52-53). The larger stainless steel cylinder has been bored and honed to a uniform internal size. The smaller cylinder is made of precision bore glass tubing with the internal diameter true to 0.0001 in. The larger cylinder is fitted with a cap and plunger to keep the test specimen submerged in the mercury contained in the apparatus. The glass tubing is fitted with a micrometer depth gage. An ammeter and battery power source (not shown in illustration) are connected to the base of the instrument and to the depth gage.
When the mercury immersion cell cannot be used, a micrometer caliper is used.
Test Conditions and Limitations
The use of the mercury immersion cell is limited to those rocks with a pore size small enough to prevent mercury penetration at the test immersion depth. The volume of specimens with a greater pore size is determined by the less accurate measurement with the calipers.
Analytical Procedure
The apparatus is calibrated by immersing a series of precision solids and determining the calibration factor from the formula given in the “Data Reduction and Analysis” section. Separate calibration factors are determined for use with metric or English units. The same procedure is used for calibrating the instrument and for finding an unknown volume. A zero or starting reading of the micrometer is made with the cap and plunger in place by adjusting the micrometer until the point just makes contact with the surface of the mercury as shown by a reading of the ammeter. The specimen is then placed in the larger cylinder and immersed in the mercury by replacing the cap and plunger. Care should be taken to avoid trapping air under the specimen. The micrometer is again adjusted until the point just touches the mercury surface
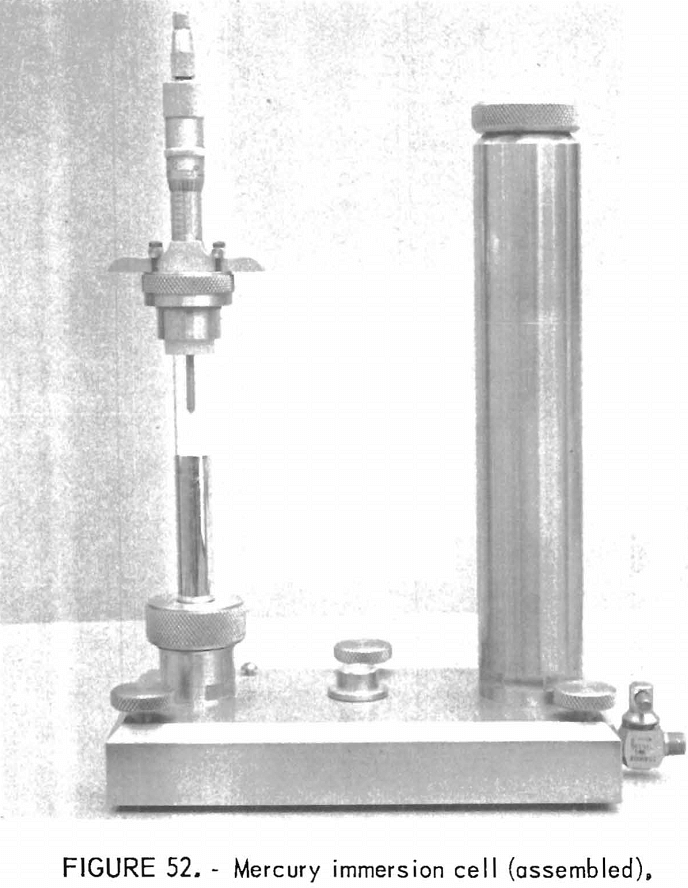
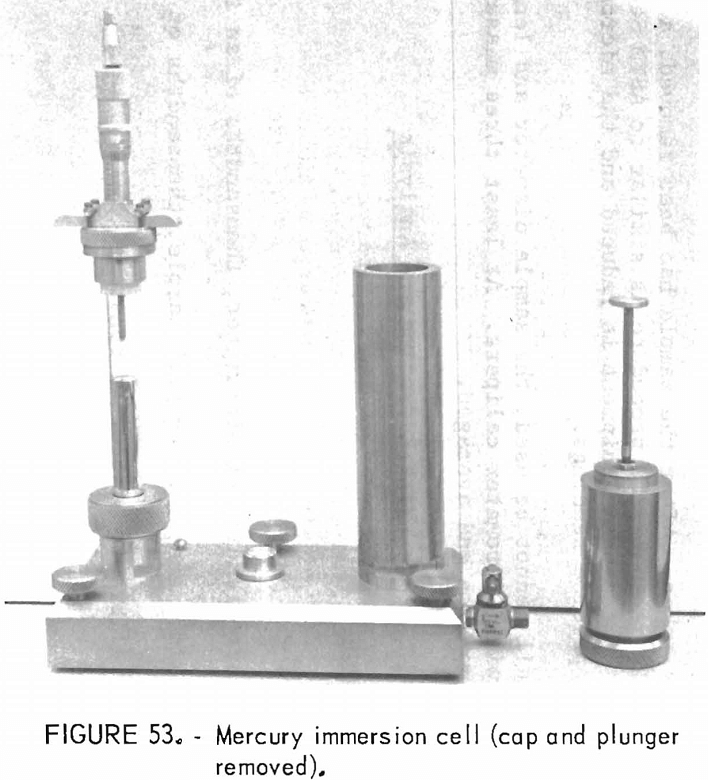
and a reading is taken. After the sample has been removed, a second zero reading is taken. In general, the procedure is similar to ASTM Standard C 493-64 except that the size of the equipment is reduced and the micrometer measurement gives more precise readings.
When the cell cannot be used, the sample diameter and length are carefully measured with micrometer calipers. At least three measurements are made of each dimension and averaged.
Data Reduction and Analysis
Mercury cell:
Voc = (h0 – h1) c
h = zero reading of micrometer, thousandths of an inch,
h1 = micrometer reading with sample, thousandths of an inch,
c = calibration factor, a constant.
Micrometer:
V = πd/4 l
d = average diameter, cm,
l = average length, cm.
Elastic Behavior Under Uniaxial Compression
Properties
Modulus of elasticity or Young’s modulus (compression), E, psi (N/m²); modulus of resilience (compress ion), R, in-lb/in³. (joule/m³)
Use of Properties
Modulus of elasticity is important for engineering applications such as stress analyses and engineering design.
Modulus of resilience represents the capacity of a material to store strain energy per unit volume to the elastic limit.
Specimen Preparation
Since rock is usually anisotropic, source block orientation according to the fabric anisotropy is the first step in preparing test specimens. A petro-physical method, which supplements the conventional petrographic methods for determining fabric anisotropy, is used to locate axes and planes of elastic symmetry and to determine the coring directions of oriented test specimens. This method is nondestructive and involves measuring the longitudinal pulse velocity in several spatial directions in a rock sphere. Velocity values are then plotted on an equal-area net and contoured. The method is described in detail by Thill, Willard, and Bur.
Cylindrical cores are drilled in the most meaningful direction from a portion of the oriented source block free of large cracks or voids.
Specimen size generally meets the ASTM recommendation that the smallest dimension be 10 times the maximum grain size (or the maximum size of other discontinuities such as pores). Although specimen diameter usually is 1 in, 2 in, or larger, smaller diameter cores–for example, ¾ or ½ in may also be used for specific test purposes.
Cores are sawed to a length-to-diameter ratio (L/D) of 2:1 with a diamond saw. If insufficient material is available for a particular test, cores with an L/D ratio ranging from 2:1 to 1:1 are substituted.
Dimensional tolerances conform to ASTM specifications independently verified by Bureau investigators:
- Ends flat within 0.001 in.
- Ends perpendicular to core axis within 0.25°.
- Ends parallel to each other within 0.25°.
- Sides smooth within 0.005 in.
After the core is sawed, the end tolerances are achieved by surface- grinding the core clamped in a V-block.
All specimens are measured for adherence to the prescribed tolerances. End inclination and parallelism are measured with a dial micrometer (0.00005- in divisions) while the core is clamped in a V-block (fig. 54) on a “black granite” surface plate (flat within 0.00005 in). Side roughness is determined with a comparator by projecting the magnified core profile onto a screen. Core axial length and diameter are determined by micrometer readings; the diametrical reading is the average of two measurements at 90° across the center of the core. Length and diameter are measured to the nearest 0.001 cm.
Pronounced surface flaws are detected by visual inspection of specimens. Some rocks, however, contain smaller cracks that may grossly affect the test results. Dye penetrants aid in detecting such flaws to determine the suitability of the specimen for testing.
Apparatus
Compressive loads are provided by a closed loop, servocontrolled hydraulic system. Two such systems are available, rated at 200,000 lb and 500,000 lb. An automatic programmer controls the rate of loading at any predetermined load rate or deformation rate such that the test lasts from less than a second to several days. The applied load is continually monitored by one of the load cells described as follows:
- Baldwin model U2G2 , capacity – 10,000 lb (44 500 N);
- Budd model LCD, capacity – 200,000 lb (890 000 N);
- MTS model 661.31, capacity – 225,000 lb (1 000 kN) ;
- MTS model 661.32, capacity 450,000 lb (2 000 kN).
Load cells are calibrated with proving rings that have been calibrated by the National Bureau of Standards.

Axial deformation of the specimen is measured by compressometers consisting of two linear variable differential transformers (LVDT) or two direct current linear variable displacement transformers (DCLVDT).
Readouts from the load cell and compressometers are plotted by a X-Y recorder or a commercially available four-channel strip recorder. The highest recorder sensitivity range available is 0.02 MV/cm. A data acquisition system is available for putting the output from the various transducers onto punch tape. The tape can then be fed into the IBM 1130 computer for calculating of properties.
Test Conditions and Limitations
A maximum specimen size limitation is imposed by the capacity of the test frame, 500,000 lb or 200,000 lb.
Several conditions that pronouncedly affect test results are the following:
- Dimensional tolerances, particularly the L/D ratio, end inclination, and surface roughness.
- Environment, moisture, and temperature.
- Load or deformation rate.
- Specimen end lubrication.
The first three conditions are accurately controlled; specimen ends are not lubricated.
Test Procedure
Since test results are affected by the moisture/temperature environment in which the specimen is tested, the specimens are preconditioned to a particular test environment. Generally, the specimens are tested in a dry environment at 72° F, the condition arbitrarily chosen as standard. The specimens are first cleaned and then dried in a vacuum oven or desiccator at 150° F. Drying time varies for each type of rock and for different specimen sizes but normally takes from a few days to a week. Before being tested, the specimens are cooled to 72° F and flooded with air dried through a molecular sieve.
When a specific moisture is required, air with the appropriate moisture content is flooded into the pre-conditioning chamber from a humidity control panel. If water-saturated specimens are desired, they are evacuated as previously described but instead of air, water is flooded into the chamber until the specimens are completely immersed. As the cores soak in the water, a slight vacuum is maintained in the chamber above the water to help trapped air bubbles escape.
After being preconditioned, the specimen is positioned between two hardened steel platens centered in
the test machine (fig. 55). Steel end caps, of the same diameter as the specimen, are inserted between the specimen and the platens to reduce stress concentrations at the corners of the specimen. A spherical mating surface is provided between the upper platen and the load cell to allow uniform loading and to compensate for minor misalinement and slight specimen end inclinations.
Two compressometers are seated 180° apart to measure deformation. Since the deformation measurement is taken between the upper and lower platens, any spacer deformation has to be taken into consideration.
The axial load is applied by the electronically controlled movement of a hydraulic actuator mounted in the load frame. The specimens are preloaded slightly by hand manipulation of the controls, which are then switched to an automatic mode by which the programmer controls the application of the load at a predetermined rate.
A wide range of load rates can be applied. Specimens can be loaded at either constant load rates or constant deformation rates, depending upon the transducer used to regulate the servocontrols. A controlled deformation rate is preferred to a controlled load rate since the constant deformation rate curves provide more information on rock behavior under load, specially in the nonlinear regions of deformation. A strain rate of 10 -6 cm/cm/sec is commonly used. Since variations in strain rate or load rate can affect the properties of rock under compression, strain or load rate values should be included in the test results.
Load-deformation data from the load cell and compressometer are plotted by an X-Y recorder. Load is usually recorded in newtons, and deformation is usually recorded in centimeters. Load-deformation data are simultaneously fed into a data acquisition system that converts the electrical signals into a punched tape output , which is fed into the in-house IBM 1130 computer for calculation.
Data Reduction and Analysis
The stress, a, is calculated from the applied load, P, on the load-displacement curve.
σ = P/A………………………………………………….(1)
where A = original cross-sectional area. Axial strain, ε, is derived from
ε = ΔL/L……………………………………………..(2)
where ΔL = axial deformation of specimen,
and L = gage length.
Modulus of elasticity, E, in the linear region of the stress-strain curve for rocks (fig. 56) is defined as:
E = Δσ/Δε……………………………………………(3)
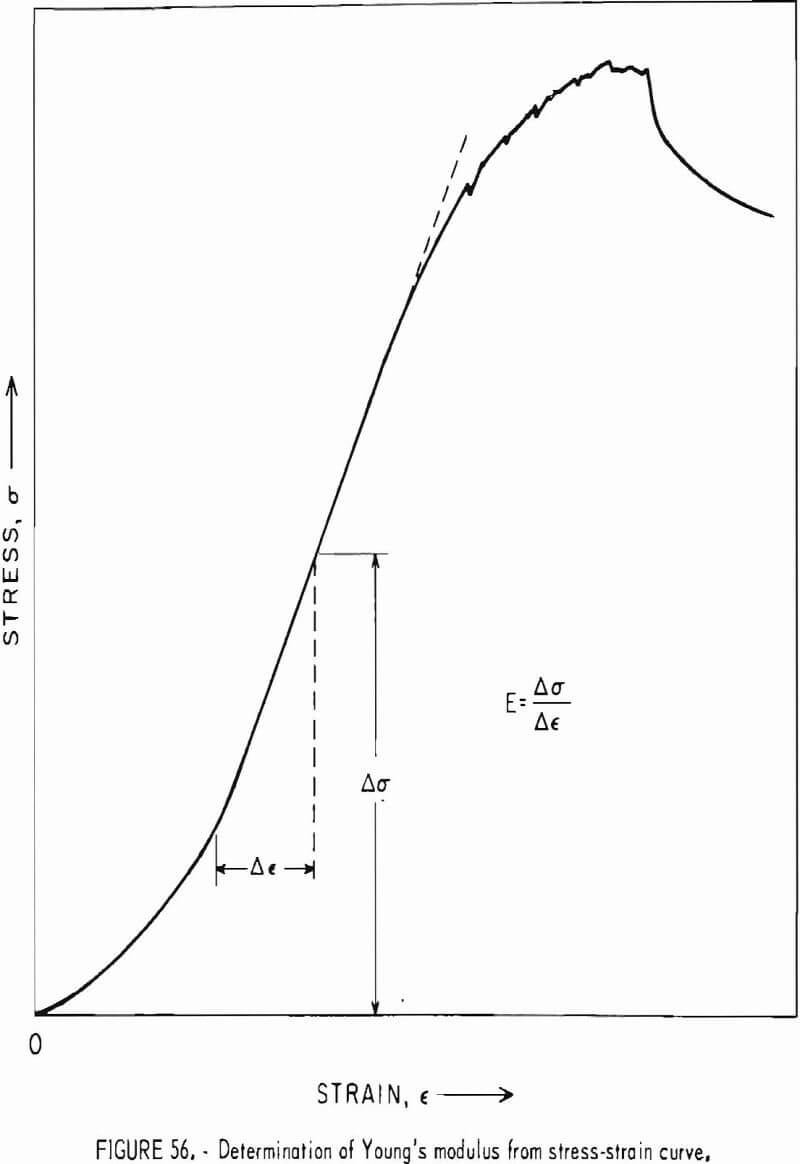
This elastic modulus usually corresponds to the midrange tangent modulus recommended for use in rock testing by Obert and Duvall.
No correction factor has yet been experimentally determined for correcting modulus of elasticity values of specimens with an L/D ratio of less than 2:1.
The modulus of resilience is the amount of strain energy per unit of volume that a given material stores when stressed to the elastic limit.
However, since the elastic limit of rock is often difficult to determine, the compressive strength is used as its approximate value, especially for rocks whose stress-strain relationship is approximately linear.
The modulus of resilience is the area under the stress-strain curve at the compressive strength limit. The modulus of resilience, R, for linearly elastic material can be calculated from modulus of elasticity, E, and compressive strength, σc, as follows:

For nonlinear elastic rocks, the modulus of resilience is estimated by the area under the load-deformation curve divided by the volume of the specimen. The area Is integrated between zero and the maximum load.
Elastic Behavior Under Uniaxial Tension
Property
Modulus of elasticity, or Young’s modulus (tension), E, psi (N/m²).
Use of Property
The property can be readily utilized in fracture mechanics.
Specimen Preparation
See “Elastic Behavior Under Uniaxial Compression”.
Apparatus
Tensile loads are provided by the same testing systems described for “Elastic Behavior Under Uniaxial Compression”. The specimen, cemented between the end caps, is pulled apart through a chain linkage connected to the testing machine (fig. 57). The linkage eliminates bending stress that may be induced in the specimen and, hence, could introduce an error to the calculated tensile strength.
To measure specimen extension, a clip-on extensometer is attached directly to the specimen. This extensometer, with a 1-in-gage length, has a full-scale output of approximately 20 pct strain.
Test Conditions and Limitations
Several conditions can appreciably affect test results:
- Eccentricity of loading and surface roughness.
- Environment, moisture, and temperature.
- Load or deformation rate.
All three of thesis items are accurately controlled.
The only dimensional limitation is imposed by the diameter of end caps currently available. Specimens of ¾, 1, and 2 in can be tested with the present selection of end caps.
Test Procedure
Specimens are preconditioned as described in “Elastic Behavior Under Uniaxial Compression”.
Following preconditioning, each specimen is cemented between two end caps with epoxy structural, adhesive. This assembly is immediately placed in a special fixture to insure axial alinement while the adhesive is curing. As soon as the adhesive is sufficiently cured, the specimen assembly is replaced in the preconditioning chamber until the test is run.
To run the test, each end cap is screwed onto one end of a chain linkage. One chain linkage is attached to the rigid upper crosshead; the other is attached to the piston of the hydraulic actuator.
Deformation can be measured with one or with two extensometers attached to the midspan of the specimen. If two extensometers are used, they are positioned 180° apart to give an “average” reading of deformation.
The tensile load is applied, and load-deformation data are recorded in the same manner as described in “Elastic Behavior Under Uniaxial Compression” (Modulus of Elasticity).
Property
Modulus of elasticity in bending, Eb, psi (N/m²).
Use of Property
It may be helpful to use the value of Eb in evaluating the deflection of mine roof rock.
Specimen Preparation
Although rectangular beam specimens are preferred for testing, cylindrical bars can also be used. Specimens are oriented according to the fabric anisotropy as described In “Elastic Behavior Under Uniaxial Compression”. Beams are rough shaped by cutting with a diamond saw. Final dimensions are achieved by surface grinding the upper, lower, and side faces.
Beam size can be quite variable, but a common size is 8 by 3 by 1 in (20.3 by 7.6 by 2.5 cm). Tolerances are held as follows:
- Top parallel to bottom within 0.25°.
- Side, top, and bottom roughness less than 0.001 in (0.0025 cm).
Cylindrical bar specimens are prepare by drilling a 1- or 2-in core from the source block and cutting to length with a diamond saw. Since side roughness adversely affects tests results, the cores may have to be run through surface grinder attachment that grinds the core sides.
Beam width and thickness and cylindrical bar diameter are measured by micrometer to the nearest 0.001 cm. Parallelism of beam surfaces is measured by placing the beam on a flat surface plate and traversing the upper face
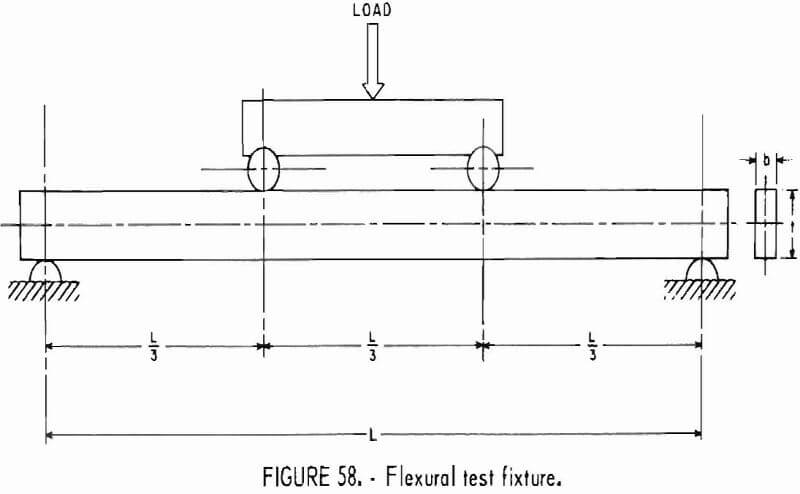
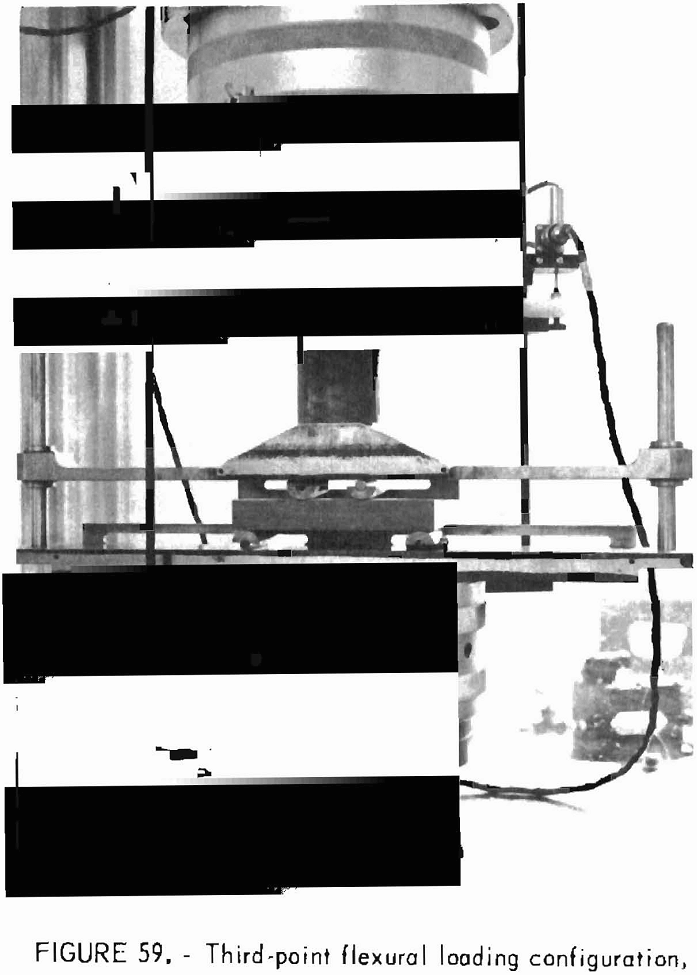
with a dial micrometer (0.00005-in divisions). Roughness measurements for beams and cores are made with a comparator.
Apparatus
The third-point loading recommended by ASTM for concrete is preferred (fig. 58). A special fixture has been designed for running a bending test in the compression testing machine. The load is applied through the upper platen to two 1-in rods that contact the upper surface of the specimen. Two 1-in rods support the specimen at distances three times the distance between load rods. Since all support and load rods are self-adjusting for any skewness developing under load, the bending load is kept as uniform as possible.
Details of the compression system, including load cell specifications and data recording information, are provided in “elastic Behavior Under Uniaxial Compression”.
In addition, deflections are measured by a compressometcr consisting of two LVDT’s or two DCLVDT’s. Compressometer specifications are included in the section, “Elastic Behavior Under Uniaxial Compression”.
Test Conditions and Limitations
Owing to the size of the flexural test fixture the following dimensions are the maximum that can be tested: Length, 18 in; width, 3 in; thickness, 3 in.
Test Procedure
Since moisture and temperature affect test results, the preconditioning environment is accurately controlled, and since load rate also affects test results, the load rate of 100 lb/min is recommended.
Specimens are preconditioned as described in “Elastic Behavior Under Uniaxial Compression”.
The beam or core specimen is centered in the test fixture and the assembly is placed in the compressive testing machine. A vertical load applied to the fixture creates a bending moment in the specimen. As in the compression tests, the load is applied at a constant rate. Beam deflection is measured by two compressometers placed opposite each other along the center line of the upper platens of the test fixture. Load-deflection data are recorded as described in “Elastic Behavior Under Uniaxial Compression”.
Data Reduction and Analysis
Equation 1 is used to determine the modulus of elasticity in bending, F:
Eb =23PL³/1296Id…………………………………………………………………..(1)
where L = span between two supports, in,
P = applied load, lb,
I = cross-sectional area moment of inertia, in 4,
and d = deflection at the midpoint of the beam, in.
Since the load-deflection curve may not be linear, it may be advantageous to use the same reasoning as is applied to Young’s modulus and therefore to calculate the Eb at a midpoint or linear section of the load deflection curve. The resultant value of Eb can be considered only an approximate value since equation 1 assumes that (1) Young’s modulus in compression is the same as in tension, (2) the neutral plane of the loaded beam passes through the midheight of the beam, and (3) the material is isotropic. Rock specimens rarely meet these criteria.
Elastic Response to Ultrasonic Pulse
Properties
Modulus of elasticity, or Young’s modulus, E, dynamic, psi (N/m²) ; bulk modulus, K, dynamic, psi (N/m²); Poisson’s ratio, v, dynamic; modulus of rigidity or shear modulus, G, dynamic, psi (N/m²).
Use of Properties
The counterpart of the static moduli of elasticity, the dynamic moduli describe the relationship between stress and strain in a material when the inertia force is Involved in the problem being considered. The dynamic modulus of elasticity provides a measure of stress to strain in the direction of applied stress; the dynamic bulk modulus is a measure of the compressibility; dynamic Poisson’s ratio relates the lateral strain to that in the direction of applied stress; and the modulus of rigidity gives a measure of the resistance of the elastic solid to shearing deformation.
Specimen Preparation
Specimens generally conform to the tolerance specifications given for mechanical property tests in “Elastic Behavior Under Uniaxial Compression Modulus of Elasticity.” The ultrasonic pulse technique otherwise imposes few restrictions on specimen geometry and size, although in general, cores having length-to-diameter ratios less than about 5:1 are recommended.
Apparatus
The ultrasonic pulse method best suited for determining elastic wave velocities in rock is the pulse transmission method that employs separate driving and receiving transducers (figs. 60-61). The apparatus and adaptations for specific applications are detailed elsewhere.
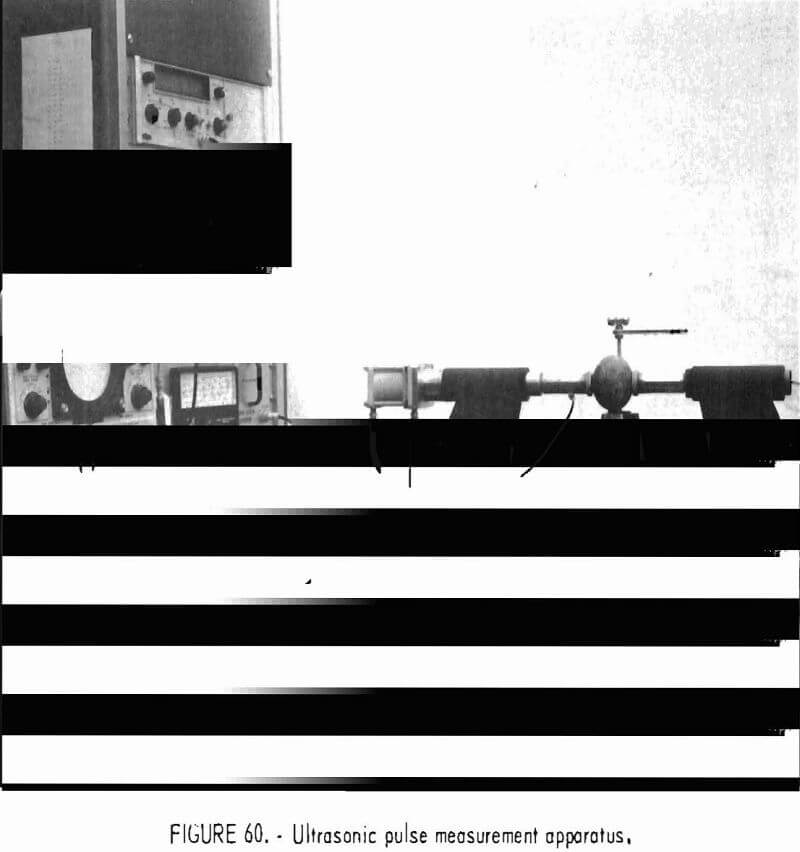
The specially designed acoustical bench in figure 62 is used to hold and accurately orient the test specimen for measurements in rock at ambient laboratory conditions. Other adaptations, such as the compression test setup given in figure 63, are used for velocity determinations in rock during compression tests in controlled environments. Another adaptation that automatically records pulse transit time is shown in figure 64 and is described in detail by Thill and Bur. Transducer elements commonly used for longitudinal wave propagation are lead-zirconate titanate, or barium titanate ceramic disks operating in a thickness expansion mode. For shear wave transmission, ac cut quartz or specially cut ceramic elements are frequently used, or a longitudinal wave is mode converted with suitably cut prisms.
Test Conditions and Limitations
The pulse traveltimes determined in rock are used to compute the elastic wave velocities and, in turn, the dynamic elastic moduli. The ultrasonic
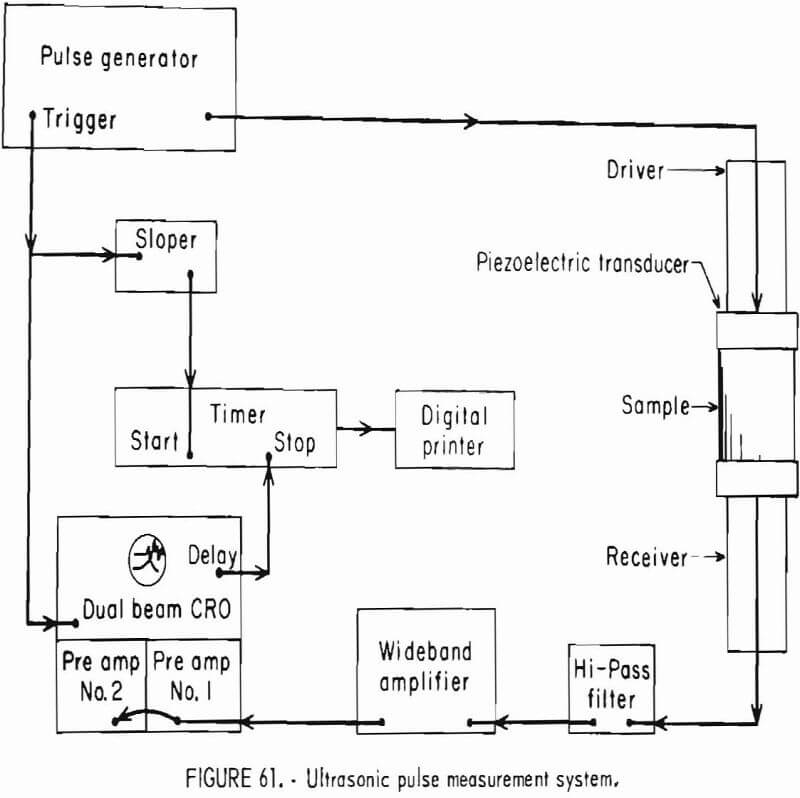
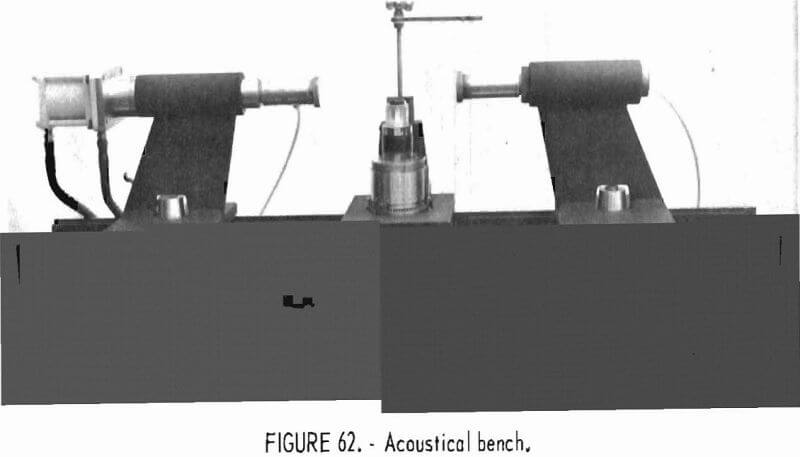
pulse technique can be used under widely varying conditions of temperature, pressure (stress), and moisture. Although the pulse technique is applicable in anisotropic materials, discussion here is restricted to isotropic elastic materials.
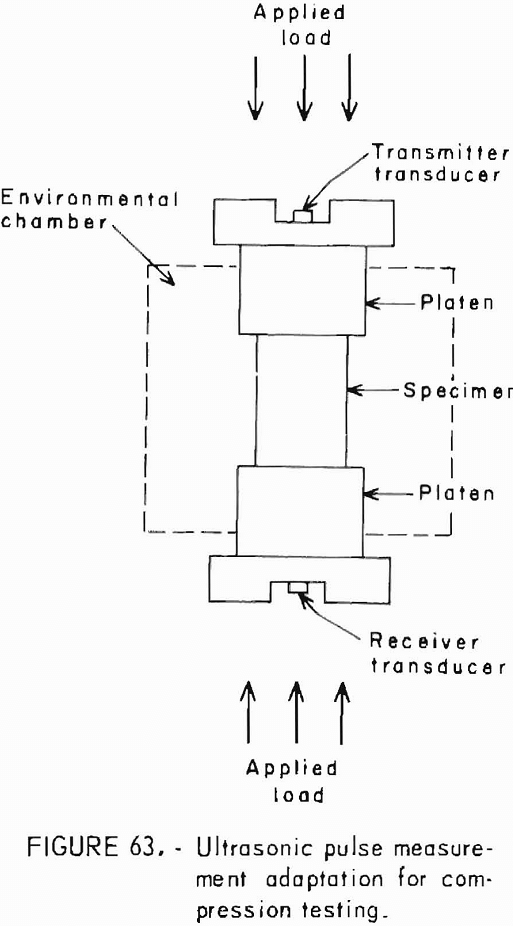
It has been shown experimentally that in order to obtain longitudinal “infinite medium” velocity, Vp specimen dimensions normal to the direction of propagation, d, should be large in comparison with the acoustic wave-length, employed; that is, d/λ > 2. The longitudinal bar of infinitely thin rod velocity, Vo , can be obtained by the pulse method if the d/λ ratio is made small (<0.6) by reducing d or increasing λ. To propagate the longitudinal “infinite plate” velocity, Vpl , wavelength of the pulse must be long compared with the thickness of the plate but short in comparison with the planar dimensions of the plate, in all cases, to avoid excessive attenuation of the transmitted elastic wave, acoustic wavelength should be long in comparison with specimen grain size. Obviously, either specimen dimensions or acoustic wavelength, or both, must be adjusted to conform with these requirements. Often it is convenient to adjust the acoustic wavelength by changing the transducer element for another of a different resonant frequency. For bar and plate velocity measurements, it is usually more convenient to control specimen shape to that of a long, thin bar or a thin plate.
Analytical Procedure
In the pulse transmission technique, a rock is placed between, and in physical contact with, two piezoelectric transducer elements; one acts as a driver, and the other acts as a receiver. A pulse generator supplies a short-duration electrical pulse to the driver transducer. The electrical pulse is converted into a mechanical wave or impact by the driver transducer, and this wave is transmitted to the specimen. After traveling through the test specimen the mechanical pulse, or elastic wave, is picked up by the receiving transducer, reconverted to an electrical signal, and displayed on the screen of a cathode ray oscilloscope (fig. 61). The transit time required for the mechanical pulse to pass through the specimen is used to determine elastic wave velocity. Transit times are displayed on a timer and recorded by a printer or in the automated system, plotted by an X-Y recorder (fig. 64). Amplitude of the pulse used is typically in the range of 50 to 700 V. Pulse rise time, the time that it takes the pulse to rise from 10 to 90 pct of its final amplitude, is typically about 0.2 µsec or less in order to excite the pulse frequencies
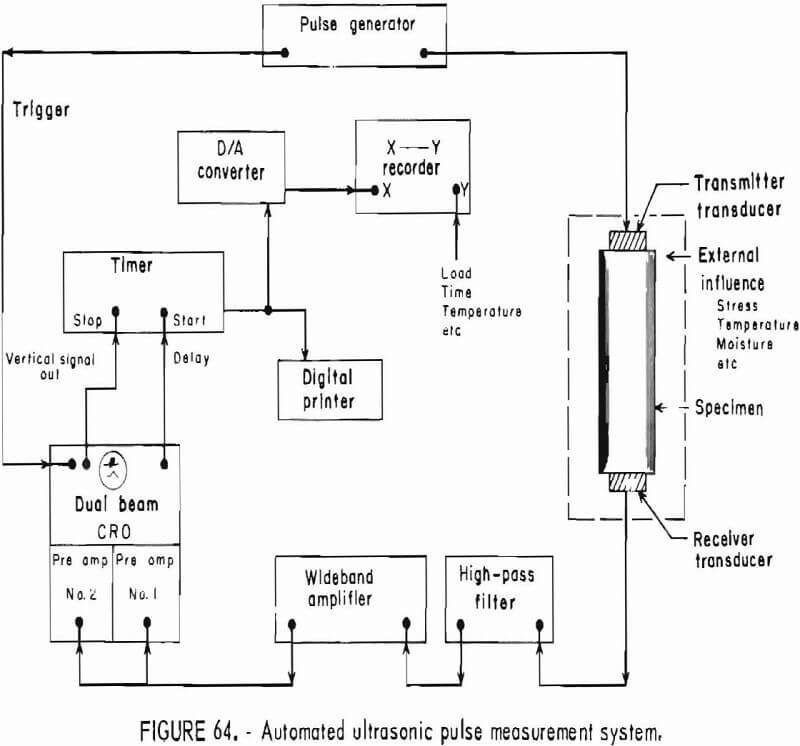
commonly employed in testing rock; that is, those from about 100 kHz to 1 mHz. Pulse length is set in the range from about 1.5 to 10 µsec, and the pulse recurrence frequency usually is set at about 60 Hz. The couplant found most satisfactory for the transfer of longitudinal wave energy between transducer and specimen is one or two thicknesses of plastic electrician’s tape placed over the coverplates of the transducers. Couplants used for shear wave propagation include Salol, Canada balsam, Lakeside 70 cement, and Nonaq stopcock grease.
Data Reduction and Analysis
Elastic wave velocities are calculated by equation 1:
V = st-¹…………………………………………………………………..(1)
where s = distance traversed by the wave in the rock,
and t= pulse transit time in the rock.
Measured transit times are corrected for instrumentation delays, operator errors, system errors, etc. Thill gives a detailed discussion of velocity errors. The maximum percentage error in velocity can be estimated from equation 2:

Typically, this error is less than 1 pct for longitudinal wave velocity determinations and less than 2 pct for most shear wave velocity determinations in laboratory specimens ranging in dimensions from a few centimeters to about a meter.
Given the appropriate wave velocities and density, the modulus of elasticity (Young’s modulus), E, can be computed by the following equations:
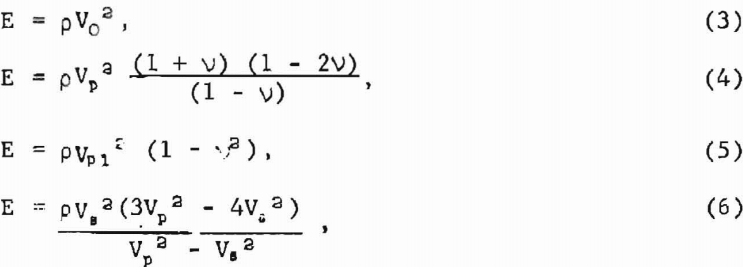
where Vo = longitudinal bar velocity, m/sec,
Vp = longitudinal infinite medium velocity, m/sec,
Vpi = longitudinal plate velocity, m/sec,
Vi = shear velocity, m/sec,
P = density, kg/m³,
and v = Poisson’s ratio, dimensionless, determined from velocity ratios.
The modulus of elasticity may also be determined when other moduli are known using the following identities:
E = 2G(1 + v)…………………………………………………..(7)
and E = 3K(1 – 2v)
where G is the modulus of rigidity, N/m²,
and K is the bulk modulus , N/m².
The bulk modulus may be computed as a function of the pulse velocities, and density may be computed by the following relationships:


The bulk modulus may also be determined when the other moduli are known by the following identities:

Poisson’sratio, V,may be calculated from the pulse velocities and density by the following equations:

Poisson’s ratio may also be determined when the other moduli are known by the identities:

The modulus of rigidity, G, can be expressed as a function of the shear wave velocity, Vs, and density, P that is,
G = PVs²…………………………………………………………(23)
The modulus of rigidity may also be determined when other moduli are known by the identities:

Elastic Response to Induced Vibration
Properties
Elastic response to induced vibration is assessed in terms of (1) modulus of elasticity or Young’s modulus, F, dynamic, psi (N/m²); (2) modulus of rigidity, or shear modulus, G, dynamic, psi (N/m²) ; (3) Poisson’s ratio, dynamic;, and (4) bulk modulus, K, dynamic, psi (N/m²).
Use of Properties
See “Elastic Response to Ultrasonic Pulse”.
Specimen Preparation
Cylindrical rods prepared to the tolerance specifications given in the section “Plastic Behavior Under Uniaxial Compression—Modulus of Elasticity” and having diameter-to-length ratios, d/l<1/5 , are recommended for testing by the resonance method. When material is of insufficient size to obtain cores of the recommended d/l ratio, several smaller segments of an isotropic material may be cemented together without appreciable error in the longitudinal bar resonance measurement. For rock or other aggregate materials, dimensions should be sufficiently great to satisfy the criteria of macroscopic homogeneity.
Apparatus
The block diagram of the resonance apparatus (fig. 65) indicates how mechanical vibrations are induced in the rock and cause it to vibrate as a whole in one of its natural frequency modes as the sine wave oscillator and exciter are tuned to a resonant frequency of the rock. Mechanical vibrations of the test specimen are converted to electrical signals by the crystal pickup, amplified, and monitored on the Y axis of the oscilloscope. The output of the oscillator is fed directly to the X axis of the oscilloscope for comparison with the signal received by the pickup; the frequency is monitored by the frequency counter. A transformer is used for matching the impedance between the oscillator and exciter. Supporting or clamping the specimen at its center produced minimum interference since this is a nodal point for both the fundamental, longitudinal, and torsional modes of vibration. A function generator with a frequency range from 0.008 Hz to 1 MHz and sine wave output of 30 V peak-to-peak maximum Into a 600-ohm load supplies the input signal to the exciter. The exciter used is an electromagnetic record cutting head, whereas the pickup is a crystal phonograph cartridge. Resonant frequencies are
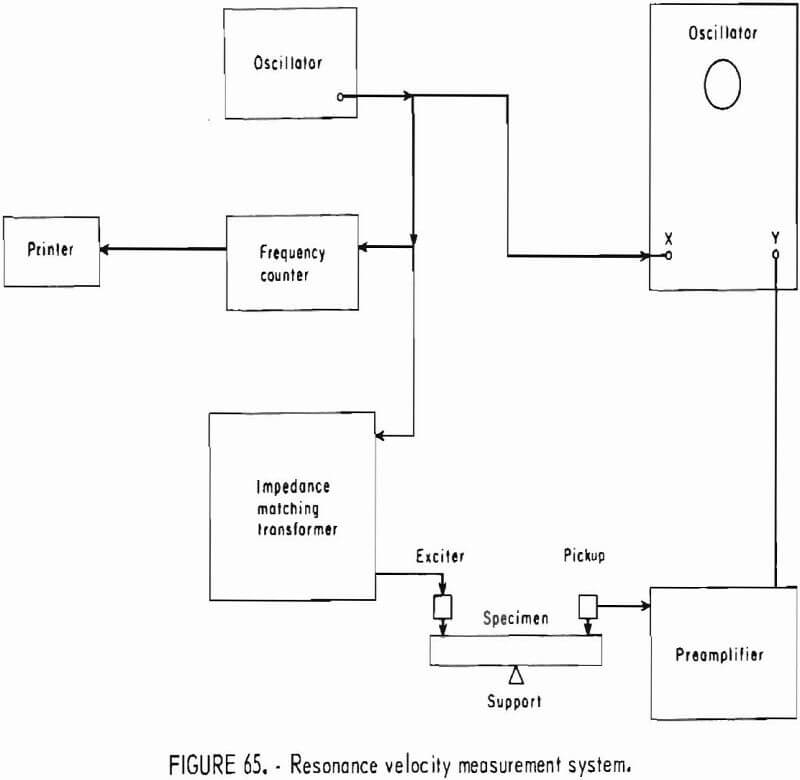
detected by examining the amplitude and phase of the Lissajous figures appearing on the oscilloscope. The frequency of resonance is displayed on an electric counter and recorded on tape by a digital printer.
Frequency can be scanned continuously either by manual tuning or by voltage tuning in an automatic scan adaptation of the basic resonance system (fig. 66). In the automatic frequency scan adaptation, the voltage control generator synchronizes the frequency of the voltage tuned oscillator with the chart motion of the recorder. A switching circuit permits frequencies to be scanned continuously and automatically through any of the four frequency ranges: 3,000 to 9,525 Hz, 7,250 to 13,775 Hz, 12,500 to 19,025 Hz, and 13,750 to 20,275 Hz. The ac signal of the pickup is converted to a representative dc signal by the ac to dc converter, amplified, and recorded by a strip chart recorder. In the automated system, resonant frequencies are determined from the peak amplitudes of the resonance curves.
Test Conditions and Limitations
Although mechanical resonances can be induced in solids of any shape or size and equations for approximating elastic moduli are developed for several specimen shapes (such as prisms of rectangular or square cross section), cylindrical rods are generally recommended if a high degree of accuracy is desired (28). For d/l<1/5, the phase velocity determined from the longitudinal bar resonance frequency is within about 0.5 pct of the true bar
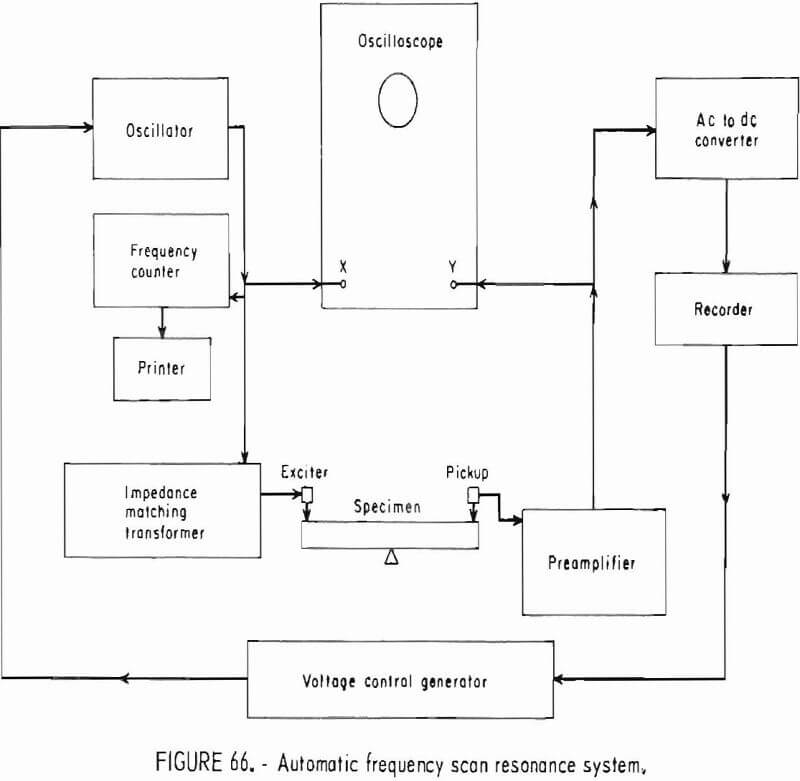
(infinitely thin rod) velocity, Vo. (Whereas, at the fundamental frequency, specimen length is twice the wavelength; that is, λ = 2l.) However, when d/l>1/5, a correction for the Poisson motion of the rod is applied to approximate the true bar velocity. Specimens having large d/l ratios can often be cemented together to get a more favorable d/l. Contrarily, for torsional velocities derived by the resonance method, test conditions for the modulus of rigidity are not restricted to specific d/l ratios.
The resonance method to date has been developed only for use with isotropic materials or in specific directions of certain anisotropic materials.
Analytical Procedure
In resonance testing, the test specimen is supported or clamped at its center, and the exciter and pickup are appropriately positioned to excite and detect either longitudinal or torsional mechanical vibrations. The longitudinal vibrations are induced and picked up in a direction parallel to the axis of the specimen. A range of frequencies is scanned by tuning the oscillator either manually or by voltage controls. As the driving frequency approaches a resonant frequency of the rock, the amplitude of vibration (monitored on the Y axis of the oscilloscope) increases and reaches a peak amplitude at resonance. Frequencies are continuously monitored on the counter, and resonant frequencies are recorded by the printer. In the automated resonance system, the resonant frequencies are picked off at the peak amplitude of the resonance curve recorded on the continuous strip chart plot. The fundamental resonant frequency can be distinguished from overtones for each particular mode of vibration by systematically probing along the length of the specimen with the pickup and noting the resulting changes in the Lissajous figures viewed on the oscillloscope.
For torsional resonance testing, the exciter and pickup are positioned so that torsional vibrations are induced and picked up in a plane normal to the specimen axis.
Data Reduction and Analysis
The equation for obtaining longitudinal bar velocity in isotropic solids is

where fn = resonant frequency of the nth longitudinal mode of vibration, Hz. For the fundamental mode n = 1,
n = 1, 2, 3 order of vibration,
λ = wavelength, m,
l = specimen length, m,
k = the correction factor from Bancroft’s table expressed as a function of Poisson’s ratio and the ratio of the diameter of the bar to the wavelength,
and Vo = longitudinal bar velocity, m/sec.
The modulus of elasticity is determined by equation 2:
E = PVo²…………………………………………………………….(2)
The equation and symbols are those given in the section on “Elastic Response to Ultrasonic Pulse”.
The equation for obtaining the torsional (shear) wave velocity in isotropic solids is
Vt = 2lfn/n…………………………………………………….(3)
where fn = resonant frequency of the nth torsional mode of vibration, Hz, n = 1, 2, 3 order of vibration,
and l = specimen length, m.
The modulus of rigidity, G, is determined by the equation
G = pVt²…………………………………………………(4)
Since the torsional velocity, Vt, is the equivalent of the shear wave velocity, Vs, in isotropic materials, equation 4 is equivalent to equation 23 given in the section on “Elastic Response to Ultrasonic Pulse”, and the relationship of the modulus of rigidity to other moduli is as given there.
The dynamic Poisson’s ratio, V, is obtained from the resonance bar, Vo , and torsional, Vt , velocities by the equation
v = ½ (Vo /Vt)² – 1……………………………………………….(5)
The relationship of Poisson’s ratio to the other moduli is given in the section on “Elastic Response to Ultrasonic Pulse”.
At present, the most convenient and accurate method of determining Poisson’s ratio is to determine the bar velocity, Vo, by the resonance method and the Longitudinal infinite medium velocity, Vp , by the ultrasonic pulse method, and to calculate Poisson’s ratio by the equation given in the section on “Elastic Response to Ultrasonic Pulse”.
The dynamic bulk modulus, K, is obtained from the resonance bar, Vo, and torsional, Vt, velocities by the equation
K = 9 – 3(V0 /Vt • <6>
The relationship of the bulk modulus to the other moduli is given in the section on “Elastic Response to Ultrasonic Pulse”.
Elastic Response to Induced Vibration (Damping Capacity)
Property
Internal friction, Q-¹, (dimensionless).
Use of Property
Internal friction is used to determine damping characteristics by the resonance response of a rock under induced vibration.
Specimen Preparation and Apparatus
See “Elastic Response to Induced Vibration”.
Test Conditions and Limitations
See “Elastic Response to Induced Vibration”.
Analytical Procedure
Vibrations are induced in the specimen by a sinusoidal source of constant amplitude, and the response (amplitude of vibration) of the specimen is measured as a function of frequency. The resonance response curves are plotted on a strip chart by a recorder, and the Q factor is determined from the resonance curves.
Data Reduction and Analysis
The sharpness (or bluntness) of the resonance response curve expressed as Q (or Q-¹) depends upon the damping of the vibrating system and is an indirect measure
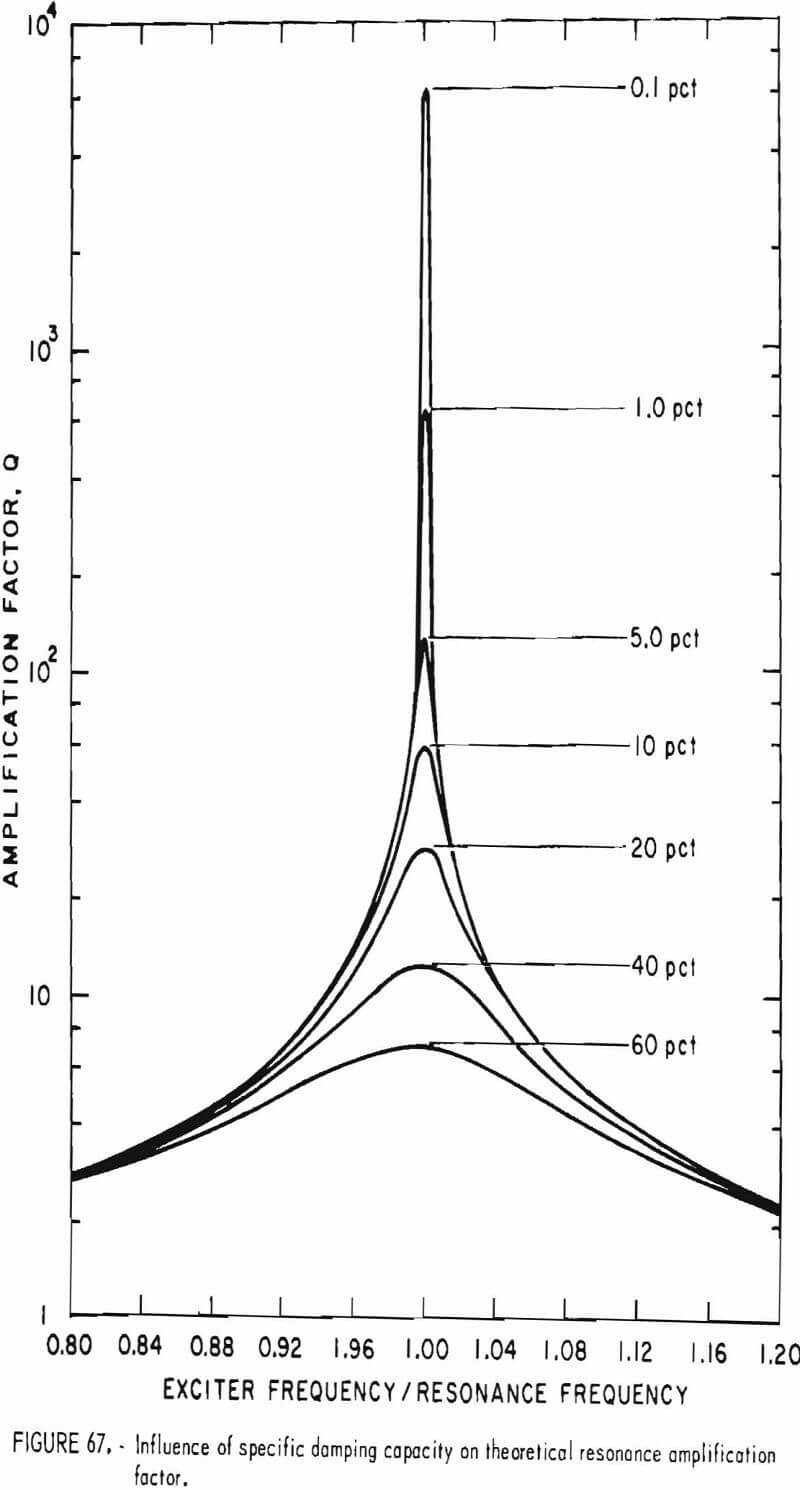
of internal friction. Mechanical Q is sometimes called the quality factor or resonance amplification factor and Q-¹ the bluntness of the resonance curve, internal friction, or coefficient of internal friction. Sharp resonance curves have high Q factors and indicate low internal friction; conversely, blunt curves have low Q factors and indicate high internal friction (fig. 67). The factor Q is derived by the equation
Q = fr/Δf……………………………………..(1)
where fr = resonant frequency (at the peak of the resonance curve),
and Δf = bandwidth of the resonance curve at an amplitude 0.707 or 1/√2 of the maximum vibration amplitude (3 db down).
When damping is small, Q is related to the specific damping capacity, S, and the logarithmic decrement, δ, of a freely vibrating system by the relationship:
Q = π/δ = 2π/S………………………………………………………(2)
and S = ΔU/U………………………………………………………(3)
where ΔU = the energy lost per cycle,
and U = the maximum vibrational energy in that cycle.
Measurements of Q for aluminum, for metals and glasses, and in certain rocks suggest that Q probably is independent of frequency.
Elastic Response to Induced Vibration at Elevated Temperatures
Properties
Modulus of elasticity or Young’s modulus, E, psi (N/m²) ; modulus of rigidity or shear modulus, G, psi (N/m²).
Use of Properties
The properties are used to determine temperature dependence of the elastic properties of rock. Knowledge of the elastic properties of rock at elevated temperature is important in predicting the behavior of rock at high temperatures for the purpose of fragmentation.
Specimen Preparation
Specimens are cut in the shape of a rectangular prism. Good response has been obtained from rock specimens cut and ground to a finished size of 5.000 by 0.750 by 0.188 in. The accuracy of the test results is strongly dependent on the dimensional accuracy of the specimen. Specimens should be free or large chips or cracks.
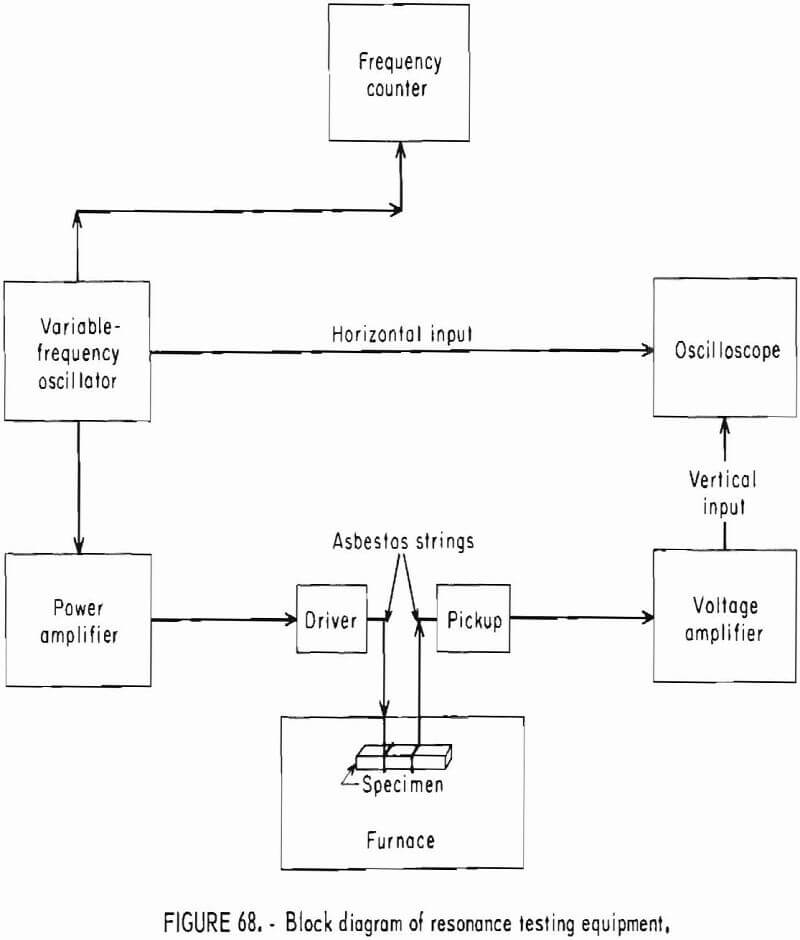
Apparatus
A block diagram of the resonance testing equipment is shown in figure 68. Figure 69 is a photograph showing the specimen suspended in the open furnace. Flexural vibrations are induced in the specimen by an oscillator-driven transducer over a frequency range of 800 to 9,000 Hz. A phonograph cartridge is used to detect the amplitude of vibration of the specimen. The asbestos strings suspending the specimen in the furnace serve as mechanical couplers between the specimen and the driver and pickup equipment. Resonance is indicated by the greatly increased output of the phonocartridge that results when the oscillator is tuned to resonant frequency. The resonant flexural frequency is used to compute the modulus of elasticity.
Test Conditions and Limitations
The equation used to calculate the modulus of elasticity from resonant frequencies is valid for isotropic materials only. Polycrystalline materials will fulfill this condition if the crystalls are randomly oriented and

distributed and smaller (by a factor of 3) than the shortest dimensions of the specimen.
Analytical Procedure
The specimen is suspended in the open furnace, and the oscillator frequency is varied over the range in which the fundamental flexural resonance is expected. When a resonance is found, a probe fashioned out of a phonocartridge is used to trace out the nodes and antinodes of the vibrating specimen and thus determine the type and mode of the vibration. This technique is fully described by Spinner and Tefft. After the flexural resonant frequency has been determined, the furnace is closed and heated to the desired temperature.
Since it is not possible to use the probe to identify the type and mode of vibration after the furnace is closed, it is advisable to track the resonant frequency during the heating by periodically retuning the oscillator. Before the final measurement is made, the furnace is held at the dpsired temperature for at least 1 hr to insure that the specimen is heated uniformly.
Data Reduction and Analysis
Equation 1 is used to compute the modulus of elasticity:
E =- 0.94645 Cmf² /b(1 + αΔT)……………………………………………..(1)
where E = modulus of elasticity (Young’s modulus),
C = shape factor,
m = mass,
f = flexural resonant frequency,
b = dimension of the bar perpendicular to direction of flexural vibration,
α = coefficient of linear thermal expansion,
and ΔT = difference between temperature, T, and room temperature.
Detailed instructions on the use of the above equation can be found with a tabulation of values for C in Hasselman’s tables.
Equation 2 is used to compute the modulus of rigidity:
G = 4LDmf,²/b(l + αΔT)……………………………………………..(2)
where G = modulus of rigidity (shear modulus), psl (N/m²),
L = length,
D = shape factor,
b = dimension of the bar perpendicular to long axis of specimen,
m = mass,
ft = torsional resonant frequency,
α = coefficient of linear thermal expansion,
and ΔT = difference between temperature, T, and room temperature.
Detailed instructions on the use of equation 2 can be found with a tabulation of values for D in Hasselman’s tables.
Figure 70 shows the elastic moduli of Dresser basalt plotted against temperature. The value plotted is the average of measurements made on three samples. The vertical line indicates the data spread at each temperature. Figure 70 also shows a plot of Poisson’s ratio as a function of temperature. Poisson’s ratio, V, is related to the modulus or rigidity, G, and of modulus of elasticity; E, by
v = E/2G – 1……………………………………………………………(3)
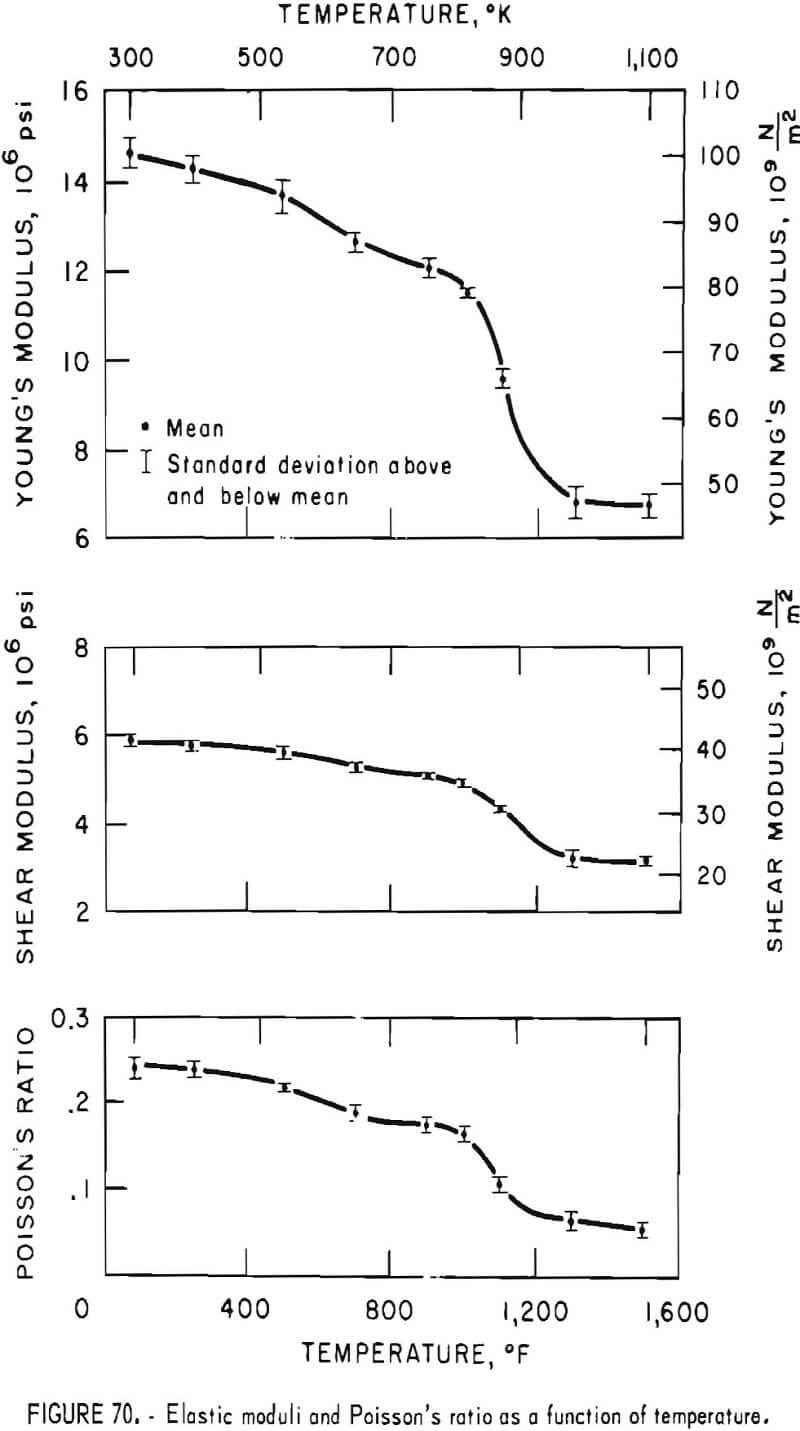
Load-Resisting Ability under Uniaxial Compression
Property
Compressive strength, σa, psi (N/m²).
Use of Property
Compressive strength is the maximum load-carrying capacity of a rock subjected to uniaxial compression. Knowledge of the property is important in designing rock structures and is a useful indicator for drillability and excavation rates.
Specimen Preparation
See “Elastic Behavior Under Uniaxial Compression”.
Apparatus
See “Elastic Behavior Under Uniaxial Compression”.
Test Conditions and Limitation
See “Elastic Behavior Under Uniaxial Compression”.
Test Procedure
See “Elastic Behavior Under Uniaxial Compression”.
Data Reduction and Analysis
The compressive strength is determined from the maximum applied load, P, that the specimen can withstand:
σc = P/A………………………………………………………………(1)
where A = original cross-sectional area, in² (m²).
To correct compressive strengths obtained for specimens with an original length-to-diameter (L/D) ratio other than 2:1, Obert, Windes, and Duvall have developed this empirical equation:
σo = 0.889 σo’ [0.778 + 0.222 (L/D)]………………………………………(2)
where σo is compressive strength of standard specimen (L/D = 2:1) psi,
and σo’ is measured compressive strength from any L/D ratio specimen, psi.
Property
Tensile strength, σt, psi (N/m²).
Use of Property
Tensile strength is the maximum load-bearing capacity of rock subjected to uniaxial tensile stress. Knowledge of the property is important in engineering design for rock structure, hydraulic fracturing of oil wells, and predicting tensile failure of rock.
Specimen Preparation
See “Elastic Behavior Under Uniaxial Compression”.
Apparatus
See “Elastic Behavior Under Uniaxial Compression”.
Test Conditions and Limitations
See “Elastic Behavior Under Uniaxial Compression”.
Test Procedure
See “Elastic Behavior Under Uniaxial Compression”.
Data Reduction and Analysis
The tensile strength is determined from the maximum load, P, applied to the specimen
σt = P/A…………………………………………………………..(1)
where A = the original cross-sectional area, in² (m²).
Load-Resisting Ability Under Diametrical Loading
Property
Tensile strength, σt, psi (N/m²),
Use of Property
Knowledge of the property is important in engineering design for rock structures, hydraulic fracturing, and predicting tensile failure of rock.
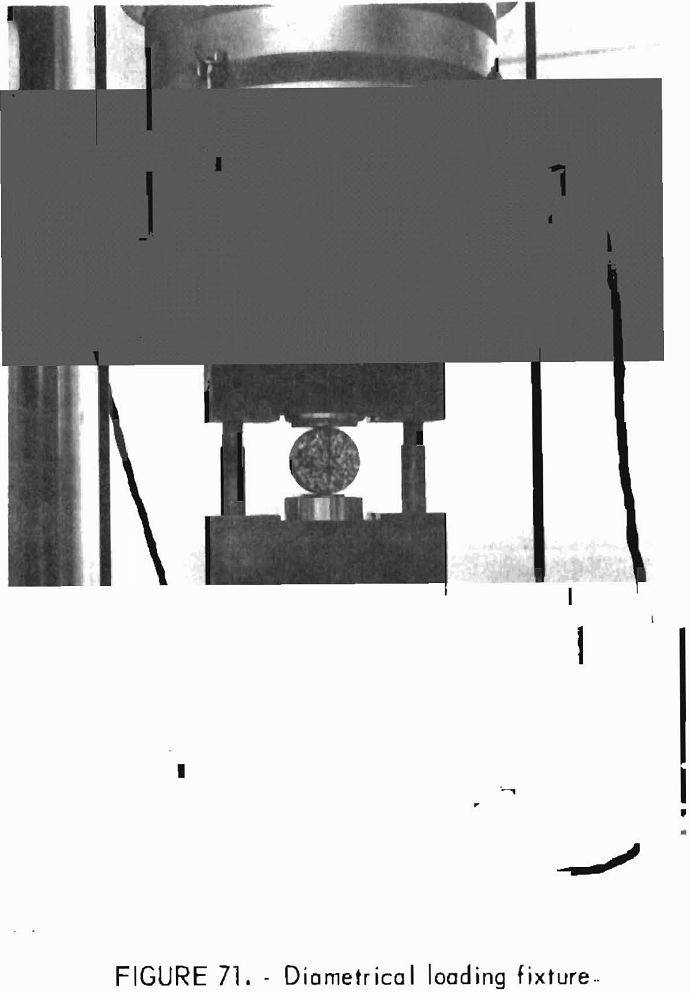
Specimen Preparation
The specimen preparation for tensile strength is the same as that in “Elastic Behavior Under Uniaxial Compression” except that cores (disks) are prepared with a length-to- diameter ratio of 1:2.
Apparatus
A fixture is available for running the diametrical loading test in the compression testing system (fig. 71). In this fixture the specimens are supported by flat 2-in steel plates. These parallel plates exert a diametrically opposed line load on the cylindrical surface of the disk. A hardened steel platen centered on the upper portion of the fixture provides a mating surface with the load cell.
Details of the compression system, including load cell specifications and data recording information, are provided in “Elastic Behavior Under Uniaxial Compression”.
Test Conditions and Limitations
A compressive load diametrically applied to the surface of a cylinder induces in the center of a core a tensile stress normal to the loading plane. The resulting compressive stresses in the direction parallel to the applied load complicate the stress distribution so that it is impossible to obtain the true tensile strength of the test specimen by a simple calculation.
Three conditions affect the test results:
- Dimensional tolerances and surface roughness.
- Environment, moisture, and temperature.
- Load rate.
All three conditions can be controlled
Test Procedure
Test specimens are preconditioned as described in “Elastic Behavior Under Uniaxial Compression”. After being preconditioned, the specimen is positioned between the two hardened steel plates in the test fixture, which is then centered in the compression testing machine. A platen containing a spherical seat is placed on top of the fixture to provide contact with the load cell.
Load is applied to the specimen in the apparatus as described in “Elastic Behavior Under Uniaxial Compression”. The load rate is commonly maintained so as to produce a calculated tensile stress rate of approximately 100 psi/min (11.5 N/m²/sec).
Data Reduction and Analysis
The tensile strength, σt, is computed from the load at failure, Pmax, by
σt = 2Pmax/πDt
where D = specimen diameter, in (m),
and t = specimen thickness, in (m).
Load-Resisting Ability in Bending
Property
Modulus of rupture (flexural strength), Tb, psi (N/m²).
Use of Property
The modulus of rupture measures flexural strength and is particularly useful in evaluating the strength of rock spans such as are found in tunnel and mine roofs.
Specimen Preparation, Apparatus
See “Elastic Behavior in Bending”.
Test Conditions and Limitations
Although the test fixture can be modified for center loading, the third-point loading gives more uniform bending stress configuration between the two line-load points. With center loading, the maximum stress occurs directly under the load and causes the fracture to occur at or near the point of applied load regardless of the relative strength of the surrounding material. The apparent strength measured by the third-point loading, therefore, is slightly less than that given with central loading because the developing fracture can seek out the weakest material between the load application lines. Cylindrical cores are sometimes used as specimens because their preparation is simple.
Limitations on the dimensions of specimens are the same as those described in “Elastic Behavior in Bending”.
Test Procedure
The test procedure is the same as that described in “Elastic Behavior in Bending”.
Data Reduction and Analysis
The stress, ‘T, at any section of the beam is given by equation 1 ;
σ = My/I………………………………………………………(1)
where M = bending moment in-lb, (N/m),
y = distance from the neutral axis, in (m),
and I = cross-sectional area moment of inertia, in 4 (m4).
For the third-point test fixture used, M is uniform in the central portion of the beam:
M = PL/6…………………………………………………………………..(2)
where P = load, lb, (N),
and L = span length between support rods, in (m).
Also for a rectangular beam,
I = bt³/12……………………………………………………………..(3)
where b = width, in (m),
and t = thickness, in (m).
The modulus of rupture, σb, is therefore defined as the tensile stress at the lower surface of the specimen where y = t/2.

where PB= the applied load at failure, lb (N).
Since the exact location of the neutral axis is unknown and equation 4 is also based on the assumption that the material is linearly elastic up to failure, therefore, the test results are only related to, but are not, the tensile strength.
Since cylindrical specimens are occasionally used, equation 4 becomes for these specimens

where d = core diameter, in (m).
Load-Resisting Ability in Bending at Elevated Temperatures
Property
Modulus of rupture (flexural strength), σb, psi (N/m²).
Use of Property
Knowledge of the property is used to determine the effect of temperature on the modulus of rupture and to compare rock strength under variable test and environmental conditions.
Specimen Preparation
Conventional water-cooled diamond tools are used to drill cores of 0.5- or 0.75-in diameter by 4.5- or 5.0-in length. The diameter is measured at midpoint to the nearest 0.001 in. Length is not critical other than that the specimens should overhang each of the lower supports by at least 0.25 in. The ends of the specimens are cut off by water-cooled diamond saws. All specimens are baked for 7 days at 221° F (105° C) and stored in a desiccator until the time for testing.
Apparatus
Cores are stacked inside the chamber of an electric furnace in tiers of tile racks (fig. 72). A thermocouple positioned ½ in above the innermost core in the top tier indicates specimen temperature. At the time of testing, individual specimens are supported in a cradle formed by two slightly concave knife edges of 3/8-in radius mounted in a support block. The cores center themselves automatically as they are pushed one at a time from the trays. Through a sight port, the operator can observe that the specimen is centered properly. A concentrated load is applied at the specimen midpoint by an upper load rod knife edge of 3/8-in radius. The upper load rod is externally connected to a waterload activated mechanical leverage system (fig. 73). Waterflow into the waterload container can be adjusted to vary the loading rate. Waterflow is measured by a turbine flowmeter connected to a totalizing
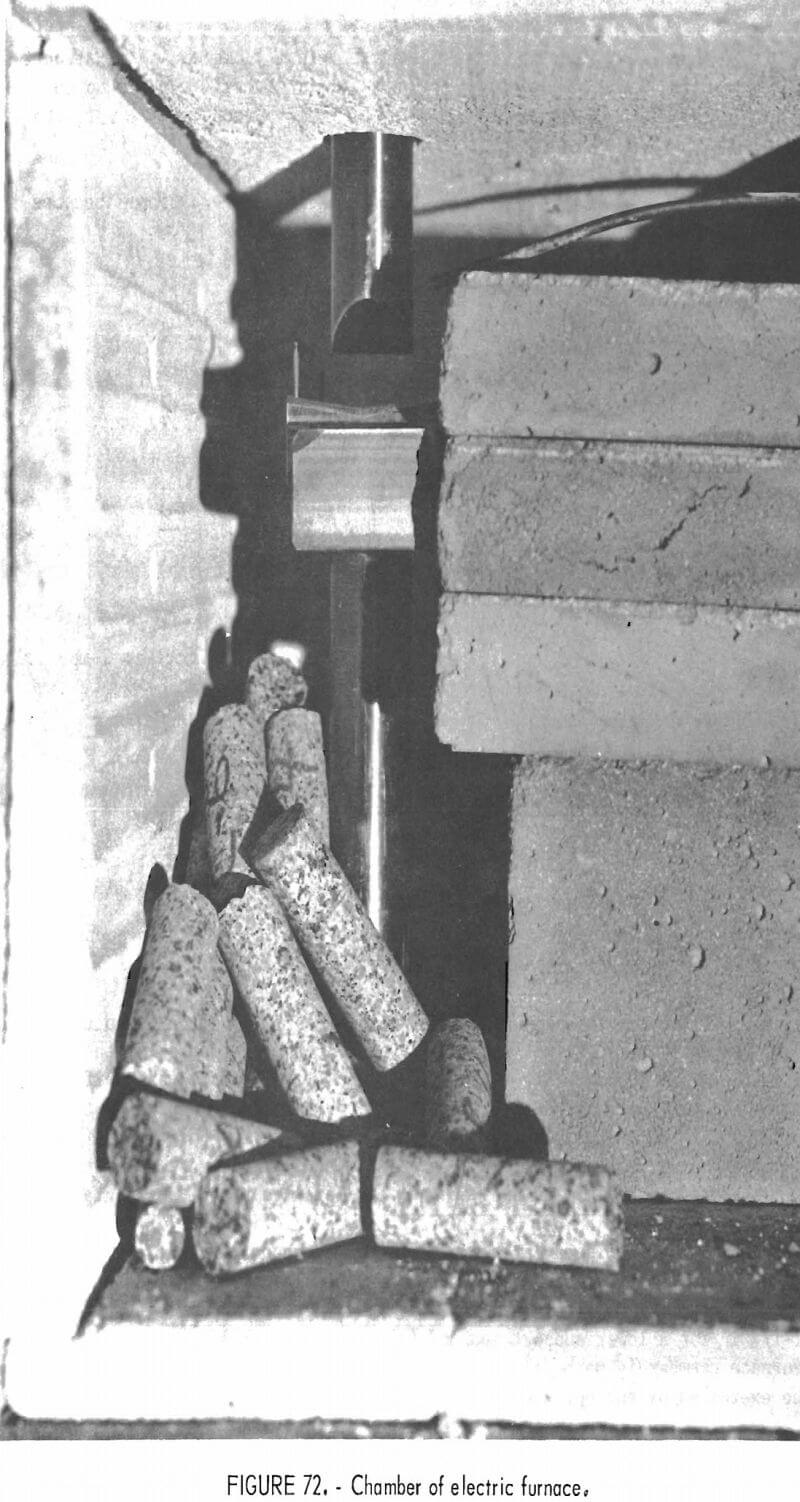
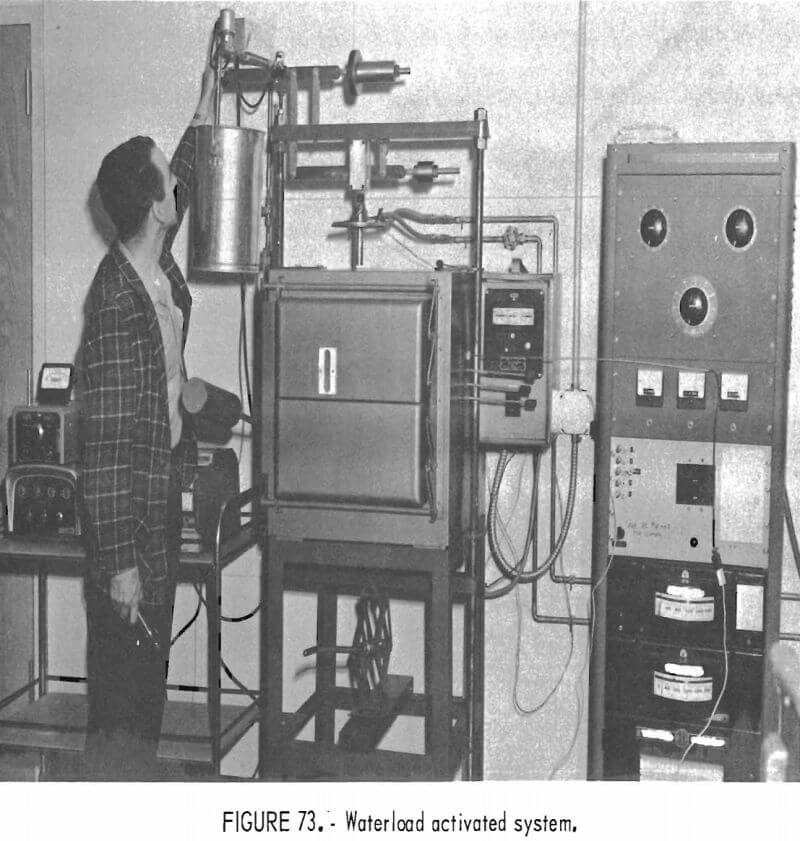
counter. The total quantity of waterflow measured is changed to pounds of force on the specimen by an appropriate conversion factor.
The lower support block with its knife edges is constructed so that a base length of 3-½ or 4-½ in can be used according to the length of the specimen to be broken. The entire assembly of lower support and knife edges and upper load rod knife edge can be raised or lowered, as appropriate, to match the level of the various tile racks. The relative positions of the upper and lower knife edges can also be adjusted to accommodate different diameters of the specimens and yet keep the leverage system horizontal.
The upper loading apparatus may be readily converted from a midpoint to a load fixture. In this configuration, the upper load span is made one-third the length of the lower support span. Typically, the upper load span would be 1-½ in for a lower support span of 4-½ in. Since alinement in the hot furnace chamber is more difficult for this arrangement, considerable care must be exercised by the operator.
Test Conditions and Limitations
The upper temperature limit of the furnace used is 1,650° F. Specimen diameters are limited to a maximum of ¾ in because of the strength limitations of the leverage system and the load capacity of the waterload container.
The test method covers the procedure for determining the modulus of rupture of rock at elevated temperatures. It is still in the development state, and the procedures set forth are tentative until appropriate correction factors can be determined. In the interim, the present practice gives useful comparison of rock strengths under various test and environmental conditions.
Analytical Procedure
A 2 by 2 by 2 factorial test design is run at three levels of temperature, 75°, 700°, and 1,200° F. Ideally, the temperature levels should also be completely randomized. Since each treatment is replicated seven times, complete randomization of the test procedures is impractical, and the tests are run as batch tests at each of the three levels of temperature. However, the order of the batch tests is randomized, and at least one replication is made to determine the effect of running a batch test on different days.
Cores are stacked inside the chamber of an electric furnace in tiers of tile racks. The cores are positioned in a random sequence determined as part of the test design. A typical arrangement would allow random testing between two levels of specimen diameter, two levels of span width, and two levels of specimen orientation; for example, parallel and perpendicular to the bedding. The furnace is closed, and the specimens are heated to the test temperature at a rate not to exceed 600° F (330° C)/hr. Temperature variations in the furnace due to power cycling should not exceed ±20° F (±10° C). A thermocouple positioned ½ in above the innermost core in the top tier indicates specimen temperature. Cores are held at a test temperature for at least 1 hr before testing proceeds.
Hot specimens are pushed, one at a time, into a cradle formed by the two slightly concave lower knife edges of 3/8-in radius. This design of the support allows the cores to center automatically. Through the sight port, the operator visually checks to insure that each specimen overhangs the lower supports by the proper amount. A concentrated load is applied at the specimen midpoint by an upper load rod knife edge of 3/8-in radius. The load rod is externally connected to a waterload activated mechanical leverage loading system. Waterflow into the container is adjusted for a constant loading rate of 180 lb/min. Provision is made to interrupt the waterflow at the time of specimen failure.
Waterflow is measured with a flowmeter, and an appropriate conversion factor is used to convert flow to units of force on the specimen.
Data Reduction and Analysis
The formula for modulus of rupture of cores is
σb = 8 PL/πd³ for midpoint loading………………………………………………….(1)
and σb = 16 PL/3πd³ for third-point loading…………………………………….(2)
where σb = modulus of rupture, psi (N/m²),
P = concentrated load, lb (N),
L = span width, in (m),
and d = core diameter, in (m).
In a third-point loading, the stress condition on the bottom surface of the specimen (tension side) is modified from a point under maximum stress to a line under maximum stress. Since at present appropriate correction factors have not been developed, the results of both the midpoint and third-point loaded core tests cannot be equated to equivalent test results for line-loaded rectangular beams.
This midpoint loading procedure incorporates most of the features recommended under “Tentative Method of Determining Modulus of Rupture of Refractory Materials at Elevated Temperatures,” ASTM Designation C 583-65T. The most important difference is that point-loaded cylinders (cores) are used instead of line-loaded rectangular beams. It should be noted that ASTM C 583-65T does not call for a correction for wedging effect due to concentrated load even though it allows a span/depth ratio as low as 6:1, The matter of appropriate correction factors is of even more concern in this procedure presented herein since the span/depth ratio may be as low as 4.67:1.
Inelastic Behavior of Surface
Property
Indentation hardness, Knoops, KKN; Vickers, VHN, kg/mm²
Use of Property
Indentation hardness is used to determine a hardness number for materials that encompass inelastic deformation in its application.
Specimen Preparation
Although the sample should include two parallel faces, size of the sample is not critical. A convenient size is about 2 by 2 in (or 2-in diameter); height can vary from the thickness of 0.25 in up to about 2 in. The test face and its opposite side should be fairly parallel. The test face should be polished, ending with 0000 metallographic paper. Details of preparation of nonmetalIic specimens are given by Thibault and Nyquist.
Apparatus
The microindentation hardness tester used (fig. 74) is a commercial machine, a Tukon hardness tester.
Test Conditions and Limitations
The test can be applied to any rock or mineral specimen that can be polished. The cavitation that might occur with some specimens does not present any problem since the operator can easily select a cavity-tree test site on a microportion of the sample.
Analytical Procedure
In the Tukon tester (fig. 75) a beam is pivoted on a knife edge, P, and the load, L, is applied by the carrier arm, A, hanging from a second knife-edge support at Q, with the diamond indenter at D. The beam is first balanced by removing the carrier arm and adjusting the thumbscrew, T, with the current supply to the instrument switched off. Before the load is applied to the specimen, M, the beam rests on an electrical contact, C, and the solenoid, S, applies a pull on the beam that is less than the minimum load used. When the circuit operating the stage elevating unit, E, is energized, the specimen is slowly raised at about 18 mm/min until the indenter and the specimen make contact. As soon as the load exerted by the indenter on the specimen equals the difference between the applied load and the pull due to the solenoid, the beam lifts off the contact, C, the circuit is broken, and the stage elevating unit comes to rest; 5 sec later, the solenoid circuit is also broken, and the full load is applied. The loading cycle is completed by the reenergization of the solenoid after a period of 20 sec, followed by an automatic lifting of the beam to free the indenter. The stage is then retracted to allow the moving part to be slid into position so that the indentation is centered in the field of a measuring microscope carrying a filar eyepiece. When the carrier arm is empty, the load applied is equivalent to 100 g and it is necessary to counterbalance the carrier arm by suspending weights at position W. Although the original machine was designed to operate over a loading range of 25 to 3,500 g, later models have been constructed for loads down to 5 g. The Vickers and Knoop indenters are easily Interchanged; the beam must be rebalanced each time the indenter is changed.
The result of the indenter action on the specimen is plastically formed depression with possibly some minute elastic return.
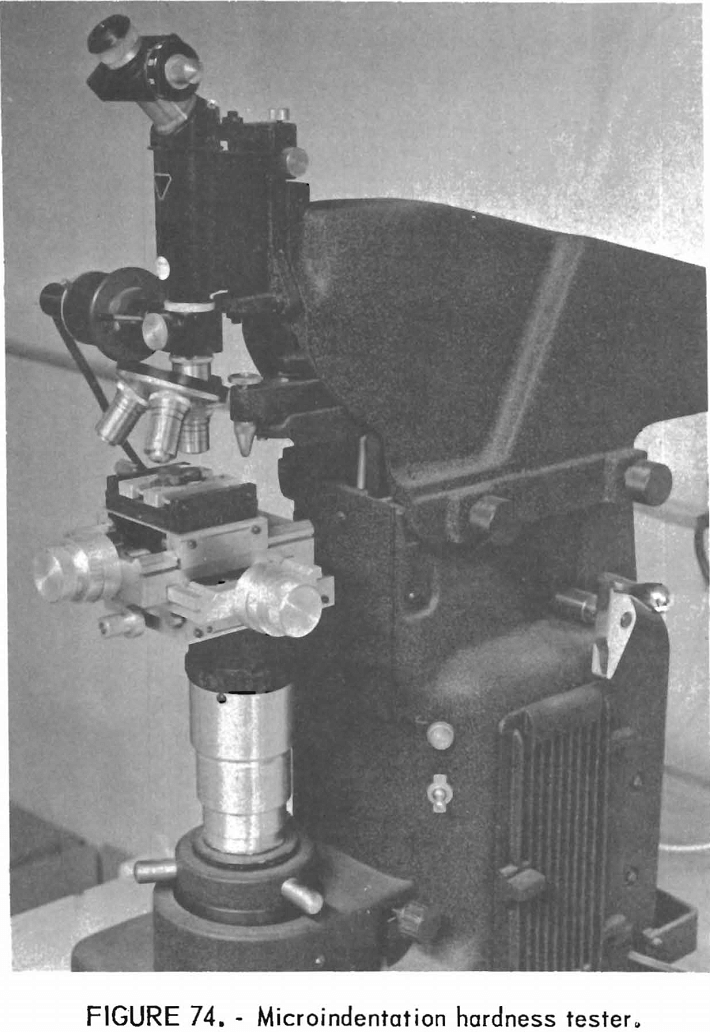
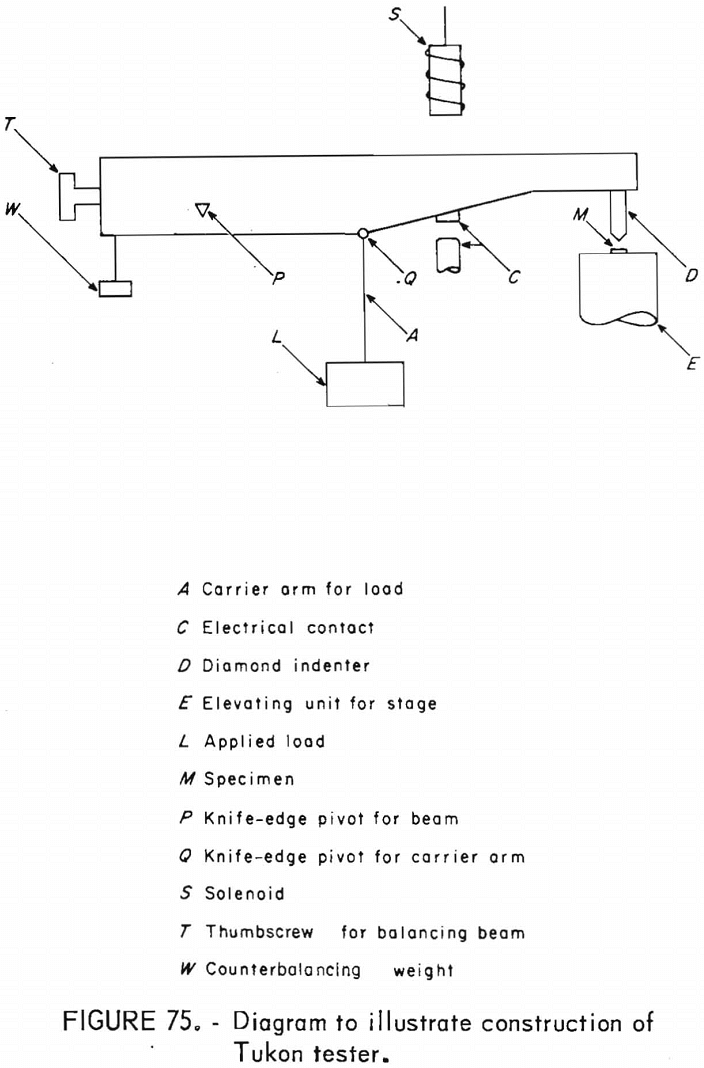
The Knoop indenter is an accurately ground diamond forming a rhombic based pyramid, properly mounted for attaching to the beam. An indentation seen normal to the specimen surface appears rhombic in outline with diagonals having an approximate ratio of 7 to 1.
The depth of indentation is about one-thirtieth the length of the long diagonal.
Data Reduction and Analysis
Figure 76 shows the maximum useful dimensions for the Knoop indenter. The calculations for the Knoop hardness number (KHN) follow:
KHN = P/AP = P/l²Ck…………………………………………………………(1)
where p = load on indenter, kg,
Ap = unrecovered projected area, of indentation, mm²,
l = length of long diagonal, mm,
and Ck = constant relating l to Ap.
The indenter constant, which is used to calculate Knoop hardness number by formula, is the ratio of the projected area of indentation to the square of length of long diagonal. Its value is given by
Ck = cot A/2 tan B/2/2………………………………………………………………..(2)
where A = included longitudinal edge angle,
B = included transverse edge angle,
and Ck = 0.07028 for perfect indenter with angles of 172° 30′ 00″ and 130° 00′ 00″.
Perfect angles for the Knoop Indenter are (1) included longitudinal angle, 170° 30′ 00″, and (2) included transverse angle, 130° 00′ 00″.
A Certificate of Test for the Knoop indenter furnished by the manufacturer records the actual angles of the particular indenter supplied and certifies that the indenter meets the requirements of the National Bureau of Standards.
Figure 77 shows maximum dimensions for the Vickers indenter. The 136° diamond-pyramid indenter (usually called Vickers indenter) is an accurately ground diamond forming a square-based pyramid with an included apex angle of 136° between opposite sides, properly mounted for attaching to the beam. The following formula is used for calculating the Vickers hardness number (VHN):
VHN = 1.854 P/d²……………………………………………………………(3)
where d = length of average diagonal, mm,
and P = load on indenter, kg.
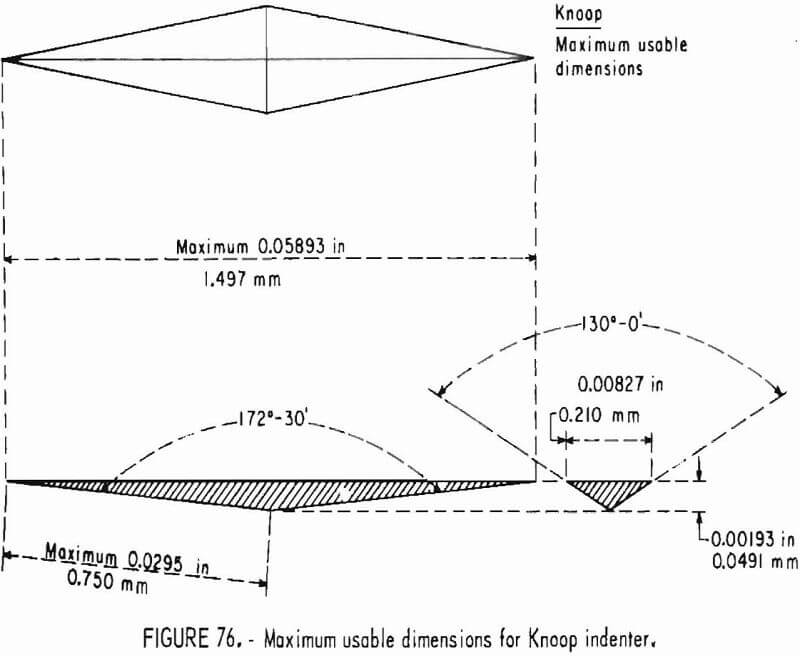
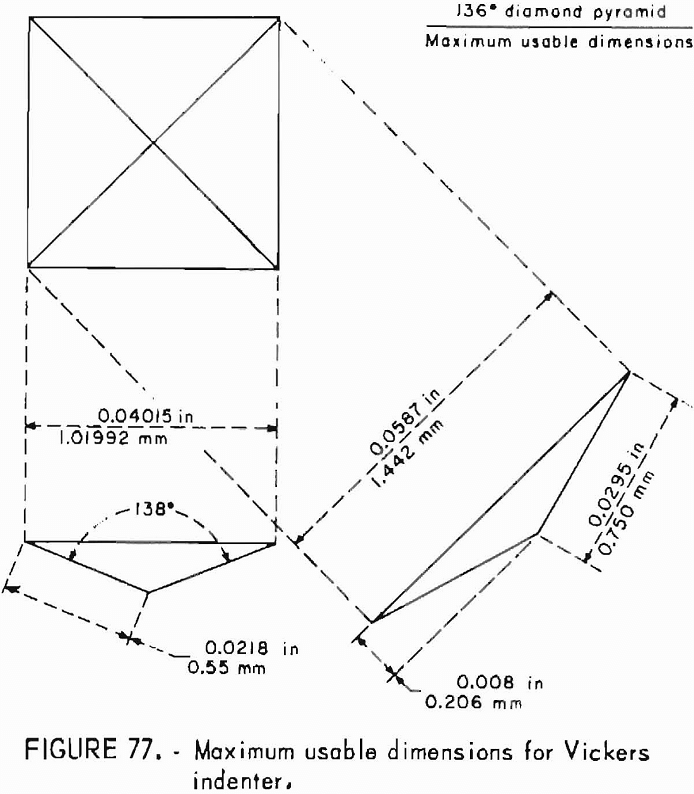
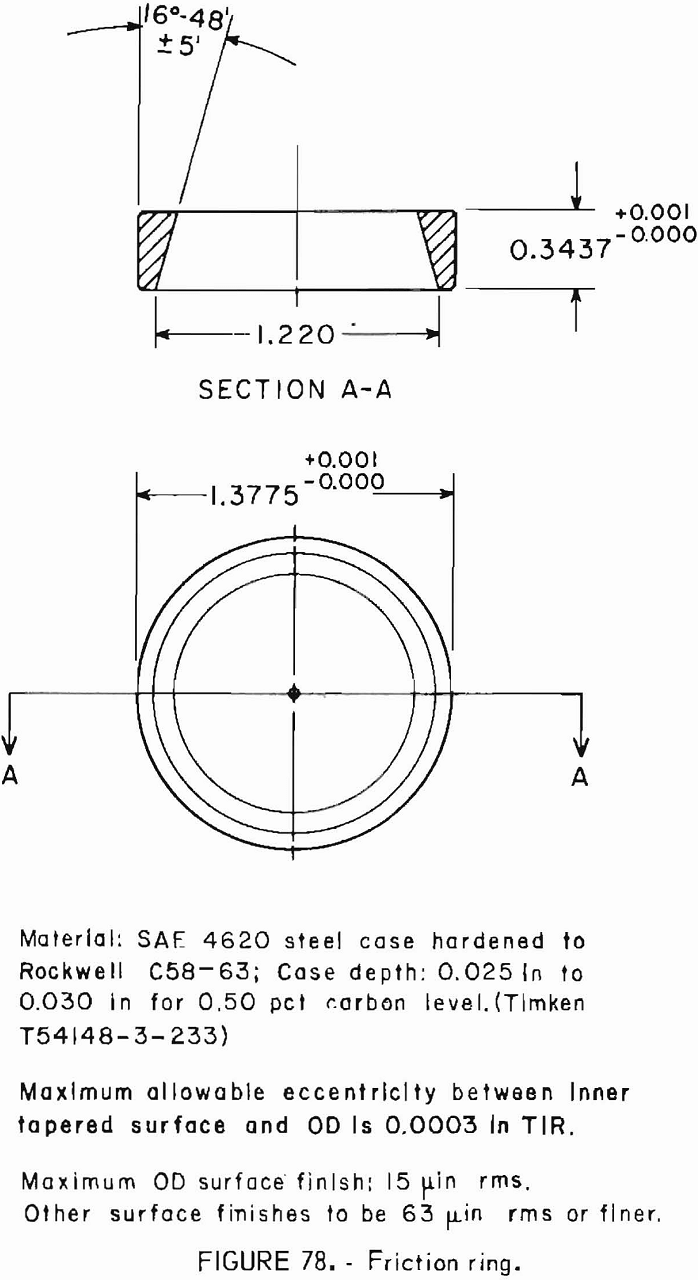
The number of indentations required is related to whether the material is metallic or nonmetallic. A metallic material will usually require fewer than 10 indentations to give data sufficient for meaningful error analysis. A non- metallic material, especially if it is nonhomogeneous, requires that the operator notes carefully the spread of the data obtained. If there is a spread of data a large number of indentations must be made to obtain a meaningful error analysis.
Interfaciai Phenomena and Surface Interactions
Property
Coefficient of friction µ (dimensionless).
Use of Property
The coefficient of friction is a surface property to determine mechanical interactions between two materials in contact that give rise to inter- facial phenomena; for example, friction, wear, and the effects of an intervening phase (liquids) on the interfacial phenomena.
Specimen Preparation
Two- specimens are required for this test: A metal ring and a mineral block. The rings are available in SAE 4620 steel; rings of other metals must be custom made. The ring has an OD of 1.3775 in (3.49885 x 10-² m) and should have an outside surface finish of 15 µ in rms. The inner diameter is 1.200 in (3.0988 x 10-² m) and tapers at an angle of 16° 48′ 15″. The ring is 0.3437 in (8.72998 x 10-³ m) wide. A detailed drawing is shown in figure 78.
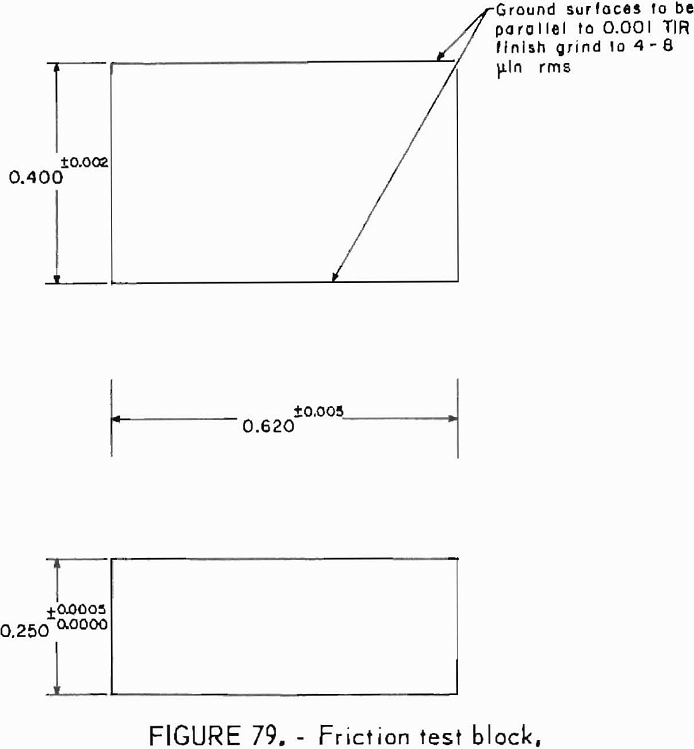
The block must be strong, homogeneous material such as single crystal quartz. Its dimensions must be 0.400 by 0.620 by 0.250 in (1.0160 by 1.5748 by 0.6350 10-² m) with the friction-test faces ground parallel to 0.001 in (2.5400 x 10 -6 m) total indicator reading (TIR) (fig. 79).
The ring and block should be prepared in four steps: (1) Washing in cyclohexane, (2) suspending in the vapor of boiling cyclohexane for 1 min, (3) submerging in boiling acetone for 30 sec, and (4) suspending in cyclohexane vapor for another 30 sec.
The specimens are then placed in the machine, adjustments are made, and weights from 0.2 to 12 kg are hung on the bob, depending upon the test materials and liquid environment. The wear transducer is lowered into place and adjusted. The lubricant cup is filled, and the machine is started. The ring can be rotated at any speed from 20 to 200 rpm. The complete apparatus is shown in figure 80.
Apparatus
The test is performed with a friction and wear testing machine. The mineral specimen is loaded normal to the rotating steel cylinder. Loading can be changed by adding or removing weights from the hanging bob that is connected through lever action to the specimen holder.
The frictional force is measured by a strain gage load cell and displayed on a recorder in grams. A typical frictional force trace is shown in figure 80.
Test Conditions and Limitations
This test can be applied to rock specimen as well as to a single crystal. The test should be performed with a liquid lubricant.
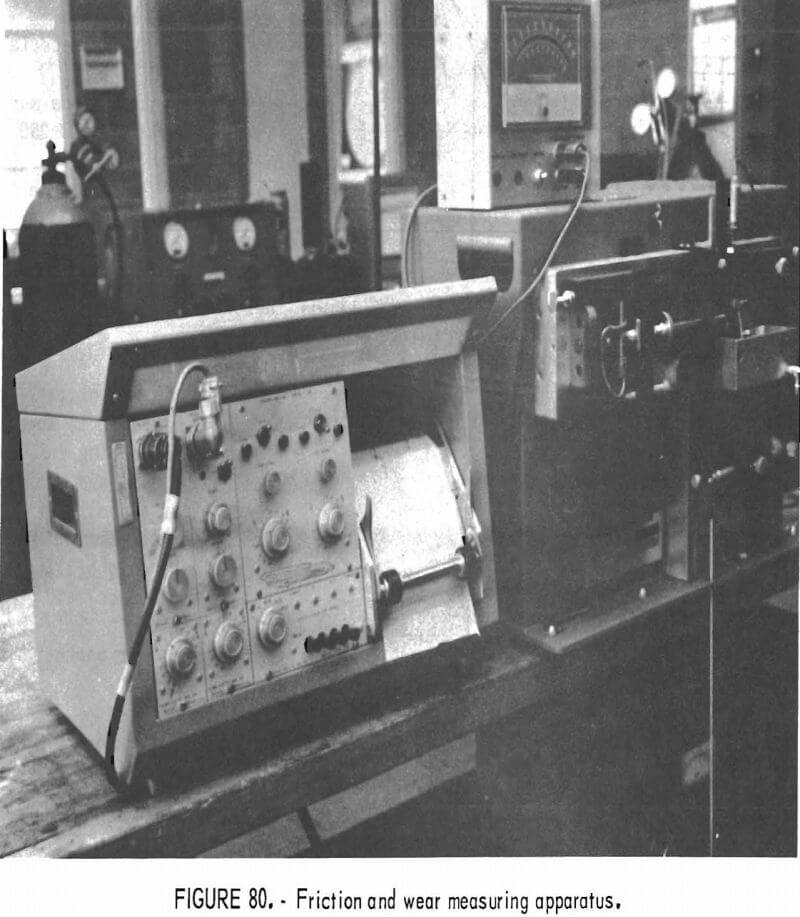
Analytical Procedure
The coefficient of friction is determined from the ratio of the measured tangential force and the weight hung on the bob (normal load).
Data Reduction and Analysis
The frictional force is obtained by averaging the measured tangential force values at intervals of 200, 400, 600, 1,000, and 2,000 rpm. The coefficient of friction of the rock and the contact material is then the average tangential force divided by the normal load.
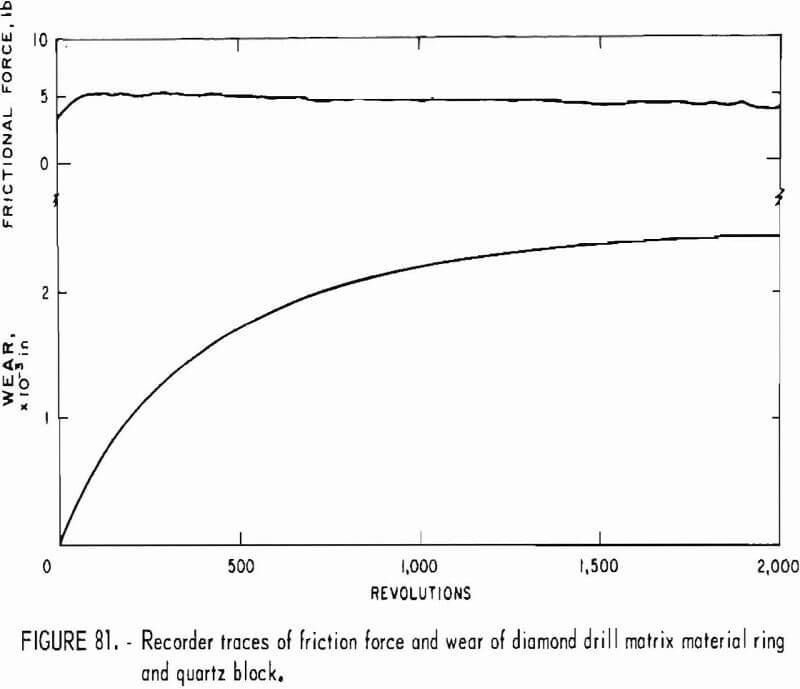
A sample calculation is as follows:
Coefficient of friction = tangential force/normal load
or µ = 2050 g/6850 g = 0.30 (dimensionless)
At least three to five tests are run under each set of conditions, and the average and standard deviations are calculated. Figure 81 shows how a trace of a frictional force exerted by a diamond drill matrix material ring on a quartz block. Figure 82 shows how the concentration of soap solution affects the coefficient of friction.
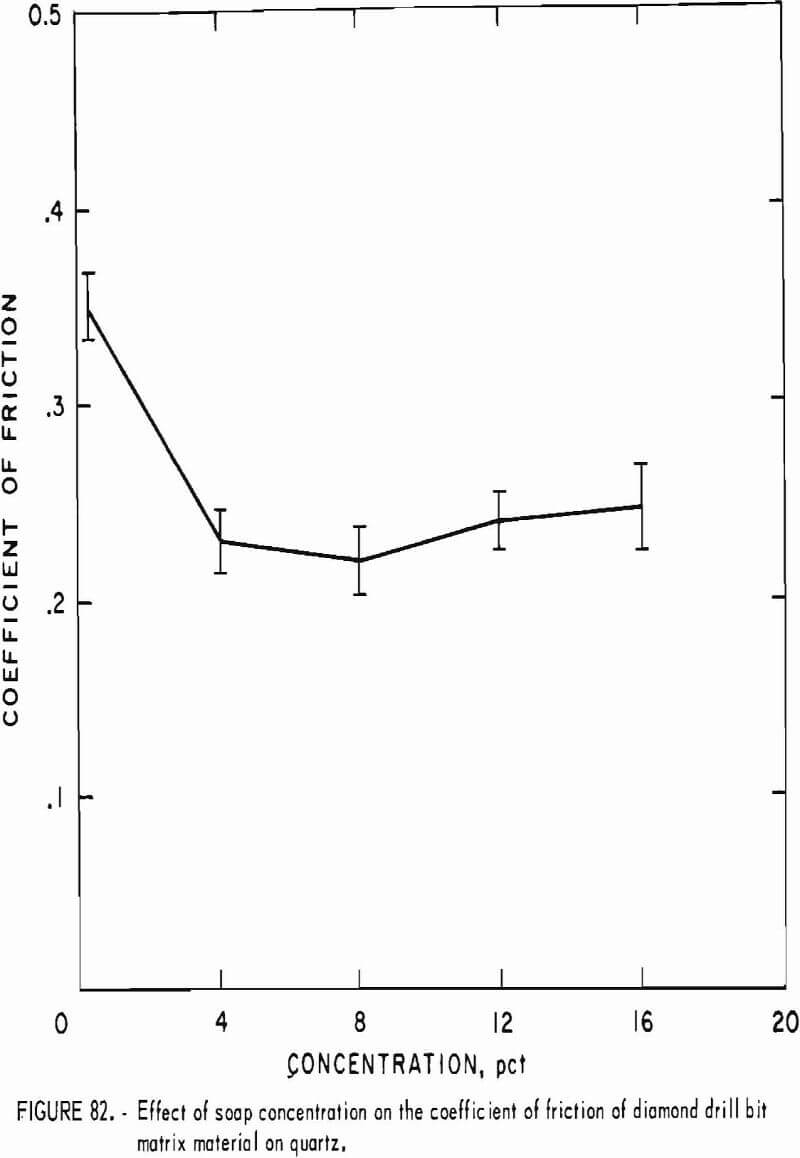
Interfacial Phenomena (Air/Liquid)
Property
Surface tension (air/liquid interfacial), dynes/cm.
Use of Property
Surface tension is a surface property used to determine the effects of a solution and its wettability characteristics at the liquid-rock interface.
Specimen Preparation
The only necessary condition is that the fluid be free of floating matter.
Apparatus
The device used is a commercially available du Nouy tensiometer (fig. 83).
A thin steel wire is attached at both ends to the torsion heads, A and B, which can be rotated in either direction by a knurled knob connected to a worm gear. One end of a thin wire level arm is clamped perpendicularly onto the torsion wire, and from the other, shaped into a hook, are hung the platinum-iridium ring and connecting support. The device is ready for calibration at this point (see “Analytical Procedure”).
Test Conditions and Limitations
Surface tension of the air/liquid interface can be measured over a range of 0 to 180 dynes/cm. The liquid should be single phase, although it may contain suspended solid matter. The platinum-iridium ring must be absolutely clean before being immersed in the test liquid. To insure cleanliness, the ring should be cleaned with acid or detergent and rinsed in deionized water. The ring is then held by the support, and the ring portion is carefully heated to red heat (for about 1 sec) in a blue bunsen flame. To remove all traces of organic matter, the glass vessel for holding the test liquid should be cleaned with a chromic acid solution, rinsed several times with deionized water rinses, heated with the tip of a bunsen flame to a weak glow, and then allowed to cool. An asbestos support should be used to avoid direct contact with the flame.

Analytical Procedure
The instrument is first leveled. The cleaned ring is hung on the support lever, and the vernier knob on the torsion head, A, is set to zero. The other torsion head, B, then is turned until the level at the support lever is centered in the null or balance position in the viewing eyepiece. From this point, control B is not touched again.
The glass vessel is filled about two-thirds full of the test liquid and centered on the elevatable platform. To immerse the ring in the liquid, control knob, C, is rotated until the platform rises.
Torsion control knob, A, is turned counterclockwise to lower the container of liquid while the observer watches through the eyepiece to maintain the null position of the support arm. The slow, alternating increase of tension with control A is repeated, and the liquid is lowered with control C until the surface tension value has been reached and the ring tears free from the surface. The value of the surface tension is read directly at the vernier scale with an accuracy of 0.1 dyne/cm.
Data Reduction and Analysis
No data reduction is needed with this calibrated instrument. The tensiometer can be calibrated by noting the surface tension of distilled or deionized water at 18° C. The value should be 72.9 dyne/cm. If the value is different, a correction factor should be employed. For example, if water at 18° C gives a reading of 73.6 instead of 72.9 dyne/cm, all values subsequently obtained should be multiplied by 0.99.
The number of trials required for error analysis of a single test is usually under 10.
Percolation of Gas and Water in Rock
Property
Permeability, darcys.
Use of Property
Knowledge of the property is used to determine the permeability of rock to water or gas; that is, the rate at which water or gas will flow through a rock at standard conditions.
Specimen Preparation
Samples are prepared as right cylinders with a length-to-diameter ratio of approximately 1. The diameter can vary from 18 to 33 mm. Sides should be true to 0.05-mm diameter, and ends should be parallel to within 0.05 mm. For testing in the gas permeameter, the samples are cleaned In an ultrasonic cleaner and dried for 72 hr at 105° C. For testing in the liquid permeameter, the dried samples are vacuum soaked by being held for 30 min in a dry vacuum at less than 1 mm pressure and then flooded with water while the vacuum is held at the maximum. After the samples are covered with water, the vacuum is maintained for 15 min, after which the specimen is allowed to return to atmospheric pressure.
Apparatus
The apparatus used is a commercial gas and liquid permeameter and a special high-pressure liquid permeameter (fig. 84). Sample holders in all three Instruments are similar (fig. 85), consisting of an outer shell, a clamping arrangement, and an interchangeable rubber gasket for different sizes Both liquid permeameters use gas pressure to force the liquid through the rock In the commercial permeameter, the volume is measured before the liquid is passed through the rock. In the high-pressure permeameter, the liquid volume is measured after the liquid has passed through the rock. Flowmeters measure the volume in the gas permeameter.
Test Conditions and Limitations
The gas permeameter is limited to rocks with fairly high permeability (1 x 10-³ darcys or greater). The commercial liquid permeameter can be used on rock down to about 1 x 10 -4: darcys. The high-pressure permeameter can measure to about 1 x 10 -8 darcys.
Care must be exercised that the rocks tested with the liquid permeameter are not sensitive to the fluid being used. When water is used, it must be freshly distilled or prepared in such a way that bacteria will not grow in it. In the micropermeability range, bacterial growth in the water can block the pores. As a standard procedure, water used for permeability determinations is filtered through a 0.22-µm filter.
Analytical Procedure
Samples are first measured accurately by averaging at least three micrometer caliper readings of both height and diameter. The samples are placed in the holder, and gas or liquid is forced through them. Volume of fluid, pressure, and temperature are recorded.
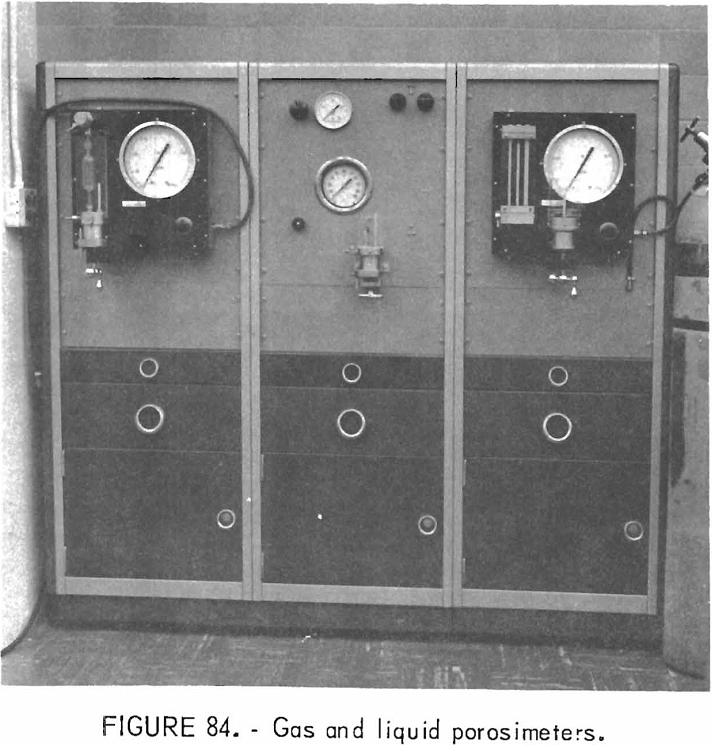

Data Reduction and Analysis
With the liquid permeameter, permeability is determined by the equation
K = ηVL/Apt……………………………………………………(1)
where K = permeability in darcys,
η = viscosity of the fluid at the temperature (centipoises),
V = volume of fluid, cc,
p = pressure in atmospheres, (bar),
A = area of sample end, cm²,
L = length of sample, cm,
and t = time, sec.
For the gas permeameter the equation becomes
K = ηQL/Ap……………………………………………………………(2)
where Q = average rate of flow in cc/sec in the sample. This figure is derived from the calibration curves of the flowmeter.
Electric Polarization
Properties
Relative dielectric constant, Kd, dimensionless (ratio of two quantities of charge).
Relative dissipation factor, Di, dimensionless (tangent of the angle between the applied voltage and current vectors on a capacitor).
Loss factor, ε, dimensionless (product of dissipation factor and dielectric constant).
Use of Properties
The data obtained are used in the study of dielectric heating as a method of rock fragmentation. Data on both the frequency and temperature dependency of the dielectric constant of rocks are needed for fragmentation studies with the Bureau of Mines experimental dielectric-induction heater.
Specimen Preparation
Specimens are sections of right circular cylinders cut from AX core (1-3/16-in diameter). The exact diameter is not important since each specimen will have to be measured. All specimens should be circular in cross section to within ±0.002 in. Thickness should be nominally 0.25 in but not exceed 0.30 in. Surfaces of the disk should be parallel to 0.001 in and lapped to a finish of 2 µ in except for the effect of grain boundaries. Edges should be sharp and free from chips except in vesicular material where these cannot be avoided.
Specimens are dried at a temperature of approximately 150° C for 24 hr to eliminate any variation in measured values due to free moisture in the materials. After being dried the specimens are stored in a desiccator except for the few minutes involved in making the measurements. When a conductive coating is required, aluminum foil is used (0.00045 in thick) with a thin layer of petroleum jelly to hold it in place.
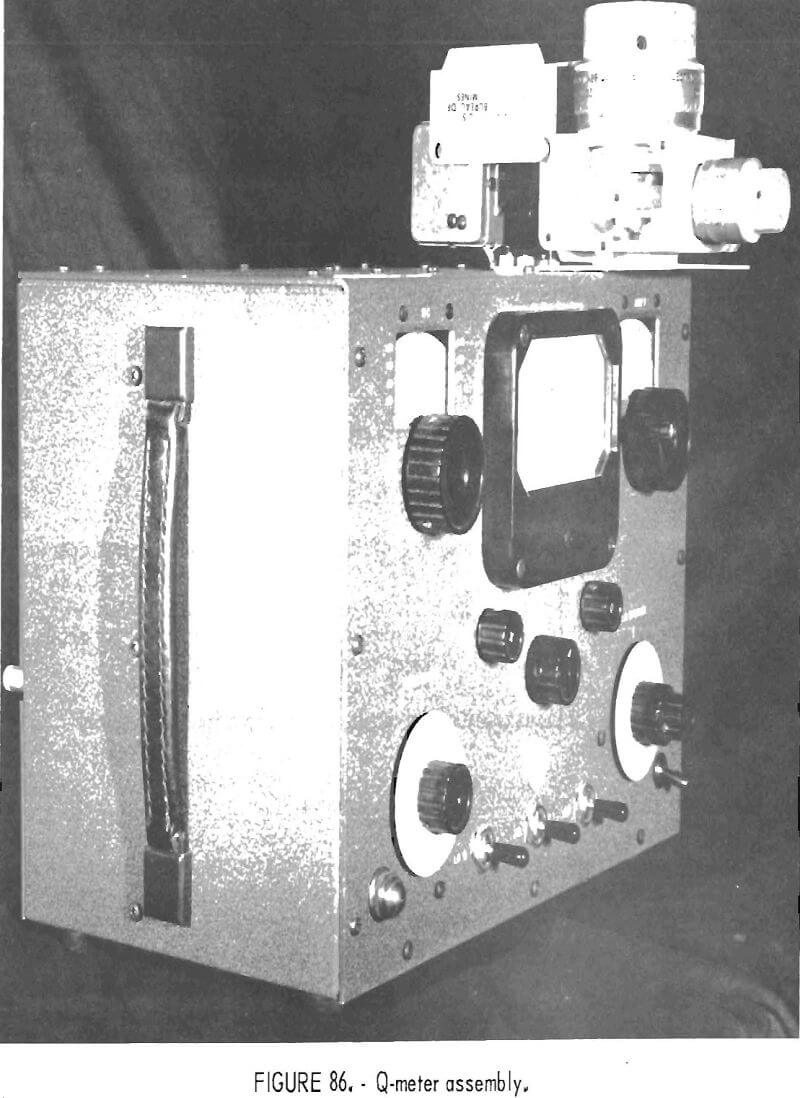
Apparatus
The equipment used to obtain data consists of a Q-meter with a set of standard inductors and a dielectric sample holder. An aluminum adapter plate was made to affix the sample holder to the Q-meter at its terminals. The complete assembly is shown in figure 86. The electrical circuit of the complete assembly is shown schematically in figure 87.
Test Conditions and Limitations
Measurements are taken at 10 MHz intervals from 20 to 100 MHz. This frequency range covers our interests in that it includes the useful frequency
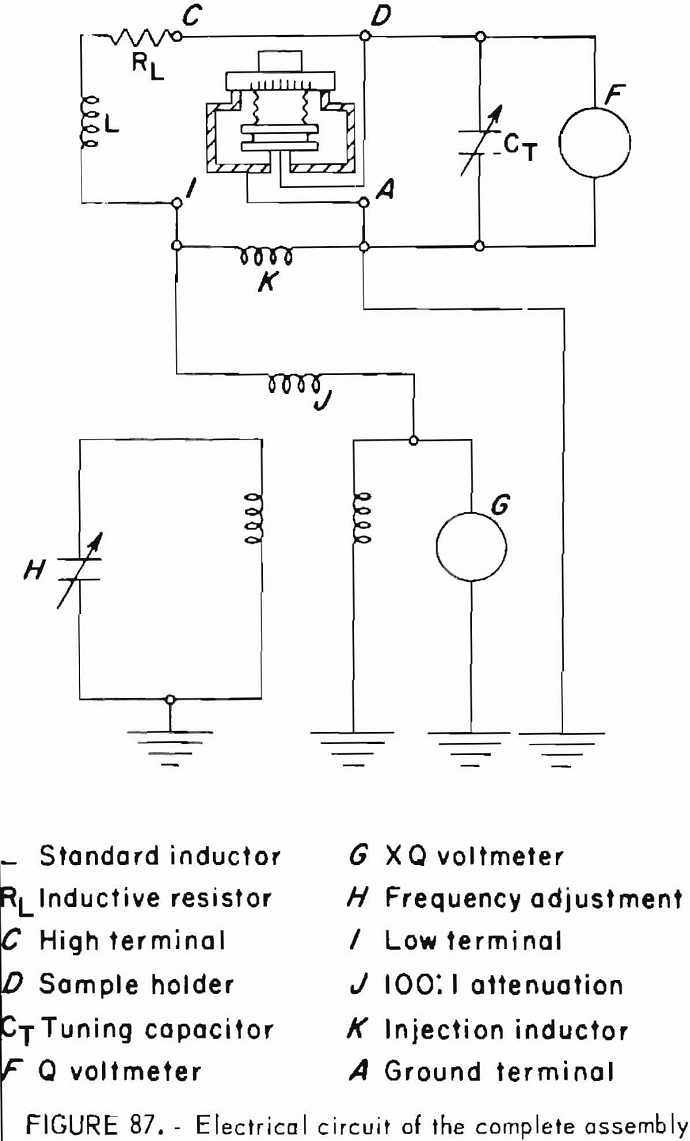
range of our dielectric heating apparatus. According to the literature, the best results for dielectric constant and relative dissipation factor measurements are obtained at frequencies above 30 MHz with a conductive coating on the disk face.
Since any free moisture in the material will affect the measurement, samples must be dried and kept in a desiccator as mentioned previously. If measurements are desired at 100 pct humidity, or at other moisture levels, the samples must be conditioned and stored at the appropriate humidity level.
If anisotropy is suspected or obvious because of bedding plane or other physical features, additional tests should be run on specimens prepared from cores drilled in a direction to show the anisotropic effect.
Analytical Procedure
A calibrated micrometer-electrode system used with a any of the resonant circuit techniques, or bridge circuits, becomes the standard capacitor in terms of which the dielectric specimen is measured. The specimen is first clamped between the micrometer electrodes, and the network used for measurement is balanced or tuned. The specimen is then removed, and the electrode system is adjusted to the same capacitance by moving the micrometer electrodes closer together. The parallel capacitance of the specimen, Cp, is calculated from
Cp = C’ – Cb + Ca…………………………………………………(1)
where C’ = the calibration capacitance of the micrometer electrodes for the sample out balance,
Cb = the calibration capacitance of the micrometer electrodes at the sample spacing (accounting for any necessary correction because of foil or conductive coating),
and Ca = the geometric air capacitance, without fringing field, for the sample specimen’s thickness and diameter.
Since a dry-air capacitance is only 0.054 pct greater than a vacuum capacitance, Cy, the formula for the latter.
Ca = Cv = 0.1766 d²/t (pF)………………………………………………………….(2)
can be used for circular electrodes with diameter, d, and thickness, t, in inches.
Using correction factors for the various spacing of the electrodes taken from the manufacturer’s correction chart, the parallel capacitance is found from
Cp = CA2 + ΔCA2 – ΔCA1 – CA1 (l – Ax/AE) (pF)……………………………………(3)
where CA2 = geometric capacitance of the electrodes at the samples out tuning,
CA1 = geometric capacitance of the electrodes at the sample spacing (accounting for any foil or conductive coating) ,
ΔCA2, ΔCA1 = correction factors for CA2 and CA1,
Ax = area of the sample,
and Aε = area of the electrode.
The dielectric constant of the sample is then
Kd = Cp /CA (Ax/Aε)…………………………………………………….(4)
From references 1 and 7, the dissipation factor, Di, is given by the susceptance-variation method as
Di = tan δ = (ΔC – ΔC’)2Cp……………………………………………….(5)
where ΔC = C2 – C1, C2 > C1,
C1 = capacitance setting below resonance to produce 0.707 Q where Q is the meter reading at resonance,
and C2 = capacitance setting above resonance to produce 0.707 Q.
The prime mark indicates readings with the sample removed from the holder and the holder adjusted to reestablish resonance.
This procedure requires two detuning operations, one with and one without the sample in the holder. These operations can be reduced to one by taking advantage of the fact that the resonant voltage, Q is inversely proportional to the dissipation factor of the circuit
Di = tan δ = (ΔC/2Cp) [Q’ – Q]Q’,
Although this method is less accurate than that using capacitance differences alone, it is usually preferred since it involves fewer adjustments. For specimens with low dissipation factors (<0.1), detuning the circuit with the specimen in place is usually preferred because ΔC and the resonant voltage, Q’, are larger. The ΔC needed to detune the circuit to 0.707 Q is usually 1 or 2 pF and is best obtained by adjusting the vernier capacitor.
Data Reduction and Analysis
With a micrometer-electrode system operating over the frequency range of 1 to 100 MHz, it is possible to measure the capacitance of dielectric specimens with the susceptance-variation method to an accuracy of ±0.5 pct (±0.1 pF). The dielectric constant obtained by the procedures described is probably accurate to about ±2 pct. The principal errors in this method are due to inaccuracy in measuring the specimen dimensions and inaccuracy in reading the Q-values from the meter. Other errors could arise from the calibration data of the micrometer electrodes.
The micrometer-electrode system has three disadvantages: (1) Its capacitance cannot be calibrated as accurately as that of a standard precision capacitor, (2) it is not direct reading, and (3) the edge capacitance of the electrodes increases slightly when the specimen is inserted.
The micrometer-electrode system developed by Hartshorn and Ward minimizes errors caused by the series inductance and resistance of the connecting leads of the measuring capacitor at high frequencies. Their system maintains constant series inductance and resistance of the connecting leads with the specimen in or out of the circuit and, when carefully calibrated for capacitance changes, eliminates corrections for edge, ground, and, for all practical purposes, connection capacitance. Eliminating the need for these corrections at high frequencies outweighs the disadvantage of indirect reading mentioned previously. The increased edge capacitance of the electrodes can be practically eliminated by adjusting the specimen diameter so that the diameter of the electrodes is twice the thickness of the specimen.
Data from each group of rock type measurements, or grouping within a rock type because of anisotropy, are used to calculate the dielectric constant, as previously described, for the frequency at which those particular data were obtained. These values are then plotted on log-log paper, and a least-squares curve is calculated to fit the points plotted. The least-squares fit is calculated on a computer programmed to use orthogonal polynomials. Figure 88 shows a typical plot of the results obtained.
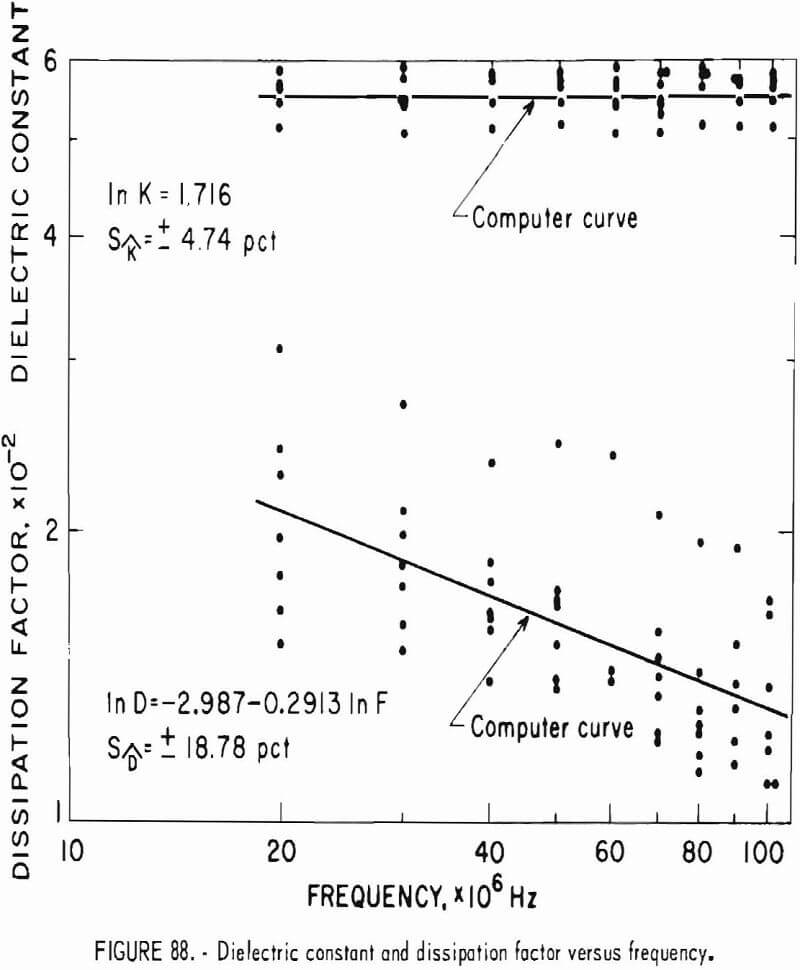
With an inductor having a dissipation factor of 0.003, the dissipation factor of the specimen can be measured to ±2 pct. The value of the dissipation factor obtained by the procedures described is accurate to probably about ±5 pct.
Data from each group of rock type measurements, or grouping within a rock type because of anisotropy, are used to calculate the dissipation factor, as previously described, for the frequency at which those particular data were obtained. These values are then plotted on log-log paper, and a least-squares curve is calculated to fit the points plotted. The least-squares fit is calculated on a computer programmed to use orthogonal polynomials.
Magnetization Capacity
Property
Magnetic susceptibility, Sm, ratio of the intensity of magnetization produced in a substance to the magnetic force to which it is subjected.
Use of Property
Magnetic susceptibility measures the capacity of a material to take on induced magnetization when it is placed in an external field. The magnetic characteristics of rock may originate from permanent magnetization, induced magnetization, or from both.
Permanent magnetization refers to that portion of the magnetism that is fixed in the rock and remains unaffected if the rock is exposed to external magnetic fields.
Induced magnetization refers to that portion of the magnetism that is created by placing the specimen in an external magnetic field. If the external field is changed in strength or direction, the induced magnetization will also change in strength or direction, and the sample behaves like a very weak electromagnet. The strength of the induced magnetization in a rock, Mi depends on the strength of the external magnetic field that produces it, H, and the magnetic susceptibility of the rock, Sm. Consequently Mi = SzH.
A rock may exhibit both permanent magnetization and induced magnetization at the same time, and measurements of the magnetic field produced by the rock cannot distinguish between them. Since permanent magnetization is in general less significant than induced magnetization, the magnetic susceptibility is the quantity that describes its magnetic properties.
Specimen Preparation
The best samples are 1-2/16-in rock cores at least 3 in long, with one end cut off perpendicular to the length of the core. The sample material should be as uniform as possible throughout its volume.
Although samples in the form of rock fragments or powder can be used they must be contained in a glass or plastic tube of the same dimensions described for cores. Such samples should be shaken down to maximum compaction to insure the highest possible accuracy of the measurement.
Apparatus
The measurements are made by a Soiltest MS-3 Magnetic Susceptibility Bridge. The principle of operation may be understood by reference to figure 89, a cutaway view of the sample holder. Three coaxial coils of wire are spaced vertically along a cylindrical form machined from phenolic resin, which has been selected for its high thermal and mechanical stability. Alternating
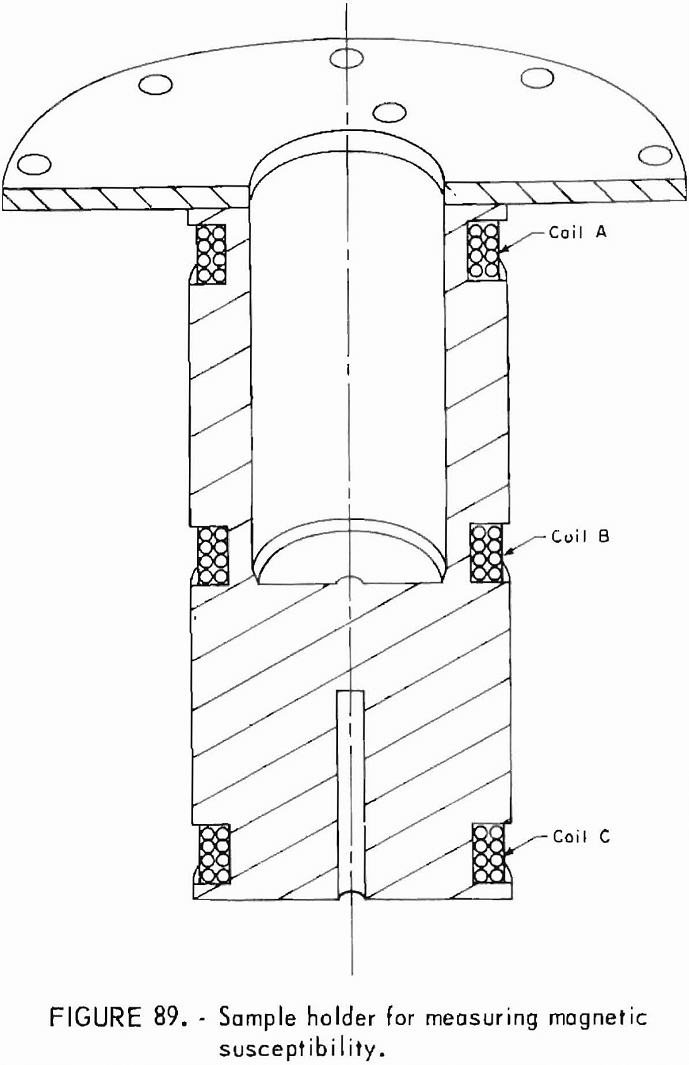
current, at an audio frequency, flows through coils A and C in series, in a direction such that the magnetic fields produced will be effectively cancelled at the position of coil B.
The sample holder opening passes through coil A and downward to end at coil B. When a rock sample is introduced into the sample holders, the magnetic coupling between coils A and B will be increased, and the coupling between coils C and B will be relatively unaffected. The amount of this unbalance depends on the magnetic susceptibility of the sample, and can be measured by an ac bridge. The bridge is balanced by minimizing an audio signal heard through a set of headphones, using two potentiometers.
The whole unit is self-contained and easily portable.
Test Conditions and Limitations
The chief limitations arise from nonuniformity in the rock sample, since the magnetic properties of a sample may vary considerably from point to point.
The range of calibration extends from approximately 2 x 10 -6 to 40,000 x 10 -8 cgs units of volume magnetic susceptibility.
Analytical Procedure
The bridge is first balanced without a sample present, and the readings on the potentiometers are noted. Then the sample is inserted in the holder, and the process is repeated. The difference in the potentiometer settings is the measure of the magnetic susceptibility.
Data Reduction and Analysis
The potentiometer readings are converted into cgs units of volume magnetic susceptibility by a calibration curve supplied with the machine. Since the calibration curve for low values of magnetic susceptibility is a straight line. It is only necessary to multiply the dial readings by a constant.
Usually several measurements are made on each sample, and the average is used. It is sometimes necessary to measure several samples of nonuniform rocks to determine a range of susceptibilities.
Thermal Conduction
Property
Thermal conductivity (K) , cal/sec cm ° C or Btu/hr ft ° F or watt/m ° C
Use of Property
Thermal conductivity is a thermal property used to determine quantitatively the ability of rock to conduct heat. The theoretical stress analysis and heat flow equations have the values of thermal conductivity and thermal diffusivity as major unknowns. Since the thermal diffusivity is a direct function of thermal conductivity, the accurate determination of these parameters is important.
Specimen Preparation
The conductivity specimen can be in the shape of either a rectangular parallelpiped or a right circular cylinder. Assuming the conductivity probe is 3 in long and 0.065 in. in diameter, the face or diameter of the specimen can vary between 3 and 6 in. The length should be 4 to 6 in. Although the surfaces should be smooth, they need not be polished.
To accommodate the conductivity probe, a hole slightly larger than the probe diameter (0.065 in) and approximately 0.005 in deeper than the length of the probe is drilled in one face along the axis of the specimen. The specimen is then placed in a vacuum desiccator and baked at 65° C for 48 hr. After a 24-hr cooling period, the specimen is ready for testing.
Apparatus
A cross section of the thermal conductivity probe used at BuMines Twin Cities Mining Research Center is shown in figure 90. Of in-house construction, the probe consists of a four-hole ceramic insulator enclosed in a stainless steel sheath with a Chromel-Alumel thermocouple threaded through the ceramic insulator such that the hot junction is at the midpoint of the probe.
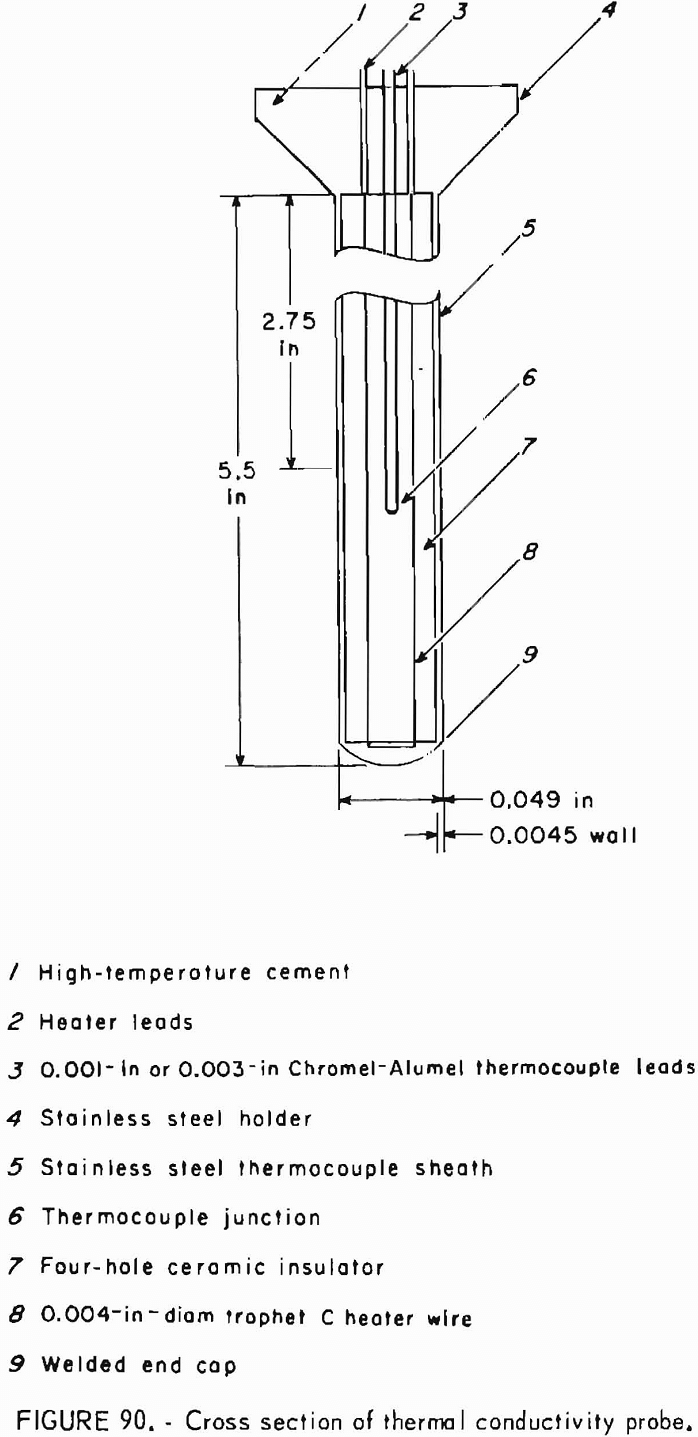
The current supply and measuring equipment associated with the conductivity probe are shown in figure 91. A galvanometer and potentiometer monitor the temperature rise. A Weston ammeter, in series with a constant voltage/current supply, monitors the current supplied to the probe, and a Weston voltmeter monitors the voltage supplied. A X-Y recorder is used as a timing device.
Test Conditions and Limitations
The theory of the transient line source method is based on an idealized system where in practice the ideal conditions are not met. The most important deviations from the ideal line source are the following :
- The theory applied to a perfect line heat source; that is, an infinite ratio of length to diameter for the probe
- the sample has been assumed infinite in extent and homogeneous, and
- a contact resistance may exist between the probe and the sample.
Blackwell thoroughly evaluates the effects of finite probe dimensions, and contact resistance between the probe and the sample. For a probe of finite diameter but infinite thermal conductivity, and with a finite contact
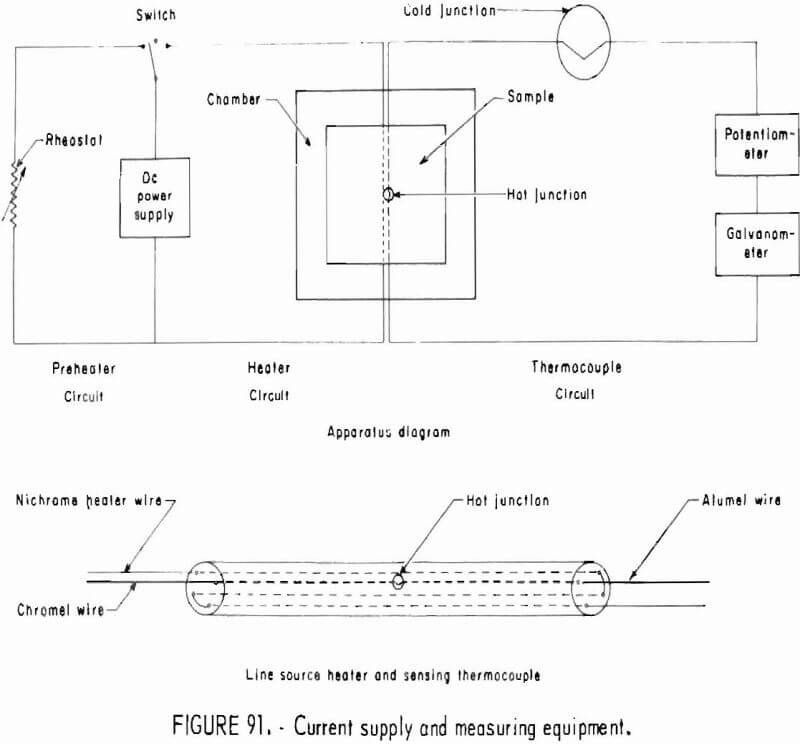
resistance between the probe and the sample, the solution valid at large time values will yield a correct value of conductivity from a simple curve of temperature as a function of the logarithm of time. Blackwell also considers the effects of probe length and concludes that errors due to finite probe length will be less than 1 pct if the length-to-diameter ratio is over 30. Blackwell also considered the possibility of some axial loss of heat but found that a length-to-diameter ratio of 25 pct would be sufficient to limit these errors to less than 1 pct.
Wechsler and Glaser used Woods metal to decrease the contact resistance and report that mercury is also acceptable. Some other experimenters have also used highly conductive silicone grease. Bureau of Mines experimenters have found that the high conductivity heat sink grease gives more reproducible results, provides a better contact between probe and sample, and is easier to work with than those materials.
The theory of the line source, then, can be applied to the finite probe under these conditions:
- Probe length-to-diameter ratio is not less than 30;
- probe materials have low thermal conductivity to minimize axial heat flow; and
- the contact resistance between the probe and the material is minimized.
Analytical Procedure
Once the conductivity probe has been covered with a thin film of heat sink grease and inserted into the specimen, testing may begin. With the experimental setup as shown In figure 91, the switch is turned to the pre-heater position, and a desired current is set by adjusting the constant voltage/current supply. The ice bath is then stirred, and the current setting is rechecked. The pen on the X-Y plotter is set to some desired position (X = 0, Y = 0), the galvanometer is mechanically adjusted to zero, and the potentiometer is standardized. The potentiometer is then set at a value 100 mV higher than the initial temperature.
The power and X-Y recorder are turned on simultaneously, and the millivolt reading is recorded on the X-Y plotter at the time of null occurrence on the galvanometer. The potentiometer is again set ahead for a few millivolts, and the balanced millivolt reading is recorded at the next null occurrence. During this procedure the potentiometer should be standardized as often as possible. Ten minutes of heating is usually sufficient to obtain the required data. At the end of this time, the current and voltage are recorded, and the power is turned off.
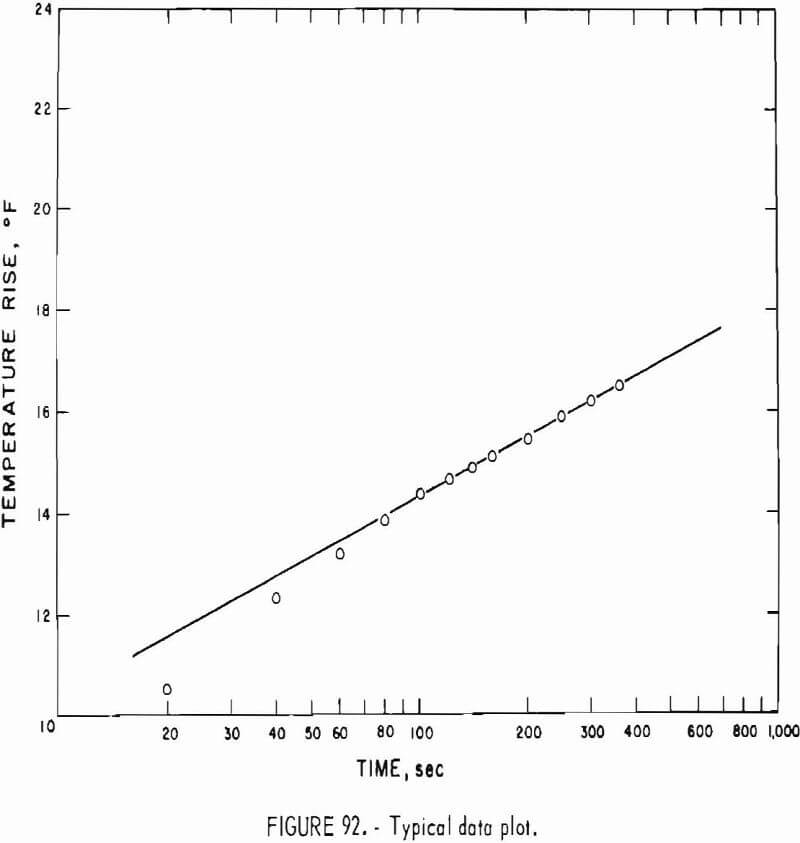
The temperature is then plotted as a function of time on semilog paper. Figure 92 shows a typical data plot. After the initial transient period, the slope of the line will give the required data.
Data Reduction and Analysis
The theory of the transient line source is given in a number of the references; for example. The equation for thermal conductivity is given as

where K = thermal conductivity in Btu/hr ft ° F or cal/sec cm ° C,
Q = heat supplied per unit probe length per unit time in Btu/hr ft or cal/sec cm,
T2 – T1 = temperature rise in °F, °C, or °K,
and t = time in hr or sec.
The initial data are plotted on two-cycle semilog paper; the time is plotted in seconds. Then, it is noted, if t2/t1 = 10 (one log cycle) then log10 10 = 1. The natural log of t2/t1 is converted to 2.303 log10 X, where X = t2/t1. Since the linear portion of the curve usually extends into the second log cycle, X = 10 and the corresponding temperatures θ1 and θ2 are used. Equation 1 then reduces to

A typical value for t1 is 100 sec with the corresponding t2 of 1,000 sec. The temperature rise, T2 – T1, is usually around 3° C or 5° F. The value for Q is computed from the known probe length, the current and voltage measured, and the times t1 and t2. Figure 93 shows the thermal conductivity of basalt as a function of temperature.
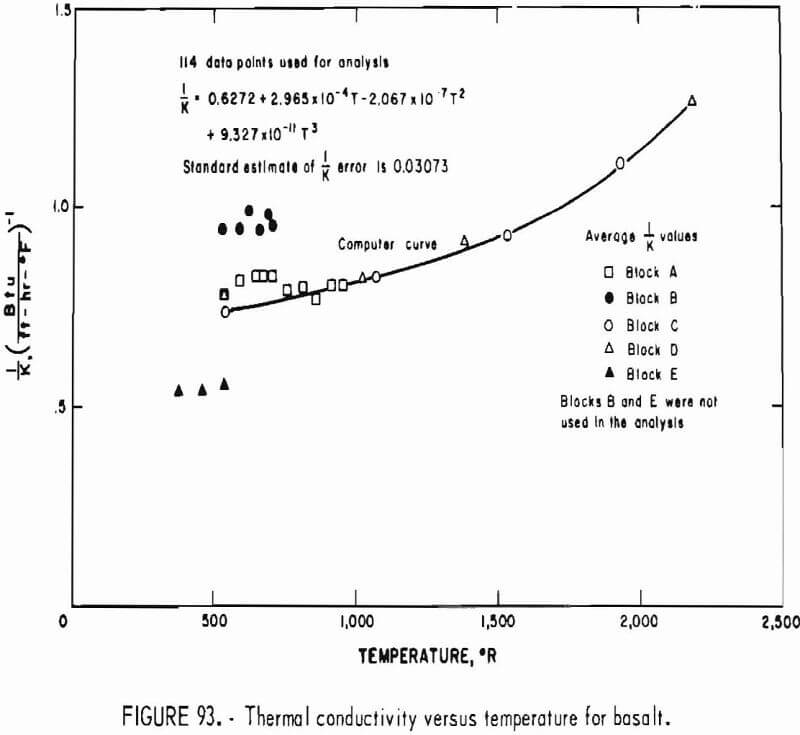
Thermal Capacity
Property
Specific heat, C, Btu/lb ° F, Cal/g ° C, or joules/kg ° K
Use of Property
Specific heat is used to determine the ability of a rock to store heat. First the values of diffusivity and conductivity are the most important properties in thermal stress analysis, and since specific heat is an inverse function of diffusivity, its precise value is quite Important. Second, from an engineering standpoint, the specific heat is important in estimating the cost of heating a material.
Specimen Preparation
The specimens required for this test are of two general types: (1) a solid cylinder sample, and (2) a powdered sample (fig. 94). Either may be used. The solid sample is usually a core drilled from a large block of material. The cylinder must be 1.25 ±0.02 in. in diameter and 2.50 ±0.25 in. in length. To maximize heat conduction to the calorimeter proper, the cylinder should be relatively smooth (polishing is not required), and the ends should be lapped and made perpendicular to the longitudinal axis. In order to suspend the
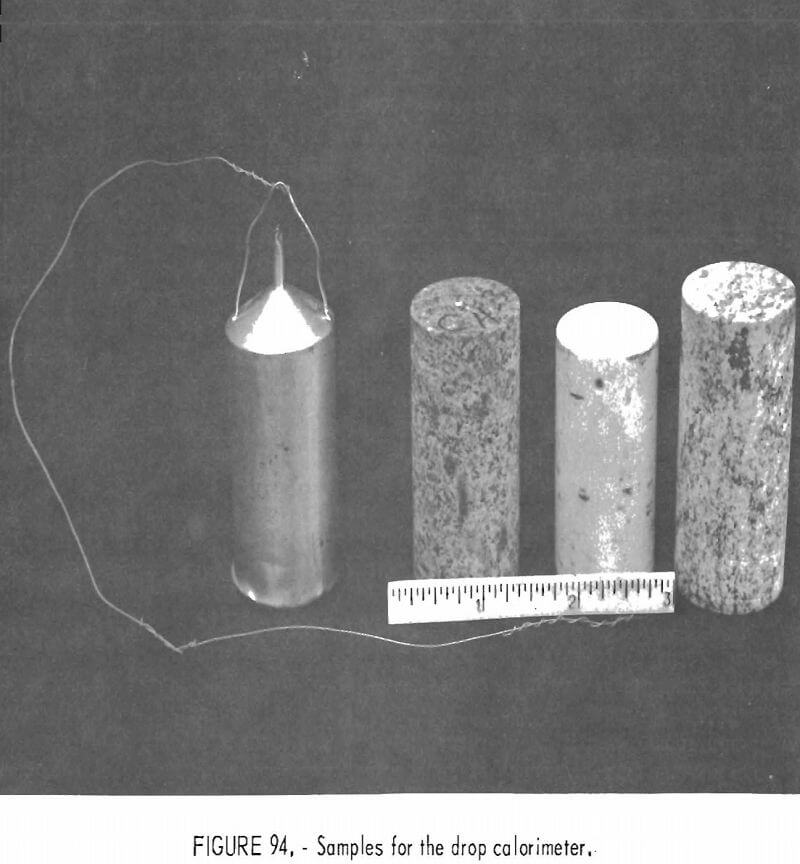
sample in the furnace, a 0.065-in hole is drilled, perpendicular to the longitudinal axis, about 0.25 in from one end of the cylinder (fig. 95). At each side, above the hole, a nick or indentation is made to keep the suspension wire from extending past the wall of the cylinder. Before a test, the cylinder is placed in a vacuum desiccator and baked at 65° C for 48 hr.
For the powdered sample, a sample is cut from a larger block, placed in vacuum desiccator, baked at 65° C for 48 hr, and then powdered by a diamond rusher. Assuming that the powdered material is nonmagnetic, a magnet is passed over the powder to eliminate any possible contaminating metal introuced by the diamond crusher. A cylindrical 90 pct Pt-10 pct Rh sample container, of dimensions shown in figure 96, is filled to the base of the chimney with the powdered material. The filled container is then placed in vacuum desiccator and baked at 65° C for 48 hr. At the end of the desiccation period, the container is evacuated (100 torr) and backfilled with helium gas. Once backfilling is complete, the neck of the container is quickly pinched and flame-sealed by a small hydrogen-oxygen torch. The container is then checked for leaks, and if none are found, the sample is ready or testing.
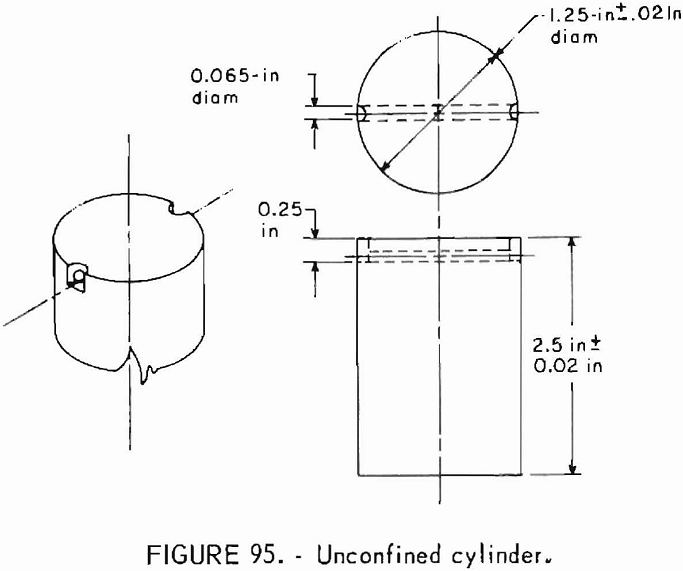
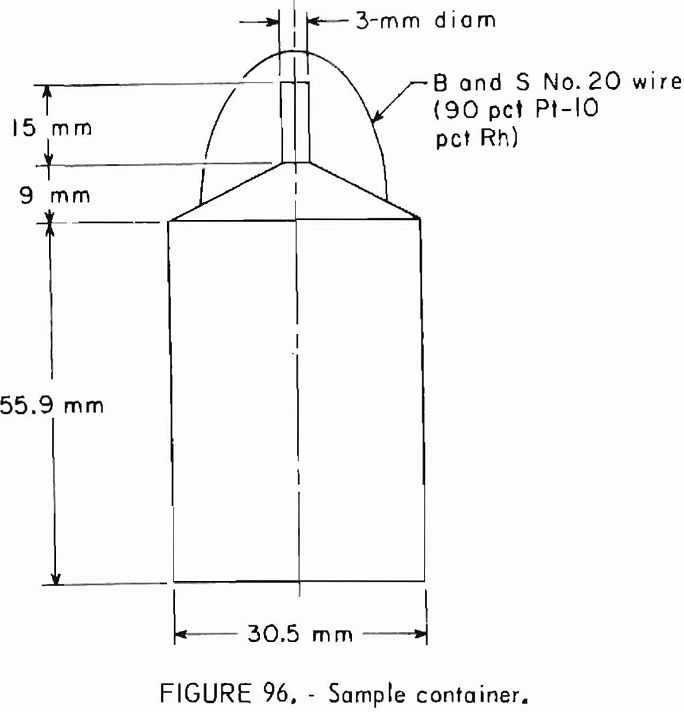
Apparatus
The calorimeter is an isothermal jacket, copper block, drop calorimeter. This system accurately measured the enthalpy difference of a sample between an initial sample temperature and a fixed datum temperature (final receiver temperature).
The drop calorimeter system (fig. 97) consists of a furnace, P, with a three-zone heating element, a calibrated and well-insulated receiver (90-lb copper block), G, into which the sample is dropped, a constant temperature bath, surrounding the insulated receiver, and a drop mechanism, A. The furnace temperature is measured with a thermocouple, C, (either copper-constant or Pt-Pt-10 pct Rh) and monitored with a potentiometer. The temperature change of the receiver is monitored by a commercially available strip chart recorder with a sensitivity of 1 mV full scale, and the temperature readings (in millivolts) are measured with a six-dial, guarded potentiometer in conjunction with a null detector. This system has a sensitivity of 0.1 µV.
Test Conditions and Limitations
This particular test applies to all solid matter, either prepared as unconfined cylinders or powdered and encapsulated, and to encapsulated liquids and gases. The normal temperature range of operation is from ambient to 1,200° C. Results of somewhat lower accuracy may be obtained by swinging
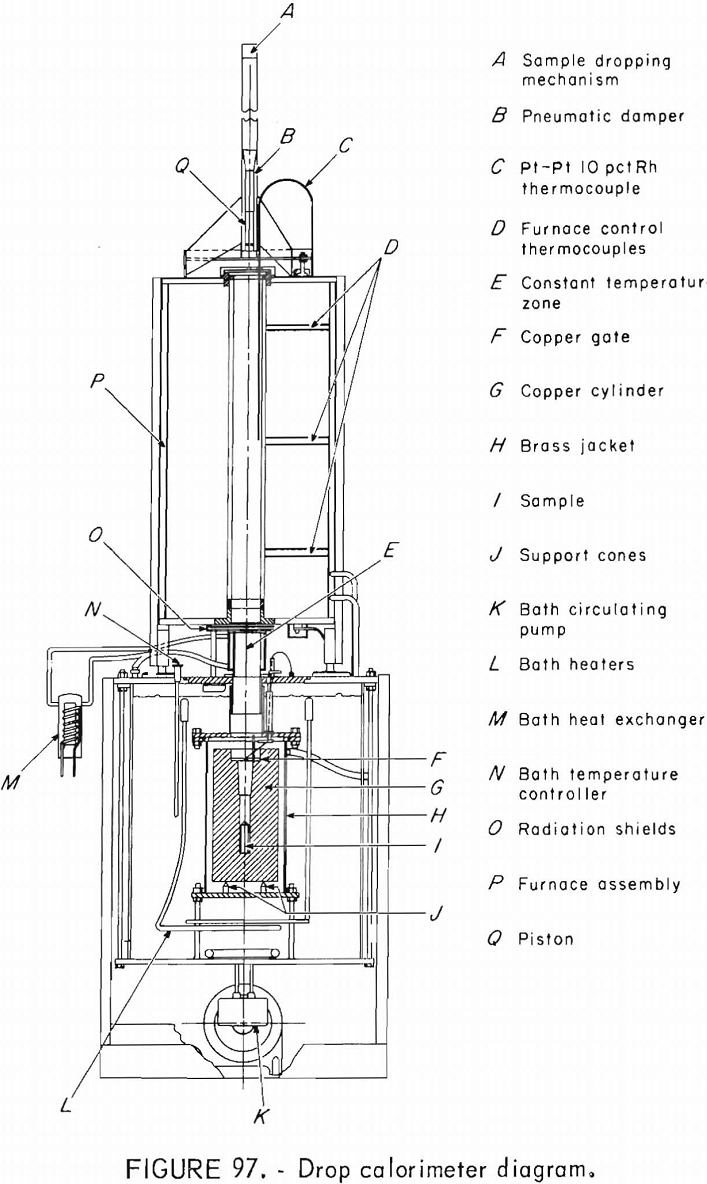
the furnace aside and using a Dewar flask for containing cryogenic liquids to cool the sample for reduced temperature measurements.
Analytical Procedure
After having been prepared and weighed, the sample is suspended in the furnace by a 90 pct Pt-10 pct Rh wire. The furnace power is then turned on, and the controllers are set for the desired temperature. Next the Dewar flask, which contains the thermopile is filled with fresh distilled water and crushed ice. The batch circulating pump, K, and fan are then turned on. The bath thermosensor , N, should have been previously set to 25° C and be maintained at that setting. The receiver, G, should be cooled to a few degrees below 25° C so that the final equilibrium temperature, after the drop, will be 25° ±1° C.
The furnace temperature is first monitored with the strip chart recorder until the desired temperature is obtained. After the desired temperature has been reached the potentiometer is used to monitor the furnace temperature, and the fine furnace controllers are used to maintain the desired temperature.
The sample is allowed to equilibrate in the furnace for approximately 1 hr. During this time the sample is checked for isothermality by moving the thermocouple, C, up and down relative to the suspended sample and correcting any observed gradient by the top or bottom furnace controllers. During the last 15 min preceding the drop, the temperature of the receiver is read with the six-dial guarded potentiometer at 30-min intervals. The furnace temperature is also recorded at these same intervals. The radiation shields are then momentarily opened, and the sample, I, is made to fall into the receiver, G, by depressing the release switch. This operation takes less than 2 sec, and a correction is made for the radiation into the receiver from the furnace. It should be noted that this heat is negligible below 750° C and does not exceed 0.1 pct at the higher temperature.
During the time the receiver is heated, its temperature is first observed at 0.5-min intervals for 10 min and then at 5-min intervals until equilibrium is established. These observations produce the required curve of temperature rise as a function of time for the computation of enthalpy. Figure 98 shows a typical enthalpy-temperature curve.
Data Reduction and Analysis
The drop calorimeter operates on the principle that in an adiabatic system the enthalpy loss of a material, initially at a high temperature, must equal the enthalpy gain of all other substances in the system, which are initially at a lower temperature. If the system consists of a receiver initially at a temperature, Tr , and a sample initially at Ts, where Ts, > Tr, then the enthalpy lost by the sample must equal the enthalpy gained by the receiver when both sample and receiver reach an equilibrium temperature, Tf. Let ΔH = enthalpy difference. Then
ΔHsample = ΔHreceiver……………………………………………….(1)
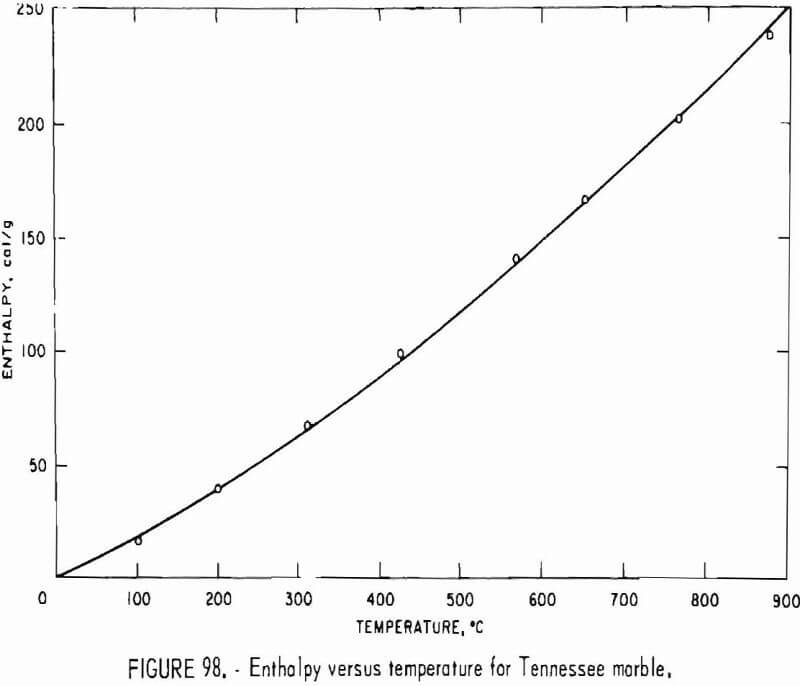
The enthalpy change of the receiver is given by
ΔH receiver = -MCp(Tr – Tf )…………………………………………………….(2)
where M = mass of receiver.
Cp = specific heat of receiver at constant pressure, and so
ΔH sample = -MCp (Tr – Tf )………………………………………….(3)
Since the sample is suspended by a 90 pct Pt-10 pct Rh wire and may be enclosed, in a capsule, a correction is needed for the enthalpy gained by the receiver. Therefore,
Hwire = (MCp)wire (Ts – Tf)……………………………………….(4)
where M = mass of wire or wire and container,
and Cp = specific heat of wire.
The final enthalpy difference of the sample is then given by
ΔHsample = -(MCp)receiver (Tr – Tf ) – (MCp)wire (Ts – Tf)………………………………..(5)
or by rearranging terms,
ΔHsample = (MCp)receiver (Tf – Tr) – (MCp)wire (Ts – Tf)……………………………………….(6)
This final equation then, represents the enthalpy decrease of the sample from the initial temperature, Ts, to the final equilibrium temperature, Tf .
Since in equation 6 the product, MCp, is known for both the receiver and the wire (or container), the only value necessary for finding ΔHsample is the temperature difference in the receiver and the temperature difference in the wire. The receiver temperature difference is obtained by extrapolating the receiver drift rate back to a time where 60 pct of the receiver temperature rise has occurred. This value, Tf, is the actual receiver temperature rise that would result if there were not heat losses. The temperature difference in the wire is obtained from the sample temperature, Ts, and the final temperature, Tf.
After the enthalpy of the sample has been determined, it is plotted as a function of temperature (fig. 98 is a typical curve of enthalpy as a function of temperature for Tennessee marble). An equation is then found for these data, usually in the form of a polynomial. The equation is normally found by the method of least squares. Since the specific heat at constant pressure is given by
Cp = dh/dT………………………………………………….(7)
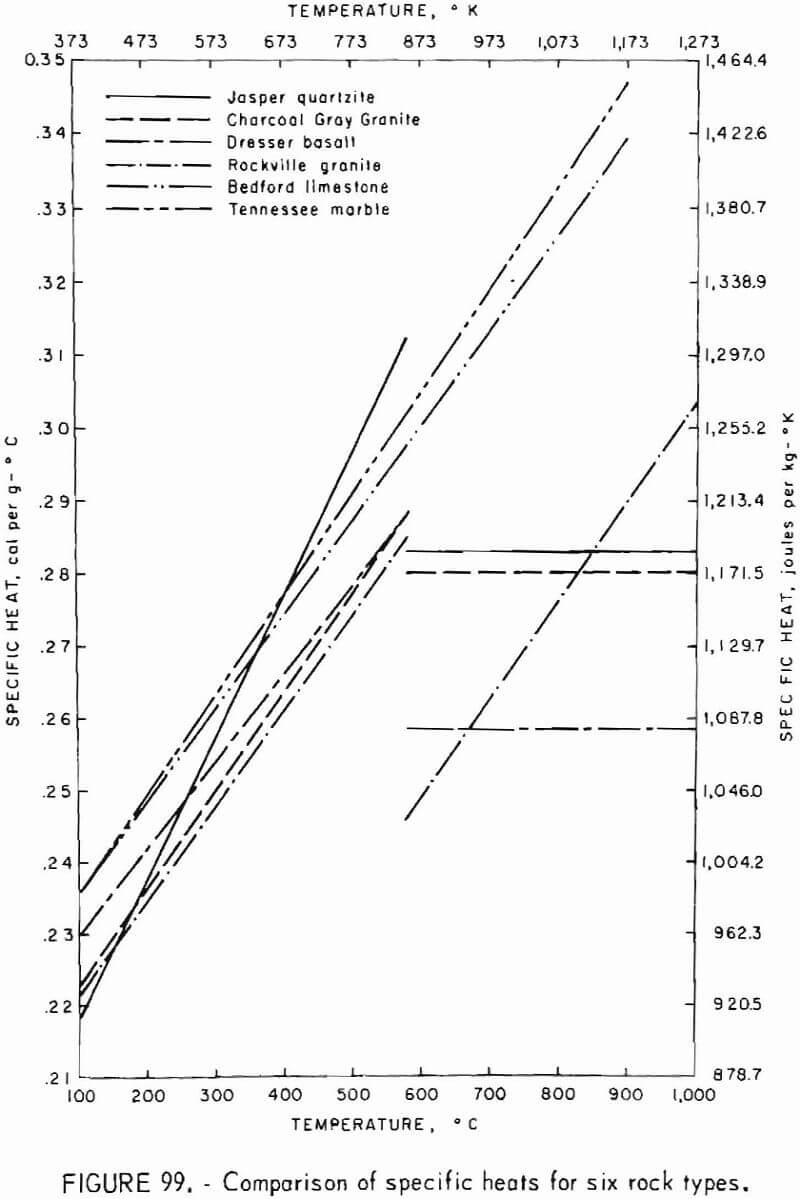
the derivative of the enthalpy equation produces the desired specific heat is a function of temperature, A typical curve of specific heat as a function of temperature for six rock types is shown in figure 99.
Thermal Expansion
Properties
Coefficient of linear thermal expansion, ΔL/L, pct. Coefficient of thermal strain gradient αi, pct/ °F, pct/° K.
Use of Properties
The propperties are used to determine dimensional changes induced when materials are tested at temperatures above or below a reference temperature.
Specimen Preparation
The specimen should be a right circular cylinder cut from a drill core. The diameter can be 0.5 to 1.0 in; 0.75 in is optimum. The length should be between 1.5 to 2.0 in. Each end of the cylinder should be lapped or ground smooth. One end of the specimen also should have a 0.065-in hole drilled in its center to a depth of approximately 0.125 in to accommodate a thermocouple. Once the mechanical preparation is finished, the specimen should be baked at about 110° C for 24 hr to dry out any moisture and establish a standard starting condition.

Apparatus
The apparatus used is a modified version of a commercial quartz tube dilatometer. Figure 100 shows the important details of the mechanical and thermal portions of the equipment.
The test specimen rests on a quartz disk work platform that, in turn, is supported by a quartz work platform holder cemented into a threaded brass base, adjustable in vertical height by a knurled nut. The base rests in the lower end of a cast iron support yoke that is fastened to the main frame and base of the dilatometer to give the work platform a stable, massive support base external to the heat source. A quartz disk, upon which the measuring tube is rested, is placed on top of the specimen. The measuring tube is coupled directly to the core of a differential transformer that transduces the motion of the measuring tube to an electric potential linearly proportional to the motion of the measuring tube over a distance of ±0.50 in. The measuring tube is counterbalanced by spring tension to minimize the force on the top of the specimen. Although the compensating tube is not used in our present measuring setup, it provides some stabilization for the quartz work platform. A Chromel-Alumel thermocouple to measure the specimen temperature running from the bottom of the specimen through the work platform and its holder provides an output voltage proportional to the temperature of the specimen in conjunction with a reference thermocouple.
A hinged tube furnace, whose power input is controlled by a variable transformer, is suspended around the sample, the measuring tube, work platform, and base. Ideally, the furnace power input should be programmable to provide a linear temperature increase with time.
Electrical outputs from the expansion measuring transducer and the thermocouples are applied to the vertical and horizontal axes of an X-Y plotter to give a curve of expansion as a function of temperature.
Test Conditions and Limitations
Changes in length of the specimen can be recorded from approximately the temperature of liquid nitrogen (-190° C) to 1,200° C. At the upper end of the scale, maximum temperature is limited by such practical considerations as melting of the specimen and damage to the quartz components. Most rocks or some of their constituents melt or soften at temperatures of approximately 1,050° C. Fused quartz cannot be used at continuous temperatures greater than 1,200° C without becoming softened and devitrified.
If the specimen is too long, its expansion may exceed the linear range of the transducer.
Analytical Procedure
The specimen is placed vertically on the quartz work platform resting on the holder (fig. 100). A quartz cylinder of outside diameter the same as that of the work platform is set in place around the specimen. The edge of the quartz cylinder is sealed to the platform with a thin film of petroleum grease or silicone grease. This cylinder is not shown in figure 100. The top disk is placed on the specimen, and the quartz measuring tube is set in place and adjusted to give a transducer output a few millivolts on the negative side of zero output. At the time the specimen is placed on the work platform, the temperature measuring thermocouple is passed through the hole in the quartz work platform and inserted into the small hole drilled into the end of the specimen.
The thermocouple reference junction temperature is established by inserting the thermocouple through an insulating cover into a Dewar flask filled with a slush of ice and distilled water of sufficient depth to cover the junction by at least 3 in. The reference thermocouple junction is electrically insulated from the ice bath by enclosing it in a small diameter sealed end tube or other appropriate means. The horizontal axis of the X-Y plotter is calibrated to register the appropriate full-scale millivolt range needed to cover the temperatures of interest. When below-freezing temperatures are to be recorded, the bias control of the recorder is set to permit recording of the necessary negative voltage output.
The vertical axis of the recorder is calibrated with a 0.030- or 0.040-in feeler gage introduced between the quartz measuring tube and the top disk to simulate sample expansion. The recorder sensitivity is adjusted to give an appropriate vertical deflection according to the scale factor wanted. This adjustment will have to be alternated with that on the recorder vertical bias control to give a suitable zero expansion point on the vertical axis along with the vertical deflection sensitivity wanted. If a suitable range and zero starting point cannot be obtained electrically, the quartz measuring tube can be loosened from its coupling to allow a mechanical adjustment of the transducer. The most accurate results will be obtained if the linear range of the transducer is not exceeded and the zero expansion point of the specimen is set so that the transducer is somewhat in its negative voltage output range.
Once the X and Y axes are calibrated, the sample is cooled to -190° C by the addition of liquid nitrogen to the space in the quartz cylinder around the sample. Since the liquid nitrogen boils off as the specimen cools, more is added to keep the sample covered until it reaches its minimum temperature as indicated by the recorder. At this time the tube furnace is carefully closed around the specimen without bumping the platform or measuring tube and changing the zero reference points. After the liquid nitrogen boils away, the specimen temperature will start to rise. As it approaches 0° C, a small amount of electrical energy is applied to the furnace windings to maintain the rate of temperature rise. Then, as needed, additional power is applied to the furnace to take the temperature of the specimen on up to the desired higher limit at a uniform rate of about 4° C/min.
Data Reduction and Analysis
The raw data curve (expansion versus temperature) obtained by the procedure just described is corrected to allow for the small expansion of the quartz platform and measuring tube and converted into a curve showing percent expansion as a function of temperature.
This percent expansion-correction plotting is done in one step by the use of a curve follower attachment on the X-Y plotter, a second X-Y plotter with a retransmitting slidewire on the X-axis, and a correction curve showing the expansion of the quartz measuring tube, top disk, work platform, and holder with temperature.
As the curve follower traces the raw curve, it puts out an analog voltage proportional to the expansion. Before this curve follower output voltage is scaled by the Y-axis gain adjustment of the copying X-Y plotter to record percent expansion. It is reverse biased by output from the X-axis transmitting slidewire of the copying X-Y plotter (fig. 101) , which has been set to correct for the quartz assembly expansion as taken from the correction curve. The shorter the specimen length, the more important becomes the correction for the quartz assembly expansion.
If anisotropy is suspected or obvious because of bedding planes in the rock material, tests should be run on cores drilled parallel to the bedding
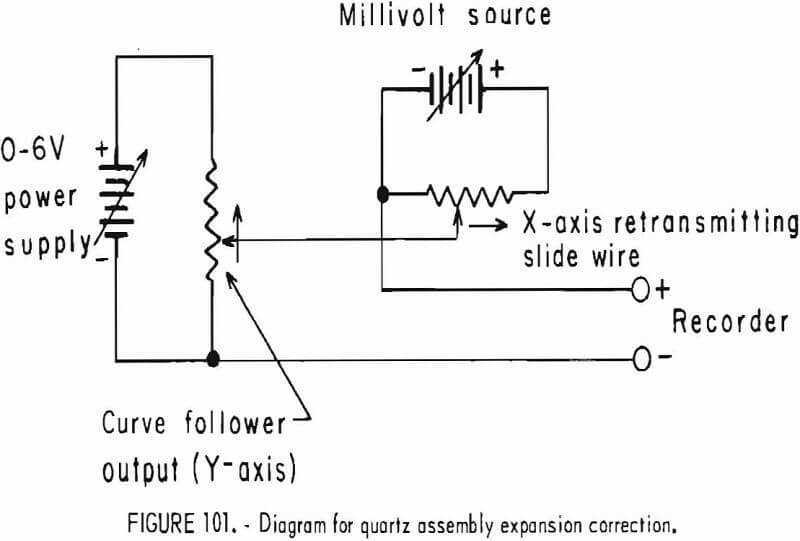
planes as well as perpendicular. At least six specimens of a given orientation should be tested. An average or mean curve of percent expansion as a function of temperature is obtained from these specimens. An indication of the spread of percent expansion with temperature may be useful in some cases, particularly in the case of nonhomogeneous rock.
Units are percent expansion,
ΔL/L…………………………………………………………………….(1)
where ΔL = change in length,
and L = original length at ambient.
If anisotropy is apparent from the test runs, the results should be classified according to the type of anisotropy before the averaging is done.
The average or mean curve of percent expansion as a function of temperature is differentiated manually or electronically by use of an operational amplifier and curve follower, to give an average curve of the coefficient of thermal expansion gradient.
Units are
αi = d(ΔL/L)/dT………………………………………………………………………(2)
where T = temperature , K or C,
and αi = coefficient of linear thermal expansion gradient.
