Table of Contents
- Radiographic Principles
- Preliminary Studies
- Experimental Radiographic Procedures
- Enhancement of Radiographic Data
- Limestone Specimens Type “1”
- Shale Specimens
- Sandstone Specimens
- Limestone Specimens Type “2”
- Effects of Usually Insignificant Cassette Variables
- Summary of Preliminary Work
- Introduction to Advanced Studies
- Production of Multiple Sets of Standard Radiocraphs
- Experimental and Theoretical Studies to Define the Relationship of Stress to Radiographic Change
- Summary
- Microdensitometer Modifications
- Radiograph Cutting Procedure
As part of a program on mine safety directed by the U.S. Bureau of Mines, the Oak Ridge National Laboratory (ORNL) studied radiographic techniques on specimens of stressed rock. This phase of the program on mine safety is related to the structural integrity of the roof of the mine. A common practice for roof support within a mine is to use expansion anchors, which are inserted several feet into the root strata. These anchors are, in turn, attached to long threaded steel shafts that extend through the roof structure to a pressure plate on the under surface of the mine root. As tension is applied to the shaft, the anchor seats itself into the surrounding rock, and the pressure plate is pulled upward on the underside of the roof. The radiographic program at ORNL on selected specimens of rock and anchors was intended to allow (1) observation of the behavior of the anchor-bolt as it interacts with the rock when load is applied, (2) detection and observation of macroscopic changes (cracks, shifts in strata, etc.) in the rock specimens under load, and (3) detection, observation, and, eventually, analysis and measurement of more subtle changes in the rock specimens under stress.
Radiographic Principles
The radiographic process involves transmitting x or gamma rays from a source through a specimen, with detection usually by means of a film containing a photographic emulsion. The radiation beam is modulated according to the transmission properties of the specimen being examined in accordance with the expression
![]()
where
I = the beam intensity transmitted through the specimen,
Io = the beam intensity impinging, on the entry surface of the specimen,
µ = the mass attenuation coefficient (cm²/g) : a function of both radiation energy and the chemical composition of the specimen,
p = the physical density (g/cm³) of the specimen, and
x = the thickness (cm) of the specimen.
Thus, as any of the three factors in the exponent change (or are different in different parts of the specimen), there will be a change in the transmitted intensity. This will result in a variation in film blackening of the processed radiograph.
Preliminary Studies
Specimens and Equipment
The first experiments were conducted by personnel of the U.S. Bureau of Mines using 9-in. cylinders of limestone and gamma rays from a Co source. The intriguing potential of radiography was obvious and led to the association with ORNL for more detailed examination of the potential of the technique and the necessary development.
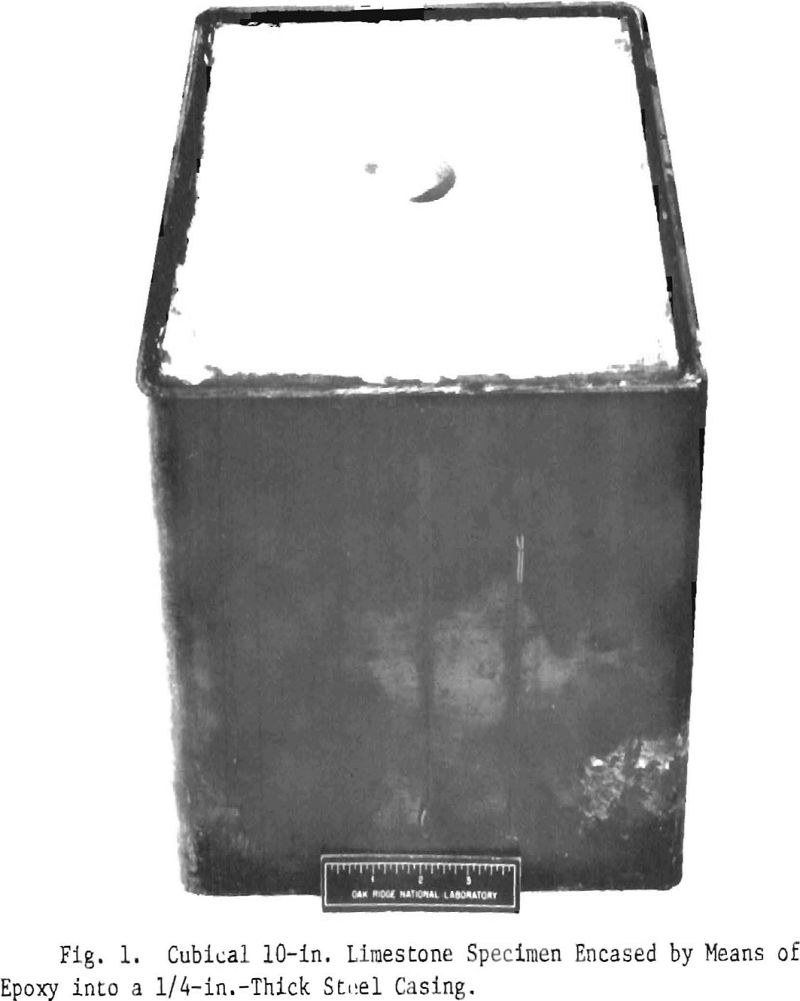
The first specimens received by ORNL for study were 10-in. cubes of Indiana limestone, which was recommended because of its homogeneity. Each cube was encased with epoxy into a ¼-in.-thick steel casing, which covered the four vertical sides. Figure 1 shows an encased block. The steel casing provided lateral restraint to the rock specimen under load. A 1 3/8-in.-diam hole was drilled completely through the center of the block from one exposed face to the other for insertion of the anchor-bolt.
A 2-MeV x-ray machine that was available in Oak Ridge was chosen for the radiography. We had two primary reasons for selecting this unit rather than others equally available: (1) the energy is approximately equivalent to that from 60Co, and if it became desirable later to use isotopes, the general techniques would be comparable; and (2) the energy and intensity of the 2-MeV machine were appropriate for this size and thickness of specimen, yielding good quality radiographs in a reasonable time.
Technique Development
Wo experimented with various combinations of exposure time, radiographic film, and intensification screens to determine the optimum combination to produce high-quality radiographs. In the adopted technique the 0.4-mm focal spot was placed 100 in. from the radiographic film holder (cassette). This, in turn, was placed immediately behind the specimen being examined. The film was processed in two different ways, by hand and in a completely automatic system. No significant
differences in the results were noted, so automatic processing was used throughout the remainder of this phase of the project because of the speed, convenience, and availability of the equipment. Other details of the adopted radiographic technique include an exposure of 4 min on type M film that is contained in a cassette with the following sequential arrangement of film and lead screens: 0.020 in. Pb, 0.005 in. Pb, film, 0.005 in. Pb, 0.005 in. Pb, film, 0.005 in. Pb, and 0.020 in. Pb. The lead screens absorb and filter some of the unwanted secondary radiation to prevent its reaching the film. Also, those screens immediately adjacent to the film decrease the required exposure time by generating photoelectrons, to which the film is much more responsive than it is to the 2-MeV x rays. The cassette was placed on a 1/8-in.-thick plate of uranium to minimize effects from backscattered radiation.
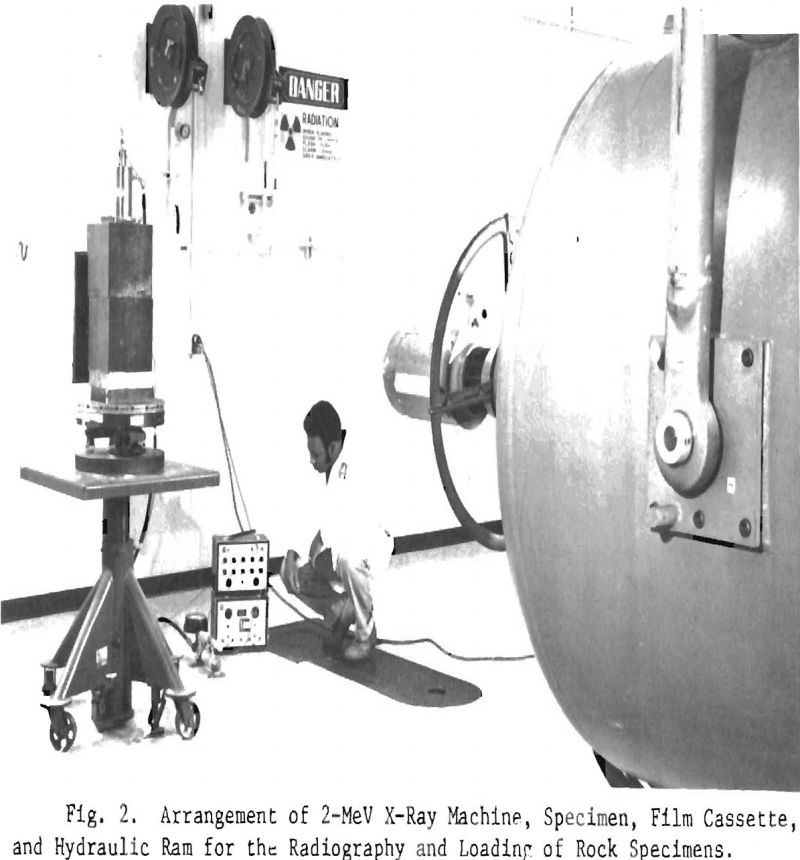
The first radiographs showed a significant nonuniformity in film darkening, even though the specimen was uniform in thickness and rather homogeneous. The nonuniformity was caused by a significant amount of scattered radiation and would have made the radiographic interpretation very difficult. To overcome the scatter problem, we placed other blocks of rock adjacent to the one being radiographed and achieved a rather uniform radiograph. We determined later that much of the degrading scatter in the regions of interest was coming from the floor behind the film cassette, because we made these exposures with the specimen lying on the floor with the x-ray machine suspended vertically above the specimen. Thus, when the blocks were placed on a table that was 10 ft from a wall and 4 ft above the floor for radiography in the horizontal position (for ease of film handling and block stressing), the adjacent blocks for masking were not required (except for one on top in line with the drilled hole). Figure 2 shows the arrangement of the x-ray machine, rock specimen, film cassette, and hydraulic ram. The ram was used to apply load through the bolt and anchor to the rock specimen.
Experimental Radiographic Procedures
Specimens and Anchors
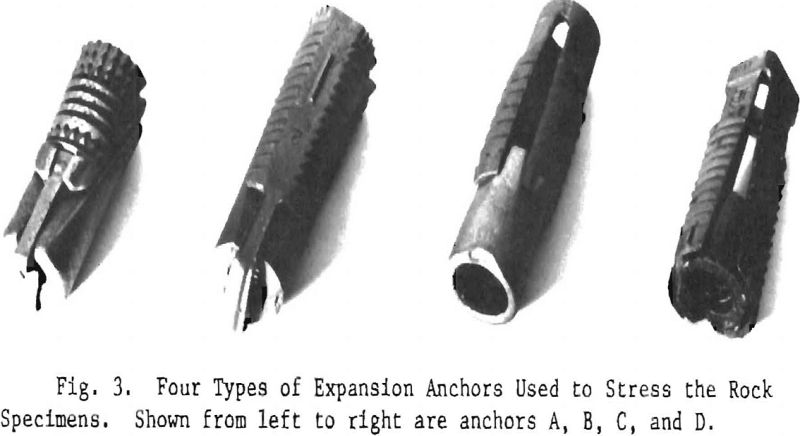
Several sets of specimens were loaded and radiographed. The chronological order of specimen examination was Indiana limestone, shale, sandstone, and a second group of limestone. Four different types of expansion anchors, which are shown in Fig. 3, were used in most of the groups. The first anchor, on the left in the photo, is a two-leaf expansion shell, which we arbitrarily designated as the type A anchor. The second anchor from the left is a different style two-leaf expansion shell and will be referred to as the type B anchor. The third anchor is a four-leaf expansion shell and will be called type C. The remaining anchor, on the extreme right, is another style of four-leaf expansion shell and is designated type D. Only the type A anchor was used during the initial experiments, which involved the first group of limestone blocks.
Testing Procedures
A standard procedure was established for radiographing the limestone cubes. In special cases, there were minor modifications to this procedure. Initially each block was radiographed to qualitatively determine its relative homogeneity. This was done to aid in the selection of blocks for specific experiments. After selection of a block the anchor-bolt assembly was inserted in the center-drilled ho]e of the specimen and carefully aligned so that the beam of radiation would be properly aligned relative to the expansion leaves. In most cases successive radiographs were made under identical conditions, with the radiation beam either perpendicular or parallel to the plane of the expansion leaves. The anchor-bolt assembly was hand-tightened to lock it into position in the hole but with essentially no load. Radiographs taken at this level provided base-line data for the condition of zero load. The load was applied by a hydraulic ram supplied by the Bureau of Mines.
Figure 4 shows a cross section of the rock specimen mounted in its steel casing, the expansion anchor in position, and the threaded rod connecting the anchor wedge to the Strainsert bolt through the hollow plunger of the single-acting hydraulic ram. The Strainsert bolt is a load-sensing bolt with built-in foil-type electric-resistance strain gages. The gages are bonded and sealed in a small hole along the longitudinal neutral axis of the bolt, and the hole is filled with an inert plastic material. The bolt used contained a 4-arm, 120-Ω full bridge with two active gages in opposite arms to monitor vertical movement and two gages in the remaining arms to compensate for lateral movement. The bridge circuit has other resistances for temperature compensation and zero-load balancing. A BLH portable model 120 strain indicator with a gage factor of 2.5 lb per microinch per inch was used to measure the
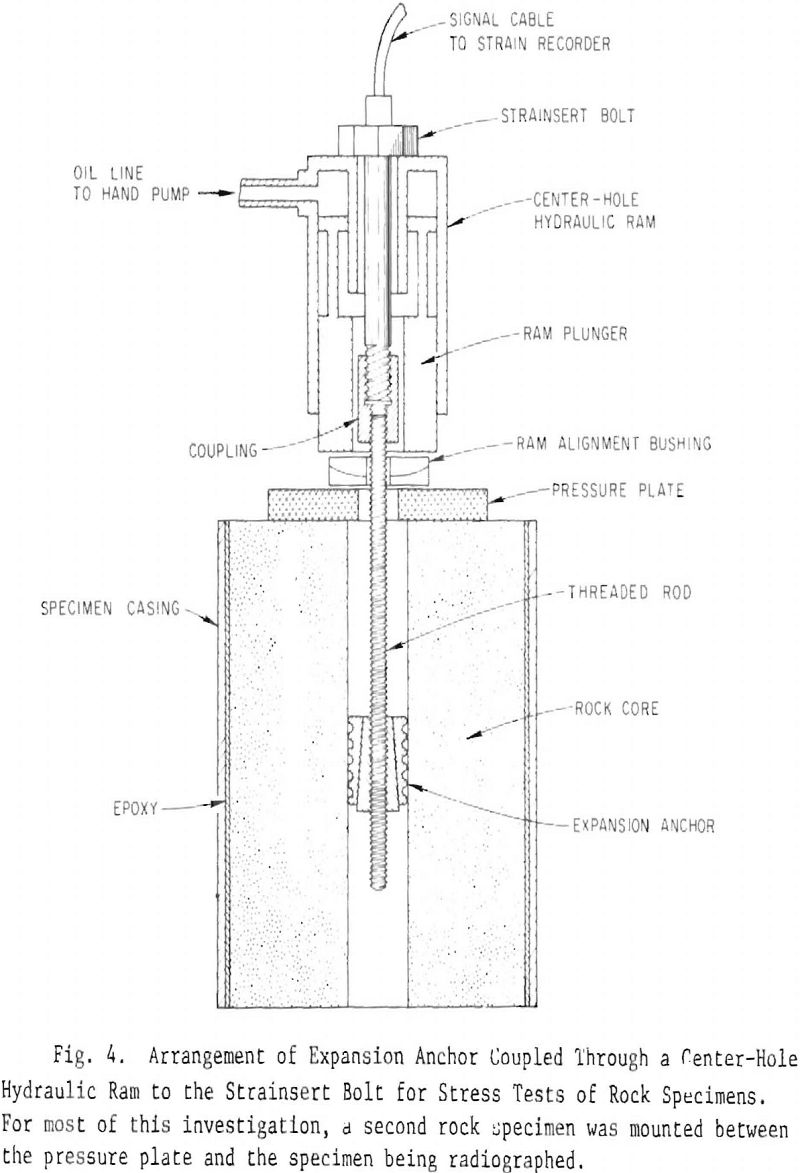
strain. The Strainsert bolt was calibrated by loading it on a Tinius-Olsen load tester from 0 to 24,000 lb in 100-lb. increments.
As pressure was applied to the hydraulic ram by operation of the hand pump, the ram casing pushed against the head of the Strainsert bolt. Thus, a tensile force was applied to the body of the Strainsert bolt and the threaded rod because they were coupled to the wedge of the anchor. This applied force pulled the tapered wedge upward between the anchor leaves and forced the leaves outward. This outward force on the leaves caused the teeth to bite into the rock and applied a stress to the rock. Each block was loaded according to predetermined schedule of increasing load, and radiographs wore made at each plateau of load. Usually the time lapse between application of increased load was only long enough to allow the desired radiography to be performed. However, in some experiments, this time lapse was for as long as one week at a specified level of stress. In the latter cases, the loss of load was recorded. Details of the various load schedules will be noted in discussions about the different rock materials.
Preliminary Microdensitometry
To achieve quantitative measurements of variations in film density caused by changes in the level of stress we scanned each radiograph with a microdensitometer. The scans started parallel to and 1/8 in. inside the edge of the image of the center hole, then progressed with parallel scans in ¼-in. increments outside the hole for a distance of 3 ½. in.
The operation of this densitometer is based on a double-beam light system, in which two beams from a single light source are switched alternately to a single photomultiplier. If the two beams have a different intensity, the photomultiplier produces a signal, which, after amplification, causes a servo motor to move an optical attenuator so as to reduce, the intensity difference to zero. In this way, the position of the optical attenuator is used to record the density at any particular part of the specimen. To permit continuous recording, the density range of the optical attenuator (gray wedge) must be selected to fully cover the range of densities on the radiograph of the specimen. The null balance system makes the instrument almost independent of its own parameters and results in a direct and linear recording of density. Calibration is accomplished by scanning a gray scale step film and recording the level (chart reading) for each step density value. Minor modifications were made to the specimen table and traverse frame of the densitometer to accommodate 12 x 12-in. radiographs. Details of these modifications and the method used to precisely cut the radiographs are in the appendix.
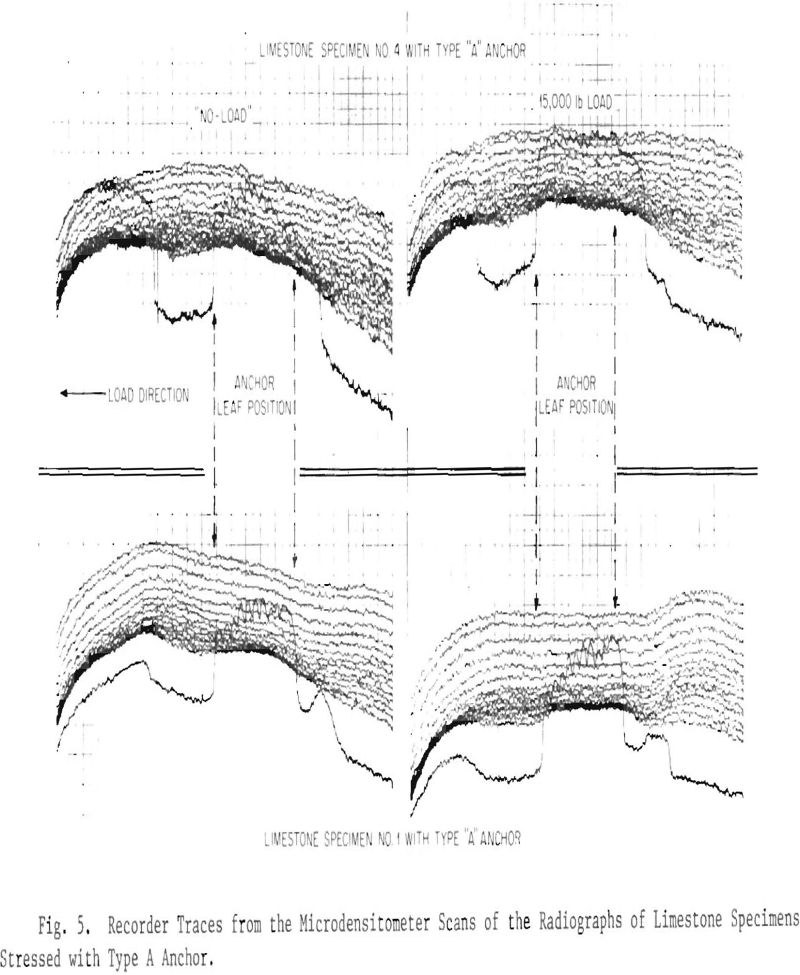
Figure 5 shows recorder traces from the densitometer scans of two limestone specimens (block 4 at the top and block 1 at the bottom) at no load (left) and at 15,000 lb (right). The bold scan in each recording was made on a line 1/8 in. inside and parallel to the hole. The lower scan line of each band (scan in hole excluded) is nearest the hole and corresponds to the highest film density. Note the overall change in slope between no load and 15,000 lb and a slight decrease in film density in the region near the initial contacting teeth of the anchor at 15,000-lb load. These scans indicate that a change has occurred in the rock from no load to 15,000 lb and has altered the pattern of radiation reaching the film. The severe density gradient on the left edge of the scan was caused by failure to mask the top of the block. This was subsequently corrected by masking with another block (as shown in Fig. 2).
Enhancement of Radiographic Data
The changes in the film density of the radiographs as a function of applied load were small and subtle. Because of this, there was interest in enhancement of the radiographs to improve our ability to extract the data, with the first emphasis on techniques for improved contrast sensitivity. Several approaches were considered, including photographic, optical, electronic, and computer methods. Those selected for first feasibility studies were chosen on the basis of relative simplicity, low cost, and accessibility of equipment.
Photographic Methods
One photographic method consisted of making direct contact transparencies with film. The exposure techniques were adjusted to increase the film contrast in the region of interest. By using a radiographic duplicating film, we avoided the common problem of reversal of the
black-white polarity on the copy and obtained duplicates with the same appearance as the original except for the increased contrast. The technique was developed with optical step wedges that provided an effective range of densities over which acceptable results could be obtained, so that the amount of contrast enhancement and linearity could be quantitatively determined. By second-stage duplication (duplicating the duplicate) we were able to double the original film contrast with good fidelity. However, the exposure and processing of the duplicates was critical and time consuming, and both significant and nonsignificant variations were enhanced alike. Further study along this avenue was discontinued.
Another photographic technique was directed toward enhancing the capability to extract only the density information representing a change between the unloaded and loaded conditions of the specimen. In this approach, a direct contact transparency (a reversal) was made of a radiograph. Thus a high-density region on the original would become a low-density region on the reversal (and vise versa). If the resulting density of the negative is in the linear response region of the film, when the negative is superimposed on the original, the combination should produce uniform density throughout the area. If the two superimposed films represented different conditions of a specimen, the radiographically different regions would show accentuated variations in density from the uniform background density of the unaffected areas. This was demonstrated to be feasible in tests on a gray scale density wedge such as used to calibrate densitometers when the combined density was within the useful operating range of our microdensitometer.
To test the approach on an actual specimen we made a negative of the radiograph of a block at no-load and superimposed it on the radiograph of the same block at 15,000 lb load. Enhancement of the stressed area was not apparent because the resultant film density was above the usable range of the densitometer. We did not pursue this technique further because all of our radiographs would have yielded a combined density higher than the operating range of our densitometer. In addition, the technique for making the reversal of the radiograph with proper density and contrast was quite critical and time consuming.
Densitometric Subtraction
Manual Method
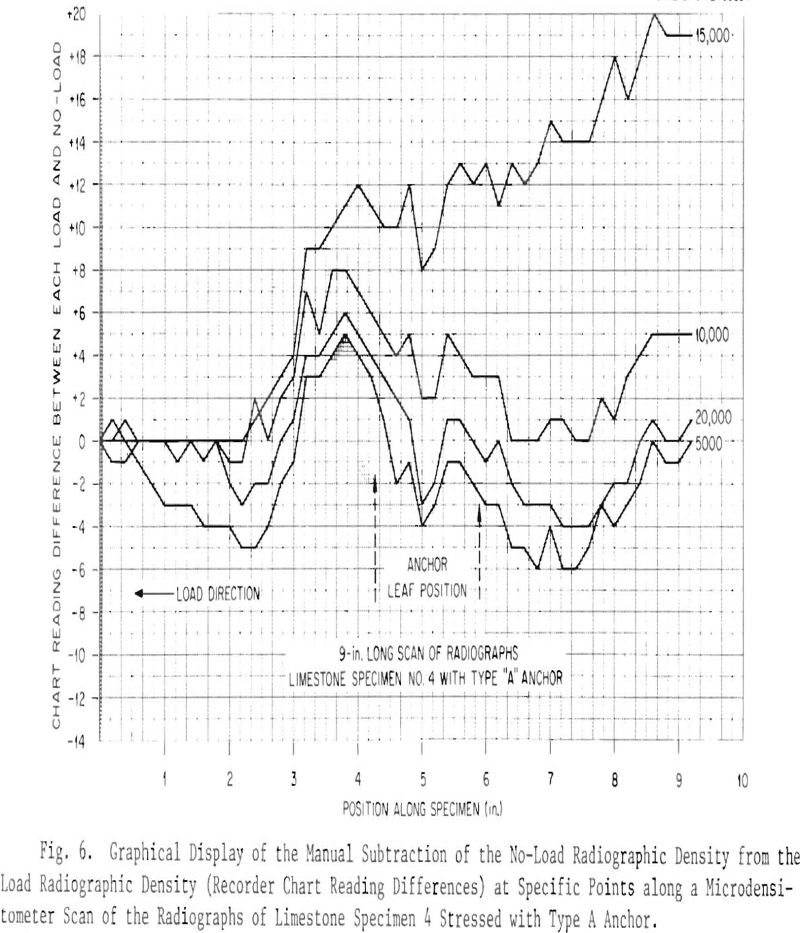
An additional approach to enhance these extremely small differences in radiographic density, despite background variations, involved subtraction of the microdensitometer recorder chart reading at no-load from the chart reading at each load at ¼-in. intervals along the first scan (1/8 in. outside and parallel to the hole) and comparing these differences. The chart readings were normalized on the end near the pressure plate. Limestone block 4 was arbitrarily chosen for this analysis. It can be seen in the resultant graphs in Fig. 6 that, as the load is increased, there is an increased difference in the localized radiographic density from the no-load condition up to the 15,000-lb load. However, at 20,000 lb the difference returns to a level approximating the 5000-lb load. Although not plotted, visual examination of the density charts of the four other blocks indicated a similar phenomenon.
Electronic Method With Tandem Microdensitometers
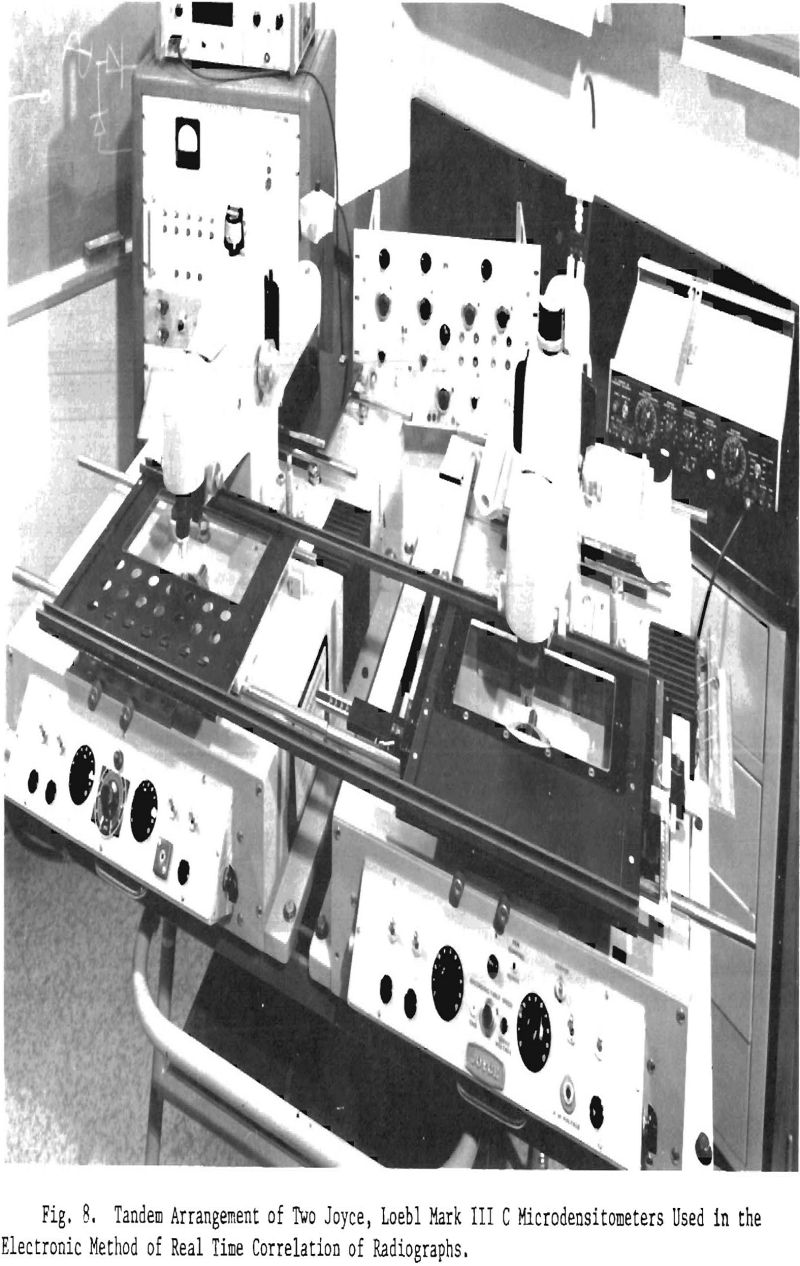
The investigative work with manual subtraction of density values between stressed and unstressed conditions led us to consider a more rapid and accurate approach using an electronic system with two microdensitometers to simultaneously measure film densities in two companion radiographs representing the stressed and unstressed states. Preliminary qualitative work with existing equipment demonstrated the initial feasibility. The existing equipment consisted of (1) the Joyce, Loebl Mark III C microdensitometer, (2) a photomultiplier tube with power supply and collimated light source, which served as the second densitometer, (3) a Tektronix 585A oscilloscope with a type O operational amplifier plug-in unit. Because the voltage outputs of the two densitometers were quite different in amplitude as well as of opposite polarity, a voltage divider network was designed and inserted in the output of the Joyce, Loebl unit. This divider network allowed removal of an output signal from the Joyce, Loebl equal in amplitude to that from the hybrid second densitometer. The type O operational amplifier plug-in unit along with the Tektronix 585A oscilloscope allowed algebraic subtraction of the two densitometer
signals. After demonstrating the feasibility of electronically subtracting the two signals and achieving enhancement or amplification of the difference signal, we obtained from the Bureau of Mines a microdensitometer very similar to the one at ORNL. Minor structural modifications were needed in the second unit, and we needed to design and fabricate the secondary electronic system for data processing.
The second densitometer was modified to provide a light-weight film specimen table needed to accommodate 12 x 12-in. radiographs and to precisely follow the motion of the traverse frame of the first densitometer in both the x and y directions. The. manufacturer’s traverse frame of the second densitometer was replaced by a table fabricated from a thin plate of aluminum and rigidly connected to the traverse frame of the first densitometer by two parallel strips of Unistrut channel. Teflon blocks were attached to the underside of the aluminum plate for bearings to allow the table to glide on the main guide rods, and an aluminum strip was attached to the top of the plate to serve as the basic guide to position the radiographs on the specimen table. Both traverse frames were moved in the x and y directions by the driving mechanisms of the first densitometer.
Since the success of this method depended upon the simultaneous interrogation of the same area on two radiographs, precise alignment of the two radiograph positioning guides was extremely important. This was done by observing the spot of light (produced by the interrogating beams) projected on the edge of a steel rule that lay across the traverse frames of both densitometers. The rule was adjusted until the size of the spot of light did not change as the frames traversed the full 9 in. of scan travel. At this point, the radiograph guide strips were set normal to the edge of the rule, and index lines were scribed into each guide strip for positoning the center line of the image of the hole of the rock specimen. The perpendicular distance from the guide strips to the interrogating beams for the two densitometers was matched by adjusting the length of the two Unistrut channels that connected the traverse frames.
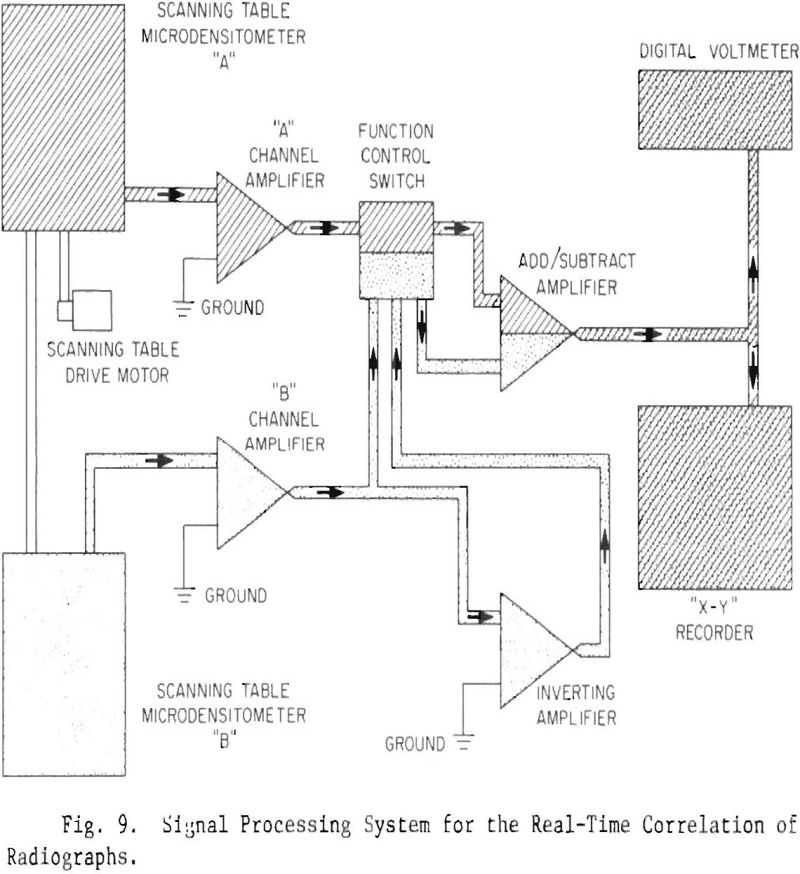
The normal mode of operation for the microdensitometer records the analog values of density directly on an x-y recorder with the x-axis values related to physical movement of the film and the y-axis values related to film density. For the tandem system it was necessary to extract the electrical signal from each of the microdensitometers for processing. We substituted a potentiometer for the last fixed resistor of the photomultiplier dynode chain in each densitometer to extract this signal and to allow adjustment of each instrument to the same signal output at the zero density level, as shown in Fig. 7. Appropriate operational amplifiers were selected and installed in the system for signal amplification before recording. This also allows matching of the relative response of signal output to change in film density of the two microdensitometers. From the operational amplifiers (“A” and “B”) the respective signals are directed to a function control switch to allow subsequent selective recording of (1) the individual output of either microdensitometer; (2) the sum of the two signals; or (3) the difference produced
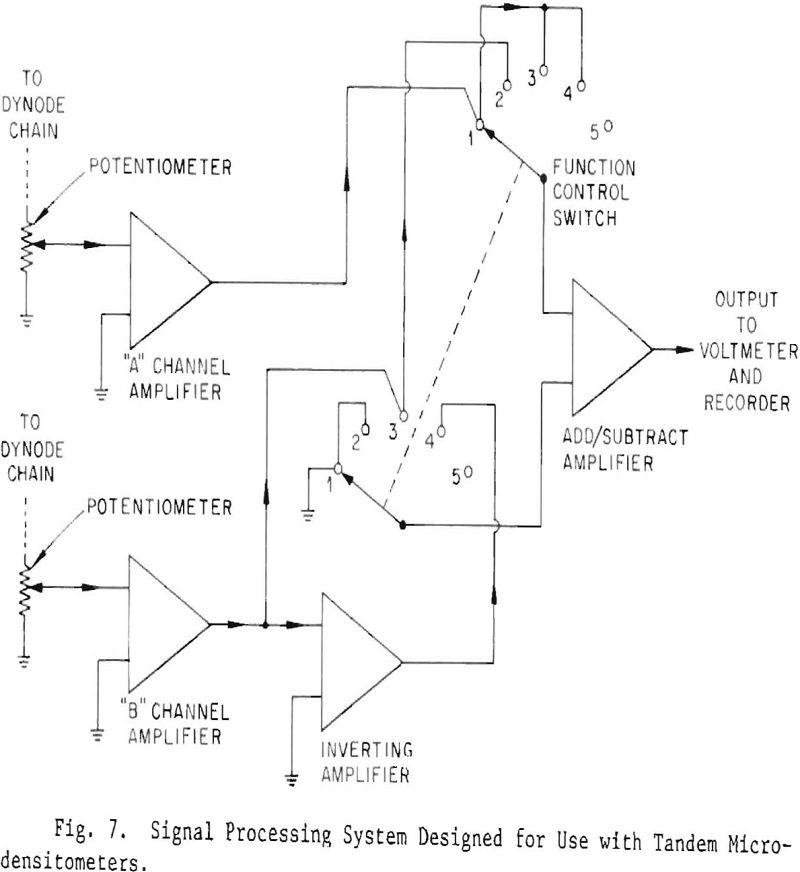
by subtracting one signal from the other, by using the inverting amplifier to reverse the polarity of the output from amplifier “B”. The last option is of primary importance, because it allows canceling of background variations that are common to both radiographs and permits amplification of the differences (e.g., produced by stress). The selected output from the function control is monitored by a digital voltmeter and recorded in analog form by an x-y recorder.
Figure 8 shows the tandem arrangement of two Joyce, Loebl Mark III C microdensitometers used in the electronic method of real-time correlation of radiographs. Also shown are the associated digital voltmeter, signal, processing system chassis containing the operational amplifiers and function control assembly, and x-y recorder.
A block diagram of the system is shown in Fig. 9. A no-load radiograph would be placed on the scanning table of densitometer “A” and a load radiograph on densitometer “B.” The signal from each densitometer would first be amplified and passed to the Function Control Switch. Selection then permits the readout of densitometer “A,” densitometer “B,” sum of densitometers “A” and “B,” or difference between densitometers “A” and “B.” The selected output is monitored by a digital voltmeter and simultaneously routed to an x-y recorder, where additional amplification can be achieved.
Figure 10 shows the results of scanning the radiographs of limestone specimen 4 with the tandem densitometer system, with which the no-load radiograph was electronically subtracted from each of the load radiographs. The y-axis controls of the x-y recorder were adjusted so that 10 mV difference in the output from the “A” and “B” amplifiers would produce a deflection of 1 chart division on the recorder paper. A 0.02 film density difference was approximately 130 mV, or 13 chart divisions. This electronic subtraction produced scans quite similar to the manual subtraction results in Fig. 6.
This unique microdensitometric scanning system has been successfully used to extract the difference in film density of only 0.01 unit between two radiographs and record this difference on an x-y recorder. It has been used in the examination of the radiographs of the limestone, sandstone, and shale specimens.
Limestone Specimens Type “1”
The first series of experiments involved limestone blocks. These blocks were Indiana limestone that came from a quarry in Bloomington, Indiana, and were identified as type 1. Each of four encased limestone blocks was radiographed before being loaded with the type A anchor inserted with its leaves parallel to the x-ray beam. Subsequently, the anchor in each block was loaded to 5000, 10,000, 15,000, and 20,000 lb, as measured by the Strainsert bolt, and these blocks were radiographed at each load. Visual inspection of the rock image on the radiographs did not reveal any changes in film density as a function of load. However, the microdensitometer scans of the radiographs (for example, Fig. 10) showed an ordered change in radiographic density as a function of increased load to the 15,000-lb level. At the 20,000-lb level the ordered change
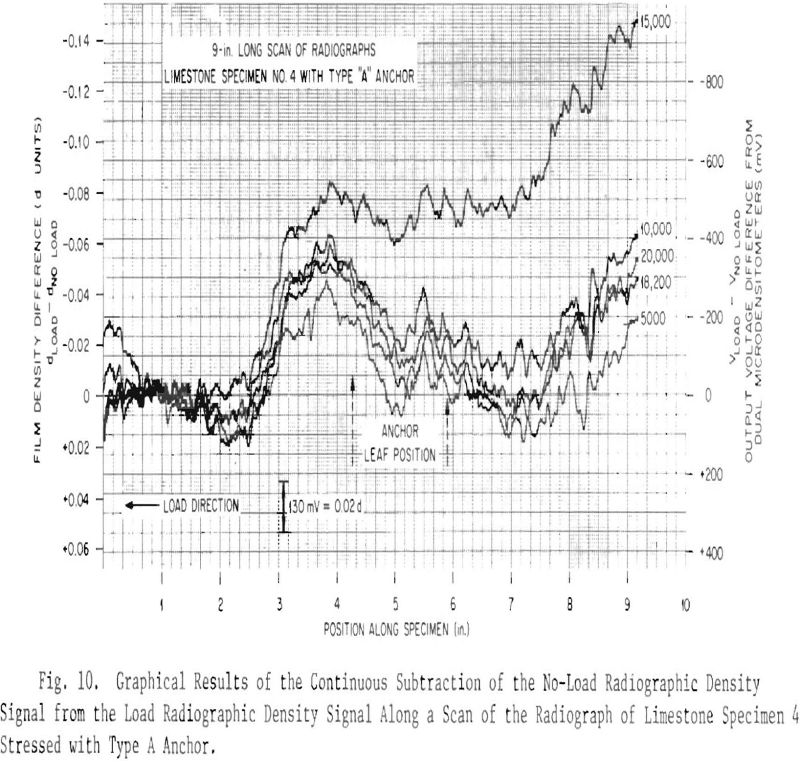
reversed toward the no-load radiographic density. This reversal probably occurred when the specimens cracked as the load was increased from 15,000 to 20,000 lb.
Shale Specimens
The nine shale specimens supplied to us were 11 ½-in.OD x 11-in.- long cylinders. These were encased with epoxy in 12 ¾-in.-OD x ½-in.- thick steel pipe. Since these specimens were cylindrical and the x rays were transmitted through the specimen perpendicular to the axis, a mask was needed to counteract the specimen thickness change and achieve a radiograph with a reasonably uniform density. We built square aluminum containers with a hollow cylindrical core as shown in Fig. 11. The void between the
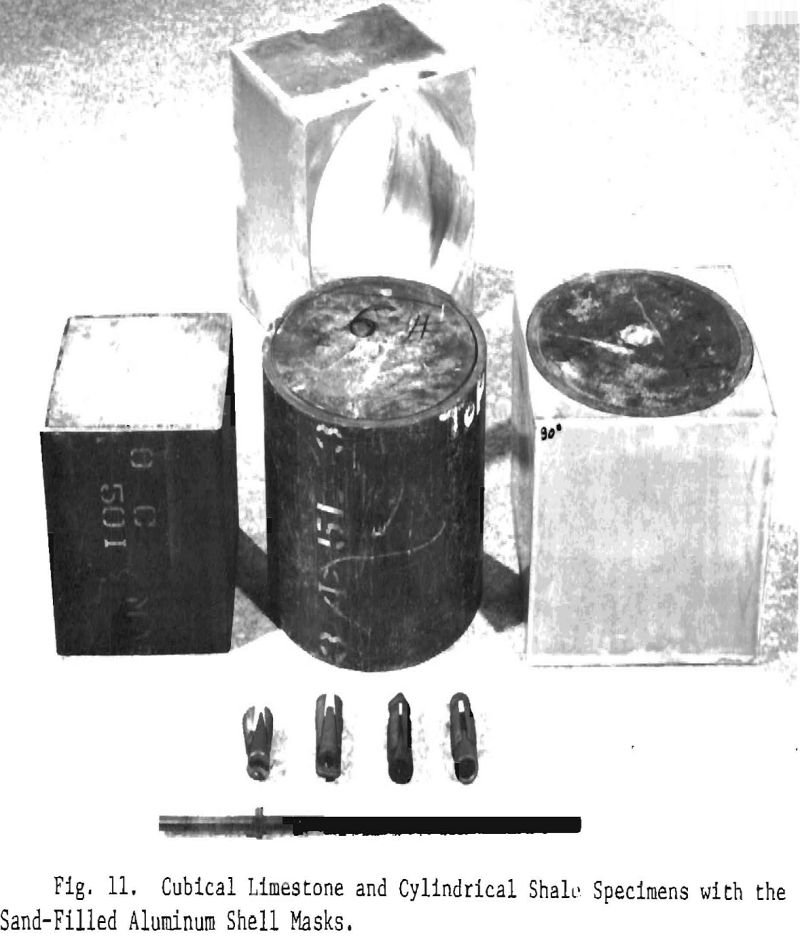
inner cylinder and the outer square shell was filled with dry sand. These masks were made to slip over the 12 ¾-in.-OD steel casing that surrounded the shale specimens and were 11 in. long to match the specimen length. Examination of the radiographs of one specimen with and without the mask showed that the mask, indeed, was necessary and satisfactory to produce a radiograph of uniform density that did not reflect the specimen thickness change.
The initial radiography of these specimens for a determination of their quality revealed a structure quite different from that of the limestone, as observed visually on the radiographs. Contrary to the rather homogeneous structure of the limestone, the shale contained numerous radial laminations ranging from less than 1/32 in. wide to as much as 3/16 in. wide, as measured from the radiographs. Thus, the shale appears to be a layered material. These laminations occur in various forms, such as broad feather-type bands with wavy patterns, wide single lines that fork into several narrower lines, and lines that vary in length from 1 or 2 in. to the full diameter of the specimen.
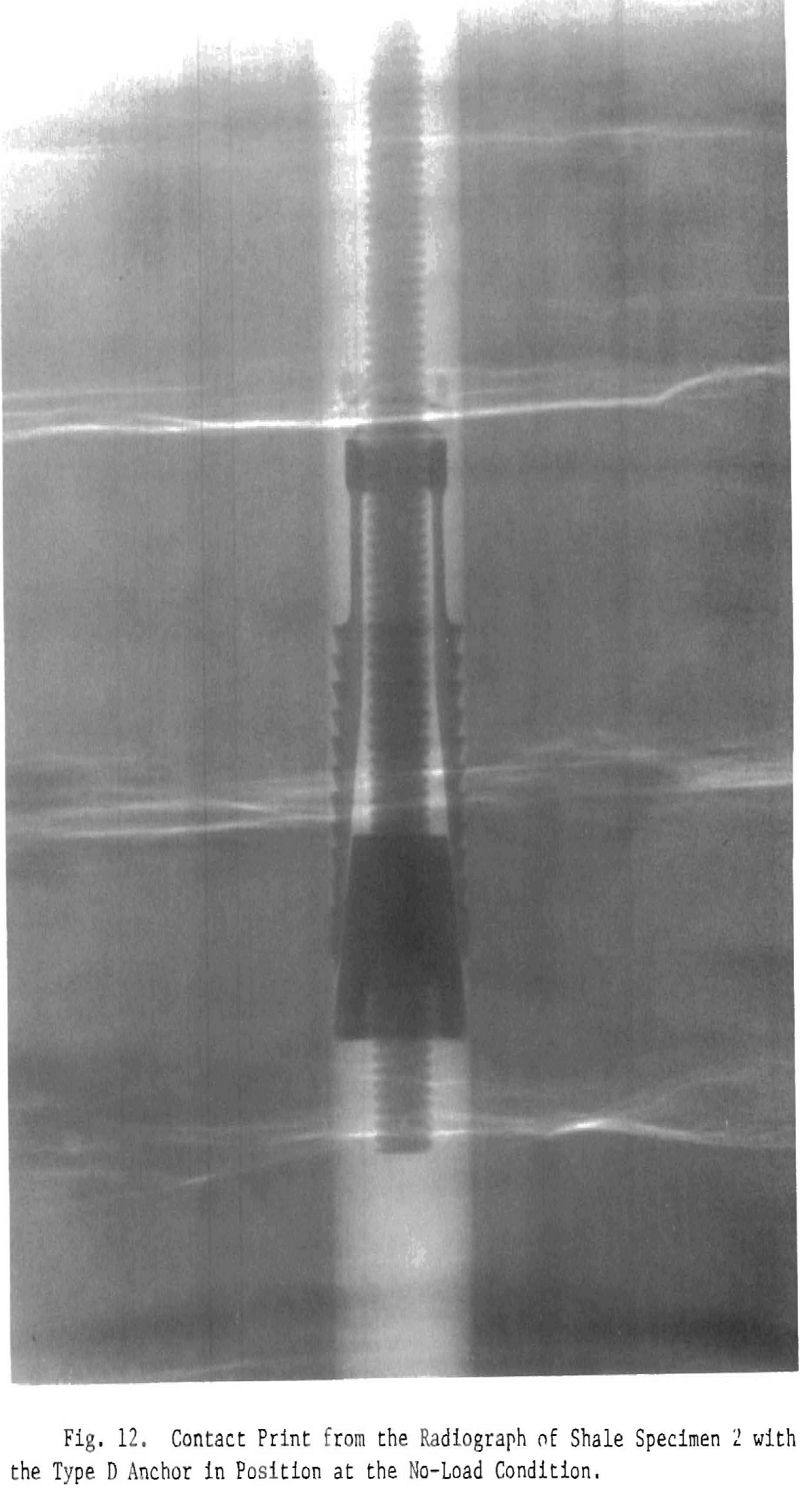
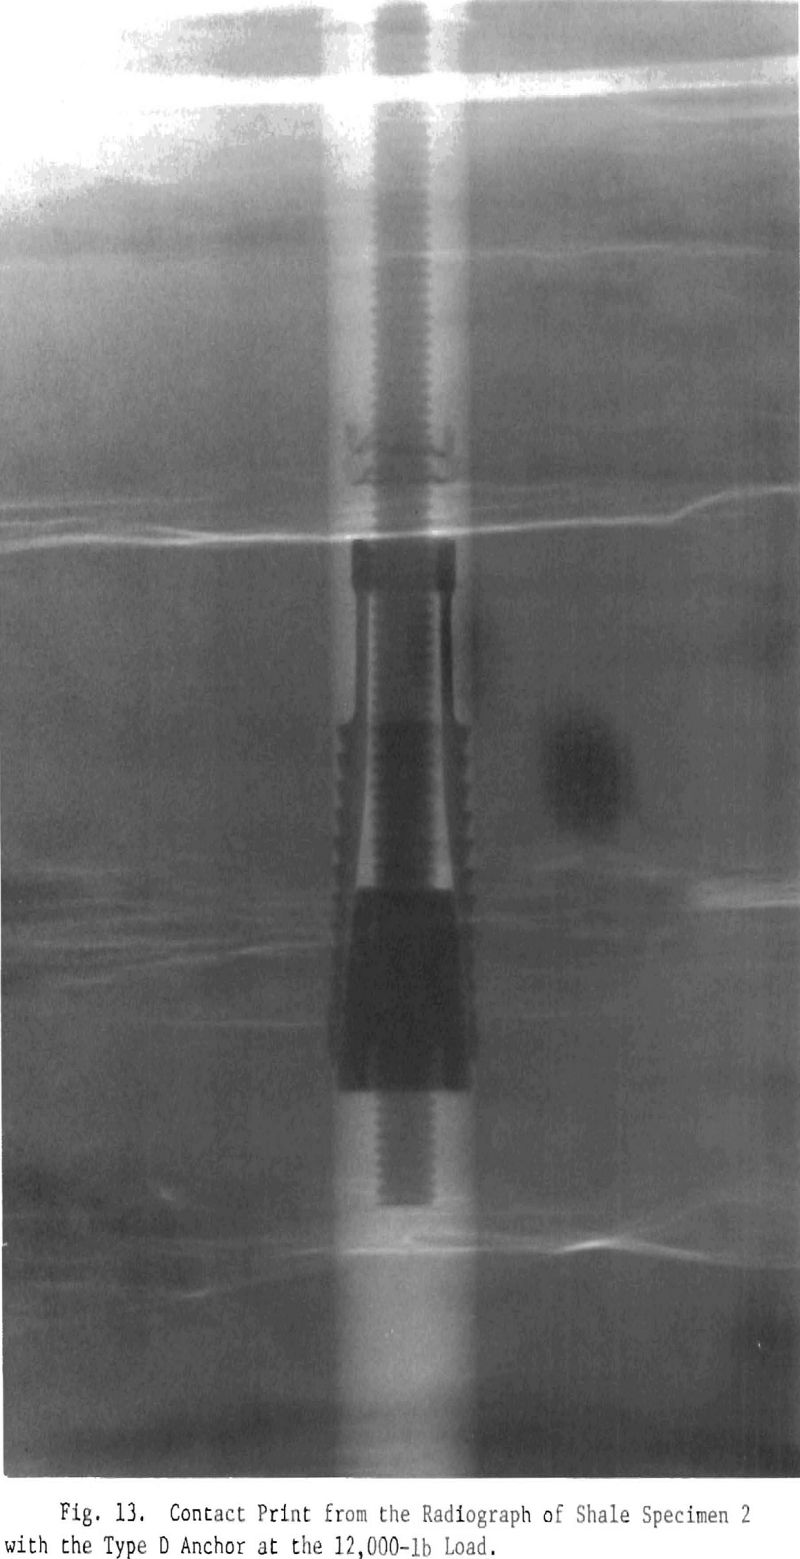
We chose two shale specimens — the ones with the smallest and with the fewest laminations — for the first stress tests, using the type A anchor with its leaves parallel to the x-ray beam. The stress schedule was 0-, 2000-, 4000-, 5000-, 6000-, 8000-, 10,000-, 12,000-, 14,000-, 15,000-, 16,000-, 18,000-, 20,000-, and 22,000-lb pull on the bolt, and radiographs were taken at each level of stress. As with the limestone, we placed another shale block between the specimen and the pressure plate, having, in effect, a 22-in.-long specimen with the bolt inserted to a depth of about 17 in. A visual examination of the radiographs revealed interesting changes in the laminations as the load was increased. Sometimes a narrow band of two or three thin laminations adjacent to the anchor leaves widened to as many as five laminations. At the same time, the laminations located less than 1 in. from the anchor between the anchor and the pressure plate were compressed into narrow lines or bands. Sometimes a band of several laminations appeared to compress into one single lamination. Laminations that ware an inch or more away from the anchor leaves were apparently unaffected by the load. The laminations started to stretch and compress when the load reached the 8000- to 10,000-lb level and continued through the 22,000-lb level. Figure 12 at no-load and Fig. 13 at 12,000-lb load show how the laminations adjacent to the anchor leaves were changed as the rock was stressed. The anchor in these figures is the type D with four leaves, and we did not see the change in the laminations located slightly beyond the ends of the anchor that we described for the type A with two leaves.
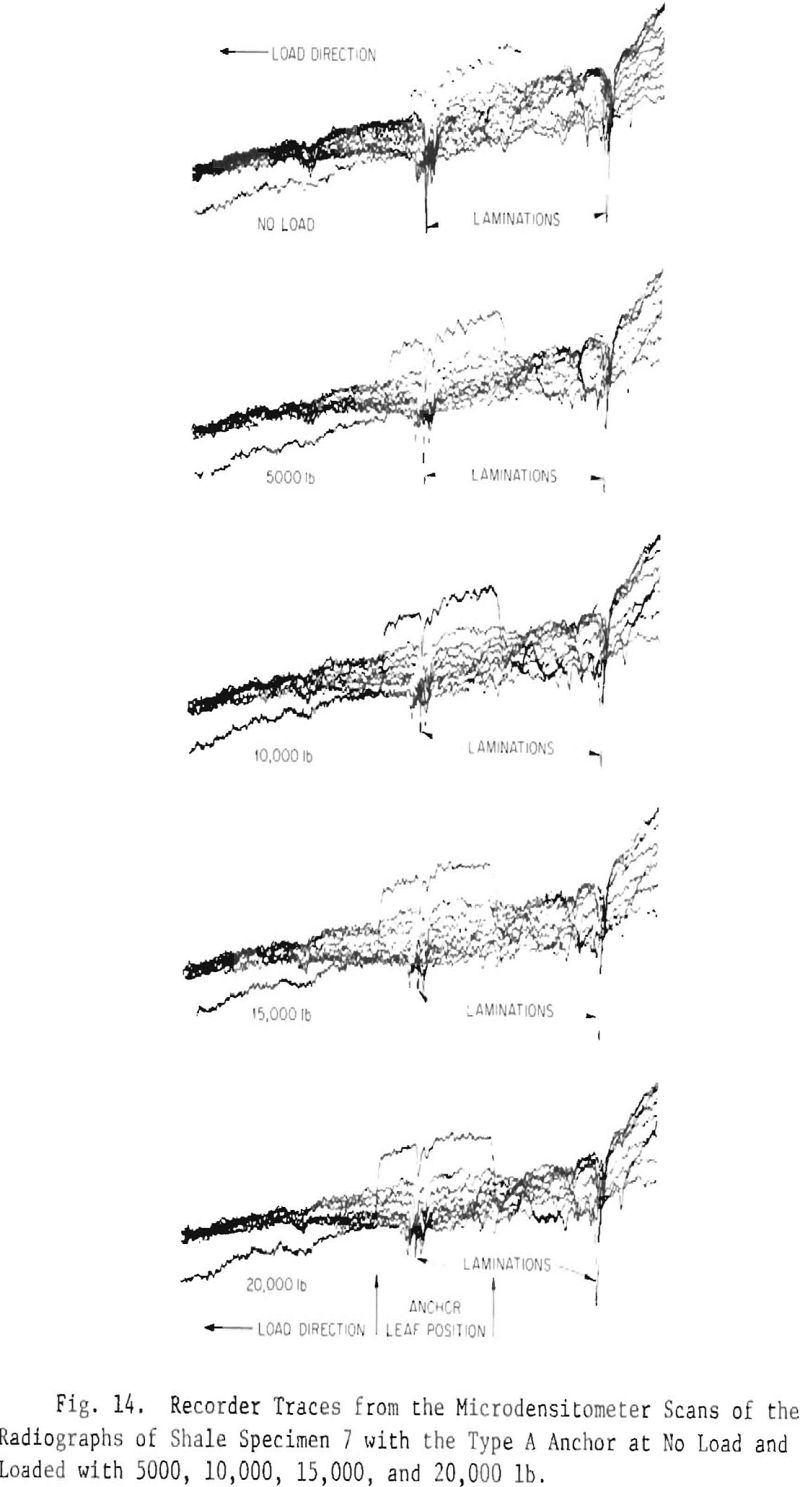
The radiographs of the two shale specimens that were stressed with the type A anchor were scanned on the single microdensitometer, and examples of these scans are shown in Fig. 14. The slope change that was observed with the limestone was not seen in these scans. The only detectable change was in the laminations, as found during the visual examination of the radiographs described above.
In another series of tests with the type A anchor, single initial loads of 4000, 8000, and 12,000 lb were applied to three separate specimens and held for one week; these loads were then advanced to 22,000 lb. Radiographs were made with the anchor leaves both parallel and perpendicular to the x-ray beam. Both the visual examination and the microdensitometer scans of the radiographs where the anchor leaves were parallel to the x-ray beam showed that the shale structure (relationship of laminations) changed very little from the no-load condition to the initial loads of 4000 and 8000 lb but markedly to the 12,000-lb level. However, specimens that were taken directly from the 4000- and 8000-lb initial loads to the 22,000-lb load, showed changes in the structure that did not occur when the load was advanced from 12,000 to 22,000 lb. We conclude that when a specimen is stressed to 22,000 lb, the major structural changes seem to occur between the 8000- and 12,000-lb load levels.
The microdensitometer scans of the radiographs made with the anchor leaves perpendicular to the x-ray beam showed only very slight structural changes from no load to 22,000 lb. This indicates that the major stress induced by the type A anchor is principally in a region adjacent to the anchor leaves.
Further tests were done with one each of the types B, C, and D anchor on a load schedule of 0, 4000, 8000, 12,000, 16,000, 20,000,
24,000, and 28,000 lb. Specimens with the types C and D four-leaved anchors were radiographed in two directions, 90° apart, with two opposite leaves parallel to the x-ray beam. Again we observed similar structural changes as with the type A anchor. From the real-time correlation scanning (using tandem microdensitometers) of all the radiographs, the spread in radiographic density from no load to the higher loads appeared greater for the anchors with four leaves than those with two leaves. Of course, the limited number of tests did not provide adequate statistics on which sound conclusions could be based.
None of the shale specimens cracked, even when the anchors were loaded to 28,000 lb. This behavior is markedly different from the limestone, which cracked in the 10,000- to 15,000-lb region. Several factors could be responsible for the differences in the performance of the two materials. The shale specimens were cylindrical and cased in ½-in.-thick steel, while the limestone specimens were cubical and cased in ¼ in.—thick steel. Thus, a greater degree of radial constraint was supplied by the casing to the shale specimens. Also, the shale specimens contained laminations, which demonstrated the ability to expand and contract as a function of applied load. This capability was not found in the limestone specimens.
Sandstone Specimens
This third type of rock of interest came from a quarry in Massillon, Ohio. These rocks were 10-in. cubical specimens cased in ¼-in.-thick steel. We intended to stress these specimens in 4000-lb increments to 20,000 lb. However, after the first specimen cracked as the pull was advanced to 12,000 lb, we modified the load schedule to 0, 4000, 8000, 10,000, 12,000, and 14,000 lb. Two each of these specimens were stressed with each of the four types of anchors, and one additional specimen was stressed with an initial pull of 8000 lb on the type C anchor, held at this load for one week, and then stressed further to 10,000, 12,000, and 14,000 lb. All nine specimens cracked. Eight cracked at loads between 8000 and 12,000 lb, and one specimen, stressed with the type C anchor, cracked as the load was increased from 4000 to 8000 lb. All radiographs were made with the leaves of the anchors parallel to the x-ray beam.
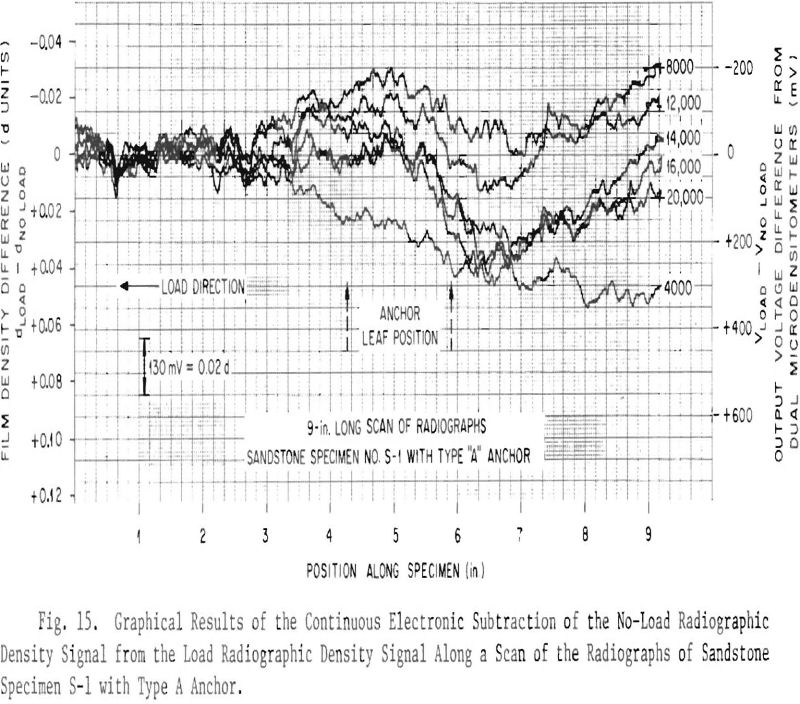
The tandem microdensitometric scans of the radiographs of the specimens loaded with the four types of anchors were similar to the scans of the original limestone, which showed an ordered change in radiographic density as a function of increased load until the break point was approached or reached. At that point, the direction of the ordered change reversed toward the no-load radiographic density. One example of these scans from Sandstone Specimen S-1 is shown in Fig. 15.
The scans of the radiographs of the specimen with an initial load of 8000 lb, held for one week, then advanced to 10,000, 12,000, and 14,000 lb showed that the largest change in radiographic density occurred between the initial 8000 lb and this same load one week later. The load had decreased to 6250 lb because of bleed-off during that time. This specimen cracked when the load was advanced from 6250 to 10,000 lb, and subsequent scans at 10,000, 12,000, and 14,000 lb indicated a trend of the radiographic density to return to that of the initial 8000 lb load.
Limestone Specimens Type “2”
These specimens were used principally for multiple identical tests with the types B, C, and D anchors for a check of radiographic reproducibility. These were also 10-in. cubes cased in ¼-in.-thick steel. The nine specimens were divided as follows: one stressed with type A, two stressed with type B, and three each stressed with types C and D anchors. Again we used the 0-, 4000-, 8000-, 10,000-, 12,000-, and 14,000-lb load schedule with the anchor leaves parallel to the x-ray beam. Just as observed with the sandstone, all specimens cracked at loads between 8000 and 12,000 lb. Also, the tandem microdensitometric scans of the radiographs showed an ordered change in radiographic density as a function of the load changes similar to that for the type 1 limestone and the sandstone.
Effects of Usually Insignificant Cassette Variables
Because the changes in radiographic density between a no-load radiograph and a load radiograph are minute, all variables affecting the
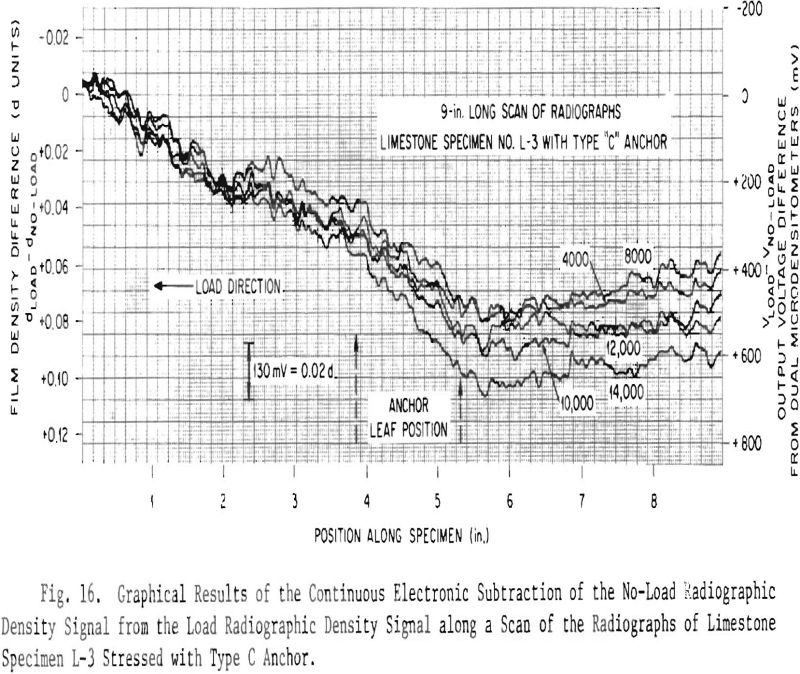
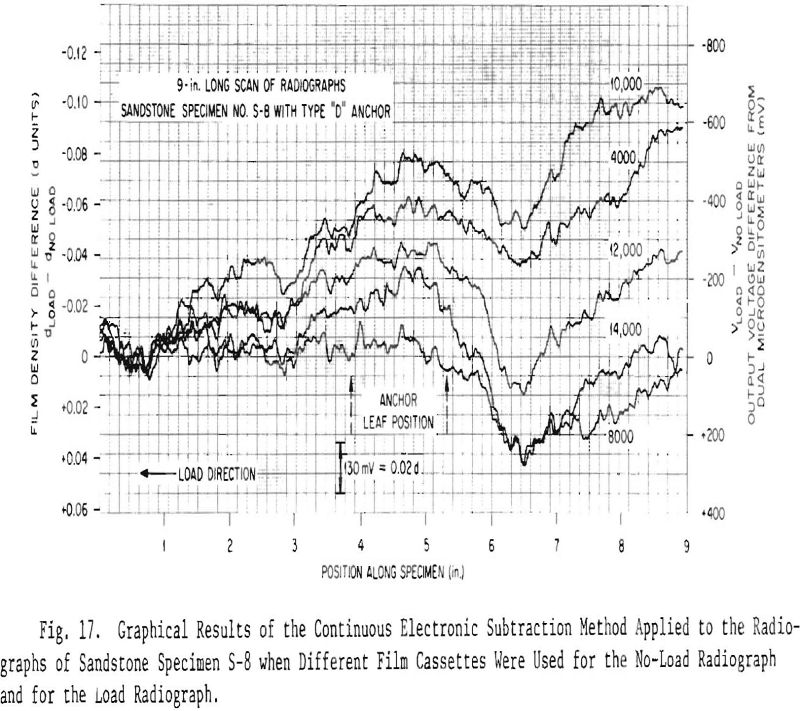
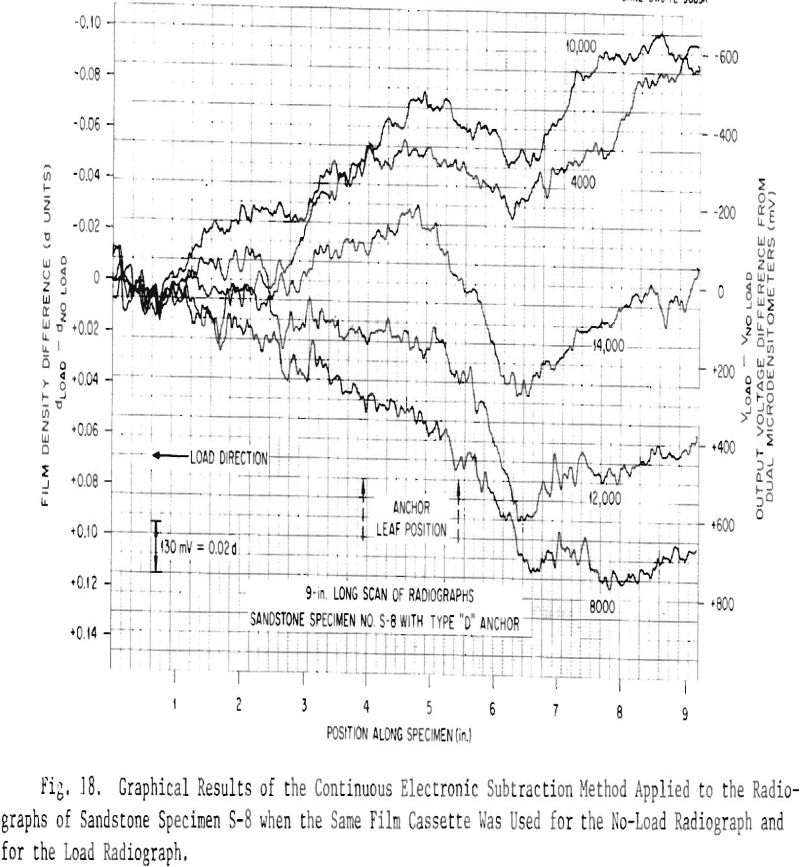
radiographs must be minimized or eliminated for this method to be a usable analytical tool. When we made the radiographs, we used two film cassettes and alternated them as the load was advanced from one level to the next — for example, cassette 1 at no load, cassette 2 at 4000 lb, cassette 1 at 8000 lb, cassette 2 at 10,000 lb, etc. Also no attention was initially paid to the end-to-end orientation of the cassettes. When the tandem microdensitometric scans of the radiographs of one of the three limestone type 2 specimens (No. L-3) stressed with the type C anchor fell in a rather narrow band and were generally parallel (see Fig. 16), we were prompted to consider the effects of variations in the components, namely, the lead screens. Under normal circumstances “identical” cassettes produce identical results. However, it was becoming apparent for the level of sensitivity being attained that normally insignificant variables must be controlled. Instead of trying to measure the absolute variations in the lead screens, that is, point for point over a given geometric area in the two cassettes, we devised a simpler test where four radiographs were made of one of the sandstone specimens at the no-load condition, one each using the two cassettes with their marked ends at the top of the specimen, then the marked ends rotated 180° to be at the bottom of the specimen. These no-load radiographs were subtracted from the load radio¬graphs on the tandem microdensitometers both by ignoring a match of the no-load cassette with any specific load cassette and then by matching the no-load cassette with the load cassette. As seen in Fig. 17 when the no-load and load cassettes were unmatched, the spread of radiographic density is considerably less than when they were matched, as shown in Fig. 18. At present, we believe that the minor variation or scatter in radiographic density within a particular test group (not the major trend of density change with stress) was caused by the nonuniformity of the film cassette components. Unfortunately, this was learned after most of the tests were done on the type 2 limestone and the sandstone. In future teats, however, no-load radiographs were made with each of the cassettes precisely positioned to provide an exact match with the radiographs made of the stressed specimens.
Summary of Preliminary Work
High-voltage radiography was performed on both unstressed and stressed specimens of limestone, shale, and sandstone. Stress was induced by one of four selected expansion anchors supplied by the Bureau of Mines. Our efforts were directed toward (1) optimizing the techniques for producing the radiographs, (2) developing calibration and standardization procedures for controlling the radiography, (3) determining the reproducibility of radiographs; and identifying variables that affect the ability to duplicate results, and (4) making quantitative measurements with microdensitumetry on radiographs of stressed and unstressed rock specimens.
We were able to improve the image detail in the radiographs of the anchors interacting with the specimens and of the changes occurring in the rock specimens as a function of applied stress. A unique microdensitometric scanning and data processing system using correlation techniques was developed and applied. The system allows subtle variations that were previously unobservable to be extracted from the background and recorded.
The type 1 limestone specimens cracked at loads between 10,000 and 15,000 lb. The tandem microdensitometric scans of the radiographs showed an ordered change in radiographic density as a function of the load change. Similar observations were made with the limestone type 2 and sandstone specimens, except that they cracked at loads between 8000 and 12,000 lb.
The radiographs of the shale specimens revealed a structure quite different from the homogeneous limestone and sandstone. The shale contained many radial laminations indicating a layered appearance. None of the shale specimens cracked, even when the bolts were loaded up to 28,000 lb. Because the shale (specimens were cylindrical and cased in ½-in.-thick steel (the limestone and sandstone were cubical and cased in ¼-in.-thick steel) they may be more representative of an infinite rock layer thus able to withstand higher loads. Also, the energy input to the rock specimen through the tensioning of the expansion anchors could have been dissipated by the expansion and contraction of the laminations.
Introduction to Advanced Studies
The progress reported above advanced this study to a point where two separate though related tasks were conducted to best satisfy the objectives of the Bureau of Mines. The first task was the completion of the development and utilization of the radiographic technique to examine qualitatively several expansion anchor-rock specimen combinations of interest to rock-mechanics researchers.
This objective was fulfilled by producing a standard set of high-quality radiographs covering the range of combinations of eight representative expansion anchors in two rock types (limestone and sandstone) of two different diameters (8 and 12 in.) at load levels from 0 to 20,000 lb In increments of 4000 lb. Radiographs were taken of each of the above combinations for as many as three orientations of the expansion anchor relative to the x-ray beam.
The necessity for the second task became obvious while we performed the preliminary work. As mentioned previously, there appears to be a relationship between the internal stress state of a rock specimen and the film density resulting when that specimen is radiographed. The objective of the second task was to investigate this apparent relationship further. The ultimate goal was to define mathematically this relationship so that the internal stress state of a rock specimen can be determined, at least in part, from density variations in the appropriate radiographs. This task involved the comparison of radiographic density tracings with geometrically corresponding stress variations for simple rock specimens. These stress variations were determined theoretically for the geometries being used.
Also, during this task, we improved the microdensitometrie scanning techniques for better data extraction and interpretation.
Production of Multiple Sets of Standard Radiocraphs
Specimens and Equipment
Rock Specimens
This phase of the program required 96 specimens of rock encased with epoxy in steel casings to accomplish the production of triplicate sets of radiographs of eight different anchors in the 8- and 12-in.- diam cylinders of limestone and sandstone. All specimens were prepared and supplied by the Bureau of Mines. Typical 8- and 12-in. diam specimens are shown in Fig. 19. Behind each specimen are the sand-filled
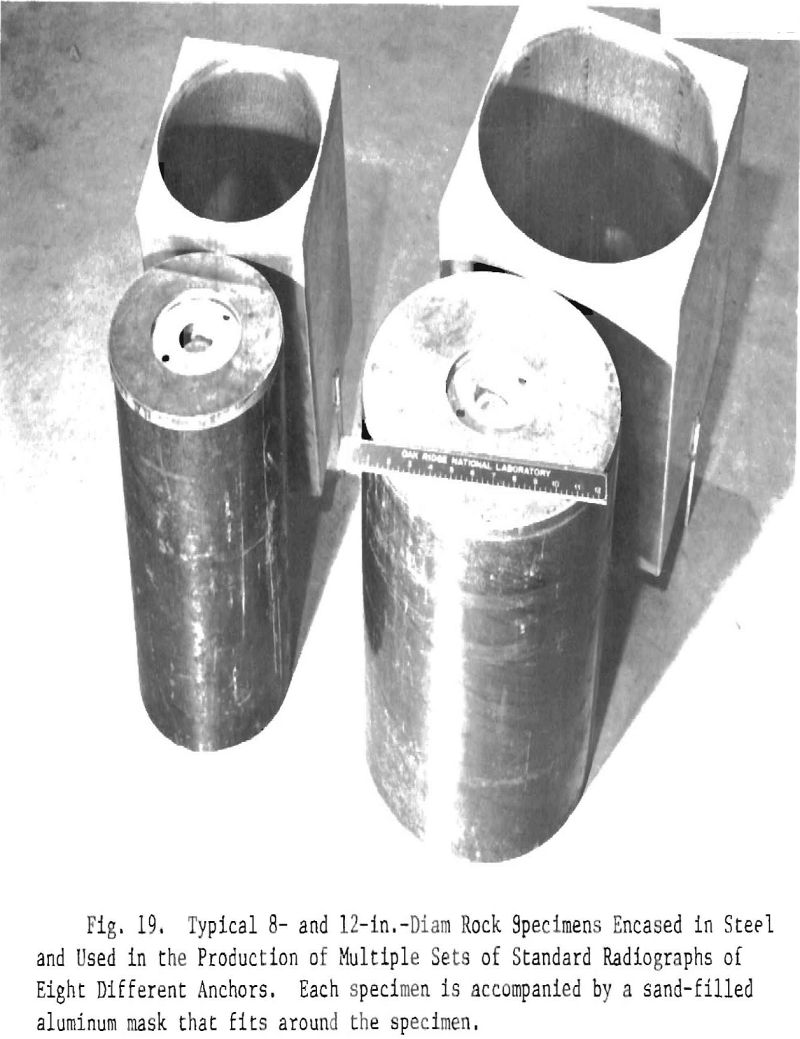
aluminum masks that fit around the specimens. These masks were needed to counteract the thickness change of the cylindrical shape and achieve a radiograph with a reasonably uniform density. The 8-in.-diam specimens were encased with 8-in. sched-40 steel pipe (0.322-in. wall); the 12-in.-diam specimens were encased with 12-in. sched-30 steel pipe (0.330-in. wall). All specimens had a 1 3/8-in. diam coaxial through hole for insertion of the anchor-bolt assembly. Each specimen was fitted with a 1-in.-thick pressure plate. The rock cylinders were 13 in. long while the steel casings were 14 in. long, allowing a ½-in. project ion on each end. The pressure plate (same outer diameter as the pipe) had a shoulder machined to allow half the thickness (½ in.) to be inserted into the inside of the casing.
Anchor Specimens
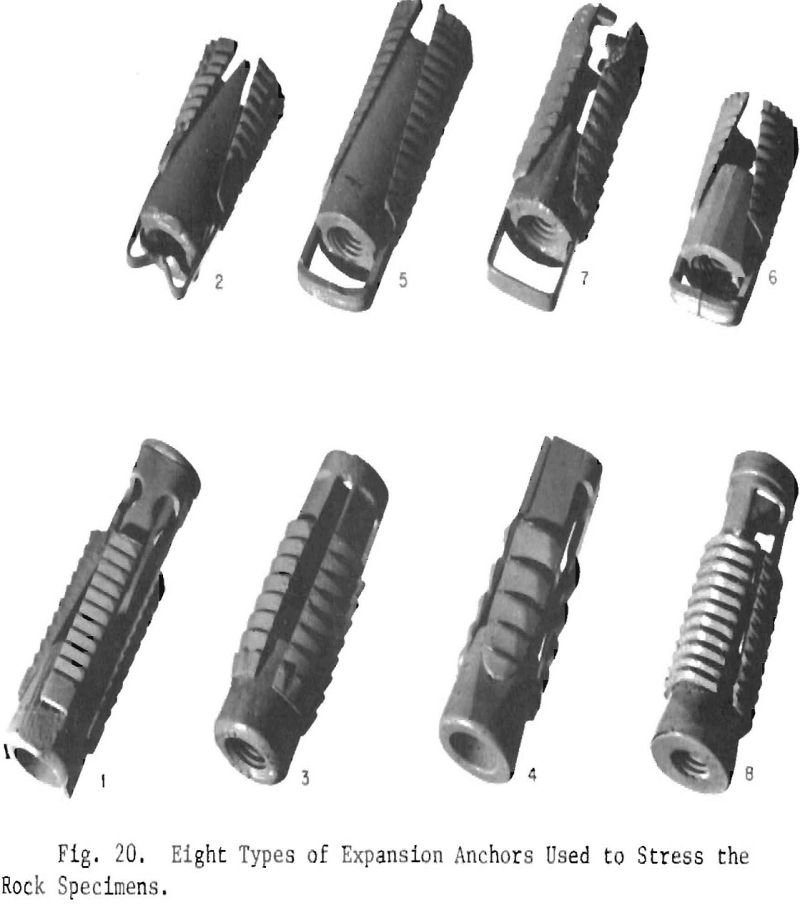
The eight expansion anchors that were used are shown in Fig. 20 and are identified as 1 through 8. Those in the top row (2, 5, 6, and 7) have two leaves, while in the bottom row, 1, 3, and 4 have four leaves and 8 has three leaves. Anchors 5, 6, and 7 do not have teeth that are continuous around the full width of each leaf.
Equipment
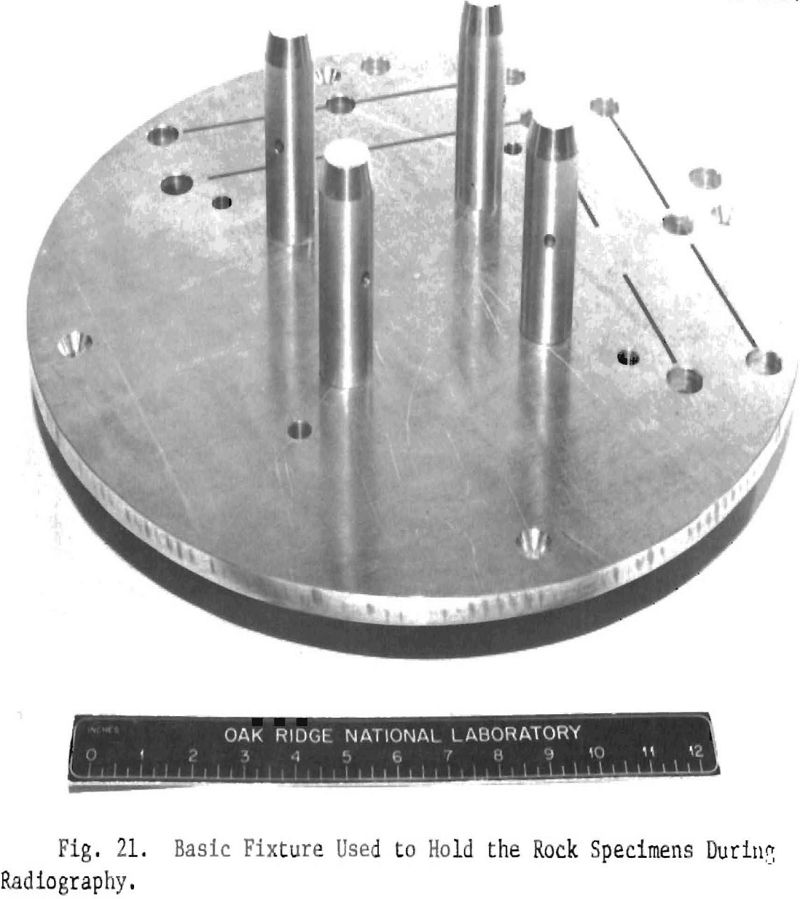
Because the specimens were to be radiographed at various angular positions, we designed and fabricated a fixture that was bolted to a rotating table to hold and manipulate the specimens and film cassette. Figure 21 shows the basic specimen-holding fixture. The four support posts are in position for an 8-in.-diam specimen. When a 12-in.-diam specimen was held, the four posts were moved to the outer threaded holes. The larger unthreaded holes (shown with connecting lines) around the outside of the plate allow positioning of the cassette holder for proper orientation with the x-ray beam. The inner set of holes is used for the 8-in.-diam specimens and the outer set for the 12-in.-diam specimens.
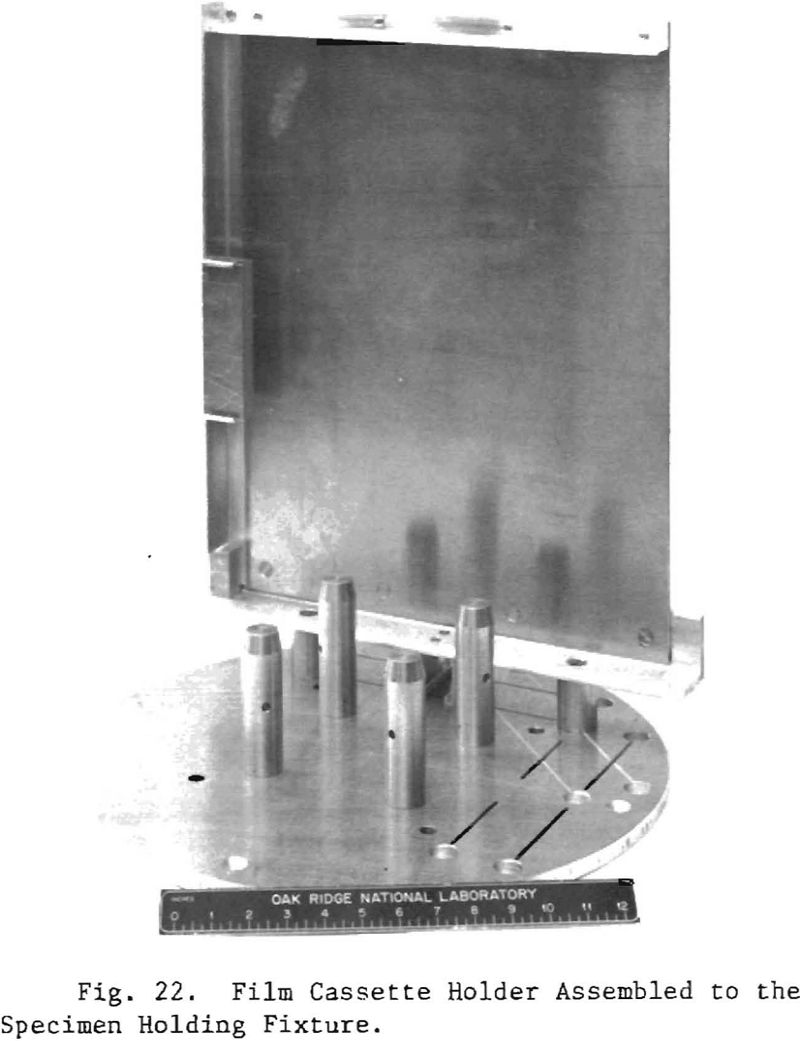
Figure 22 shows the cassette holder assembled on the specimen-holding fixture with all components positioned to accommodate an 8-in.-diam specimen. Figure 23 shows the completed assembly of all components
prior to radiographing a 12-in.-diam specimen. Each time the specimen was rotated to a different angular position, the cassette holder was removed. Then for proper orientation with the x-ray beam, the sand-filled mask was rotated around the specimen and the cassette holder was relocated to a different set of positioning holes.
Specimen Radiography
Anchor Positioning
After a specimen was placed on the support table, the expansion anchor was attached to the threaded rod and placed in the hole of the specimen. The anchor was aligned visually with the center of the head of the x-ray machine for the specified 0° position. Then the anchor and threaded rod were assembled to the Strainsert bolt and hydraulic ram.
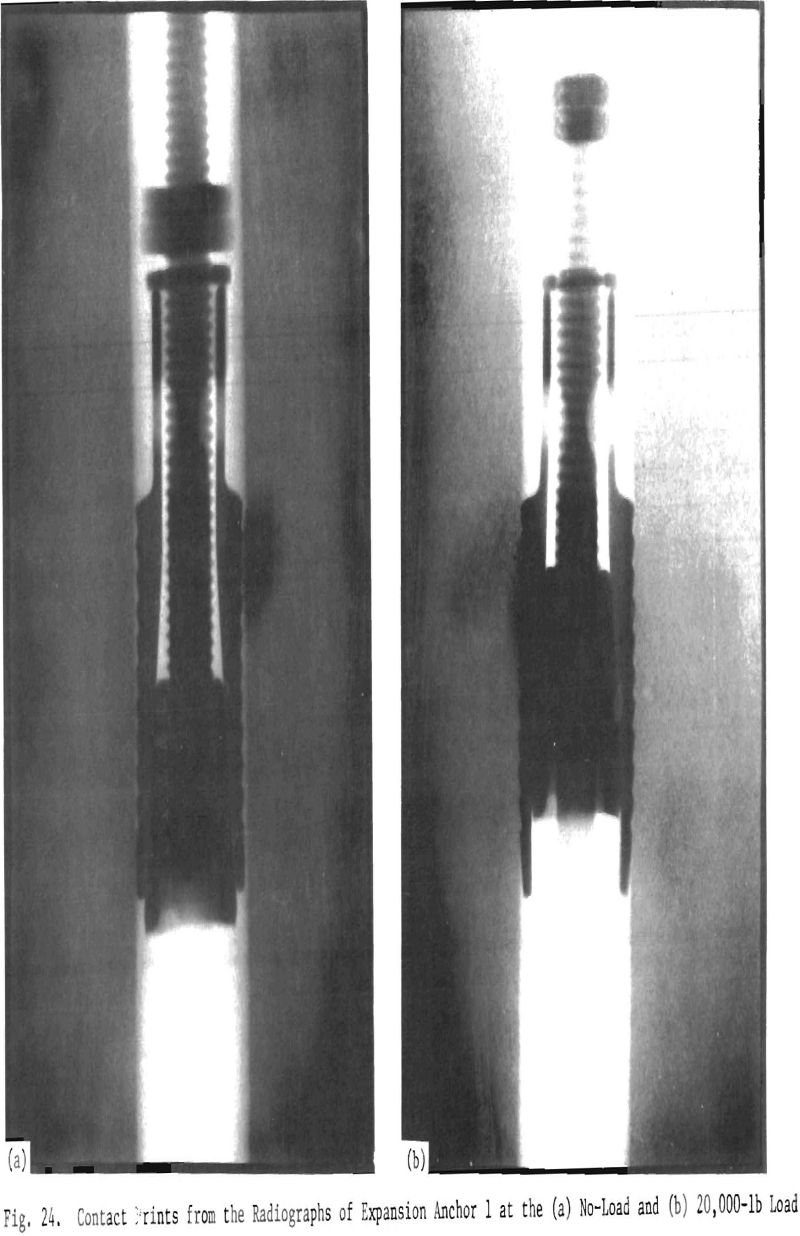
The 0° orientation for the 1, 2, 3, and 4 anchors was such that the profile of the teeth in opposite sets of leaves was to be fully seen in the radiographs. In addition to the 0° orientation, these anchors were radiographed at 90°. Anchors 1, 3, and 4 positioned at 90° produced the same profile as at 0°, but from the other set of leaves. When anchor 2 was rotated 90°, no teeth showed in profile, since this anchor had only one plane of symmetry.
Anchors 5, 6, and 7 were radiographed at the three orientations, 0, 45, and 315°. The anchors were set with the bale perpendicular to the axis of the x-ray beam for the 0° orientation, and only a profile of the corner tips of the teeth was shown. The 45 and 315° orientations produced profiles of the full depth of the teeth on opposite sides of the anchor shell.

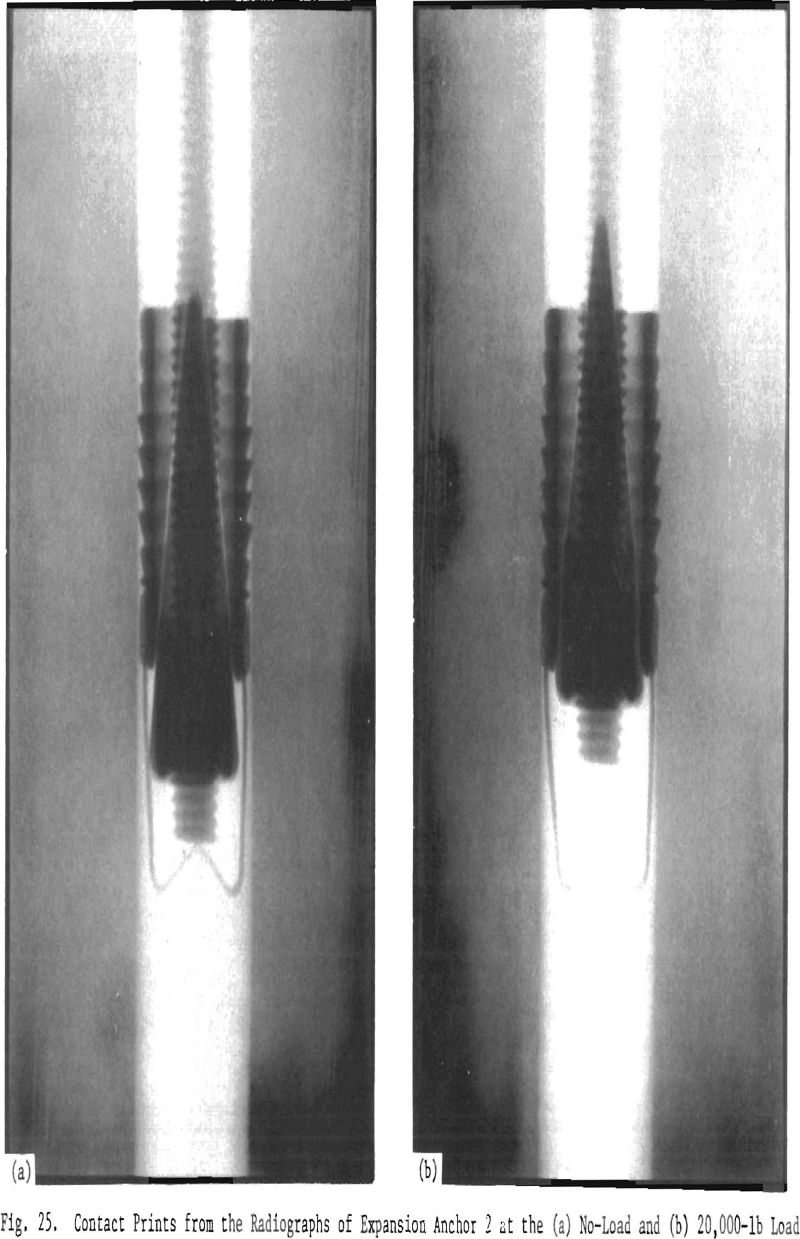
Anchor 8 was also radiographed at three orientations, but at 0, 120, and 240°. Thus, at each position, a profile of the full depth of the teeth of one leaf was shown.
Alignment of the anchors was always checked on the first no-load radiograph at the 0° position before applying load to the anchor. Occasionally, minor positional adjustments were made by turning the specimen on the support posts. After such adjustments, the specimen was radiographed again at the 0° position.
Radiographic Parameters
A 2-MeV x-ray machine operating at 1.5mA with a 0.4-mm focal spot at 100 in. from the film cassette was used to radiograph all the specimens. The 14 x 17 in. cassette contained the following sequential arrangement of film and lead screens: 0.020 in. Pb, 0.005 in. Pb, film, 0.005 in. Pb, 0.005 in. Pb, film, 0.005 in. Pb, and 0.020 in. Pb. A 1/8-in.-thick plate of uranium was placed behind the cassette to minimize effects from backscattered radiation. We used Eastman Kodak type M film for the radiographs of the 8-in.-diam specimens and type M film for the 12-in.-diam specimens (both limestone and sandstone). An exposure of about 2.5 min produced radiographs with a film density of about 2.4 density unit in the image of the rock for both sizes of specimen. The film was processed in an automatic processor.
Anchor Behavior
Contact Prints from Radiographs of Anchors
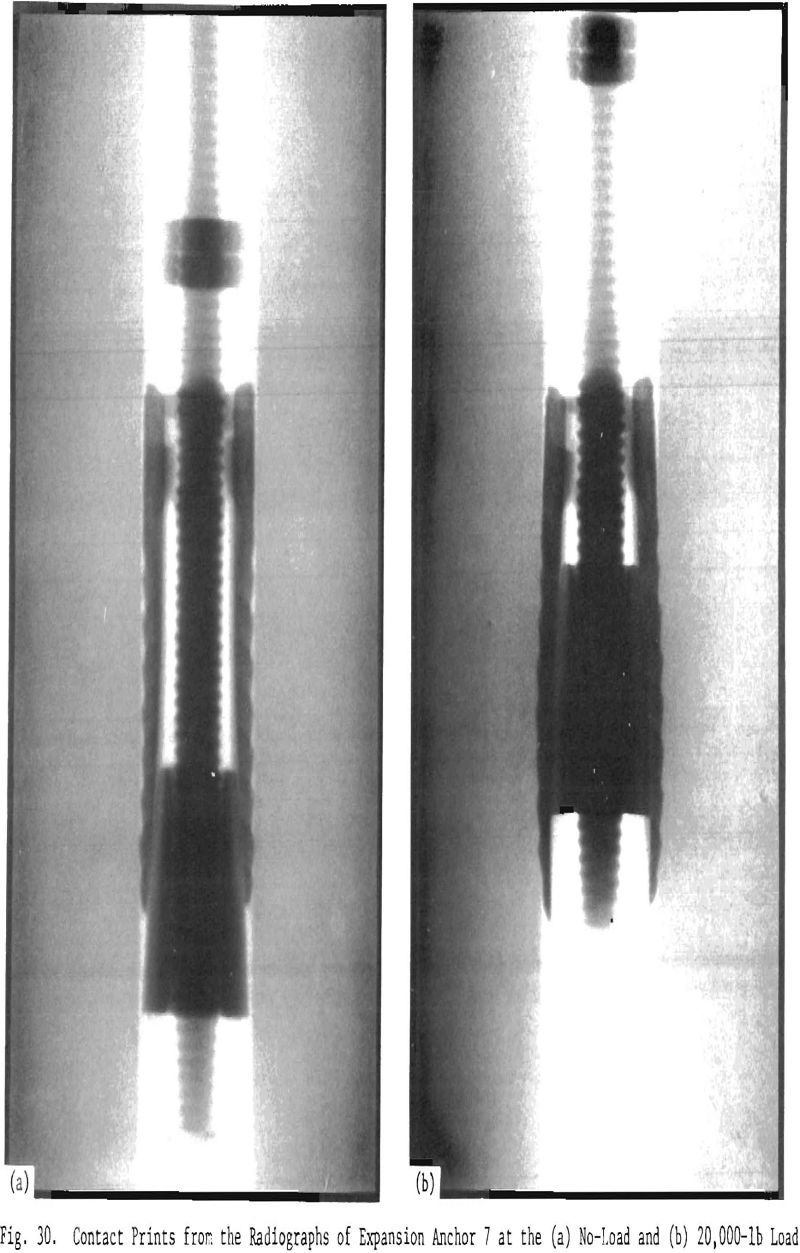
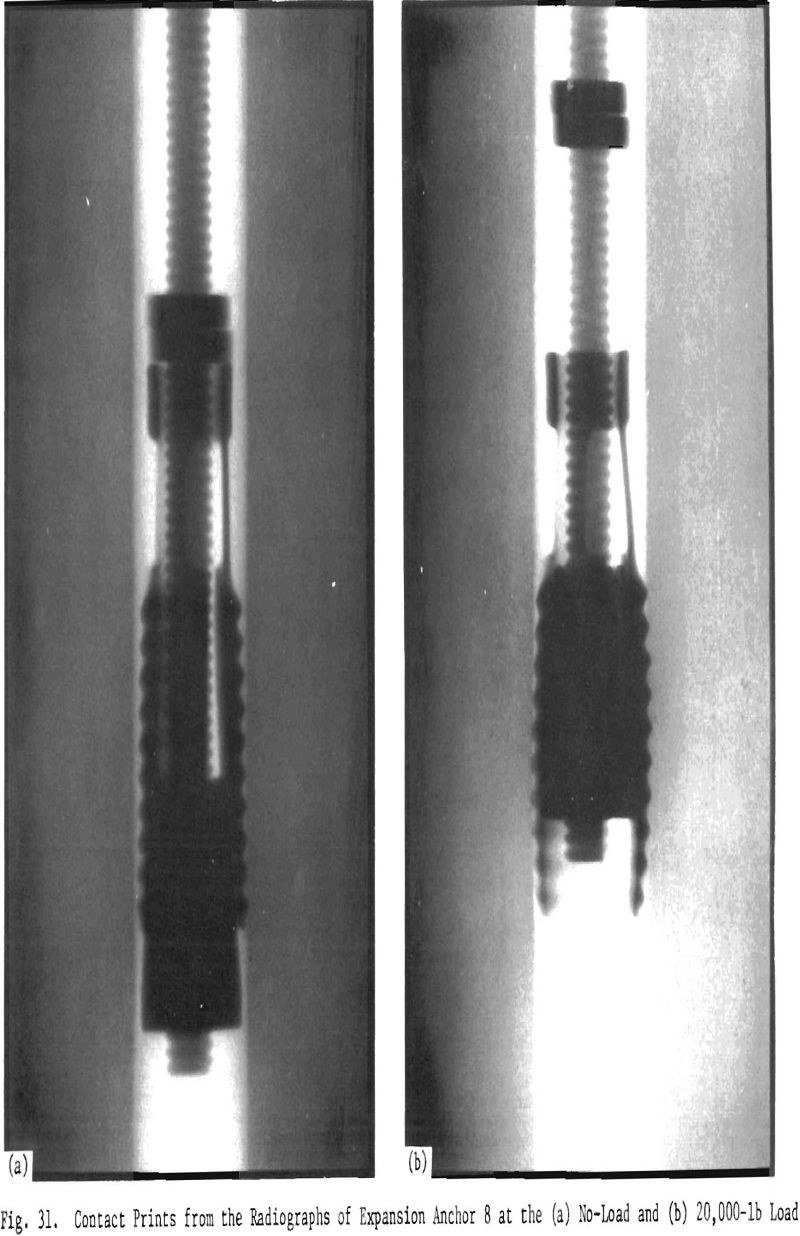
Examples of the typical behavior of the eight anchors in rock are shown in Figs. 24 through 31. Each figure shows a comparison of the appearance of the anchor at no-load and the appearance at the 20,000-lb load. Only one example of each anchor is shown.
Summary of Specimens Tested and Anchor Behavior
Table 1 contains a summary of the number of each type of rock specimen that was tested with a tabulation of the behavior of the eight types of anchors. We did not accomplish the desired triplicate tests
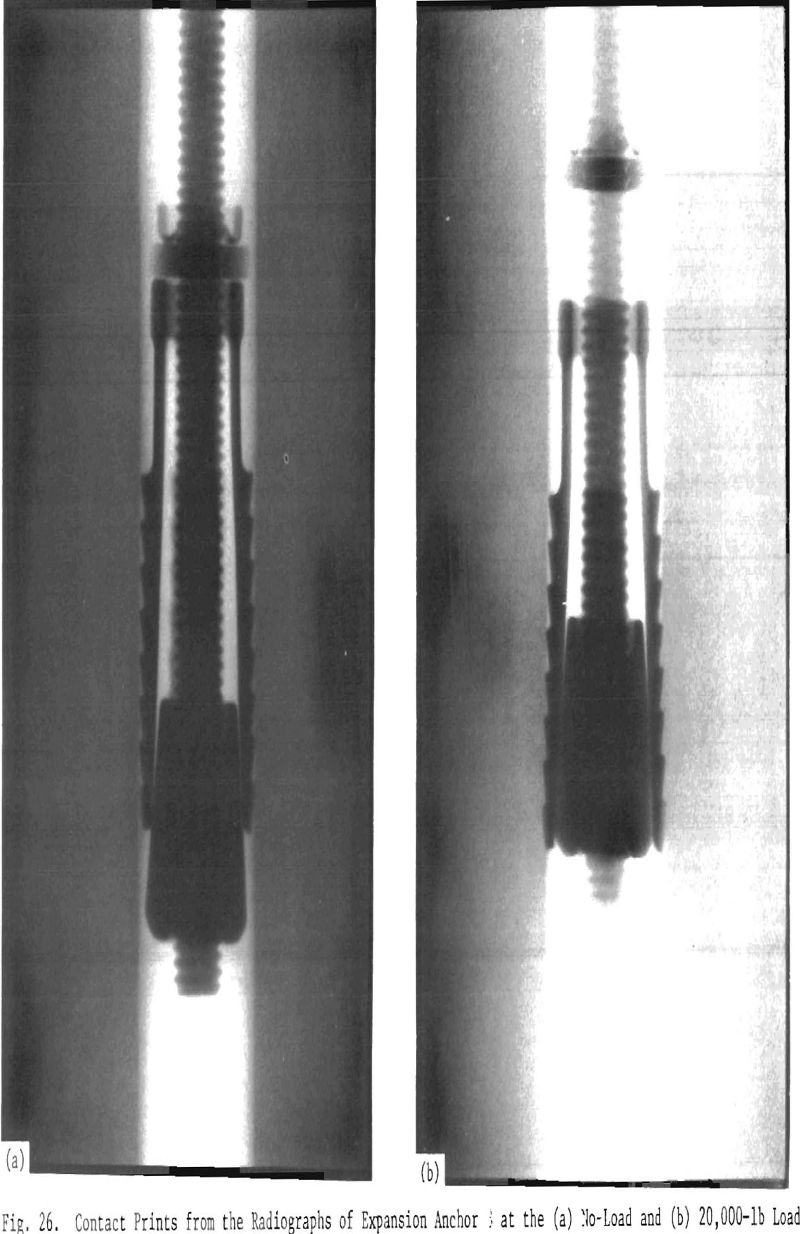
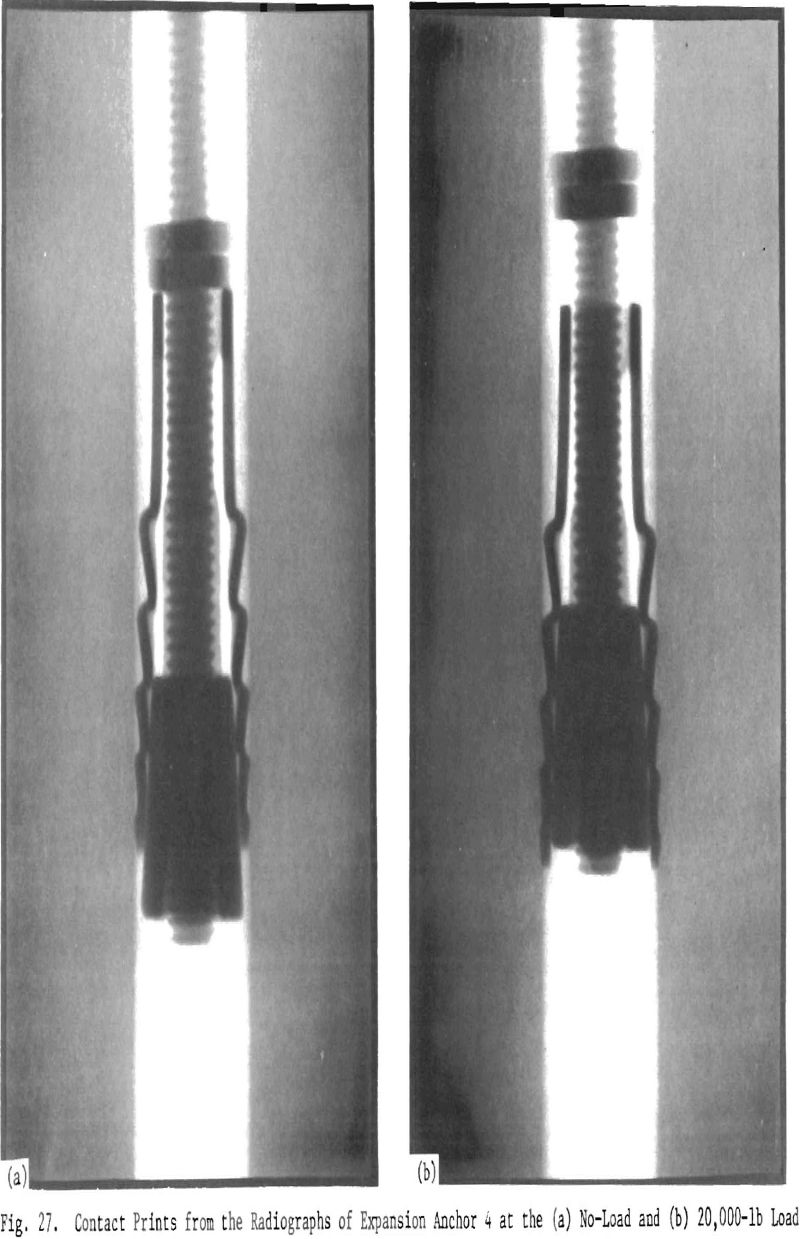
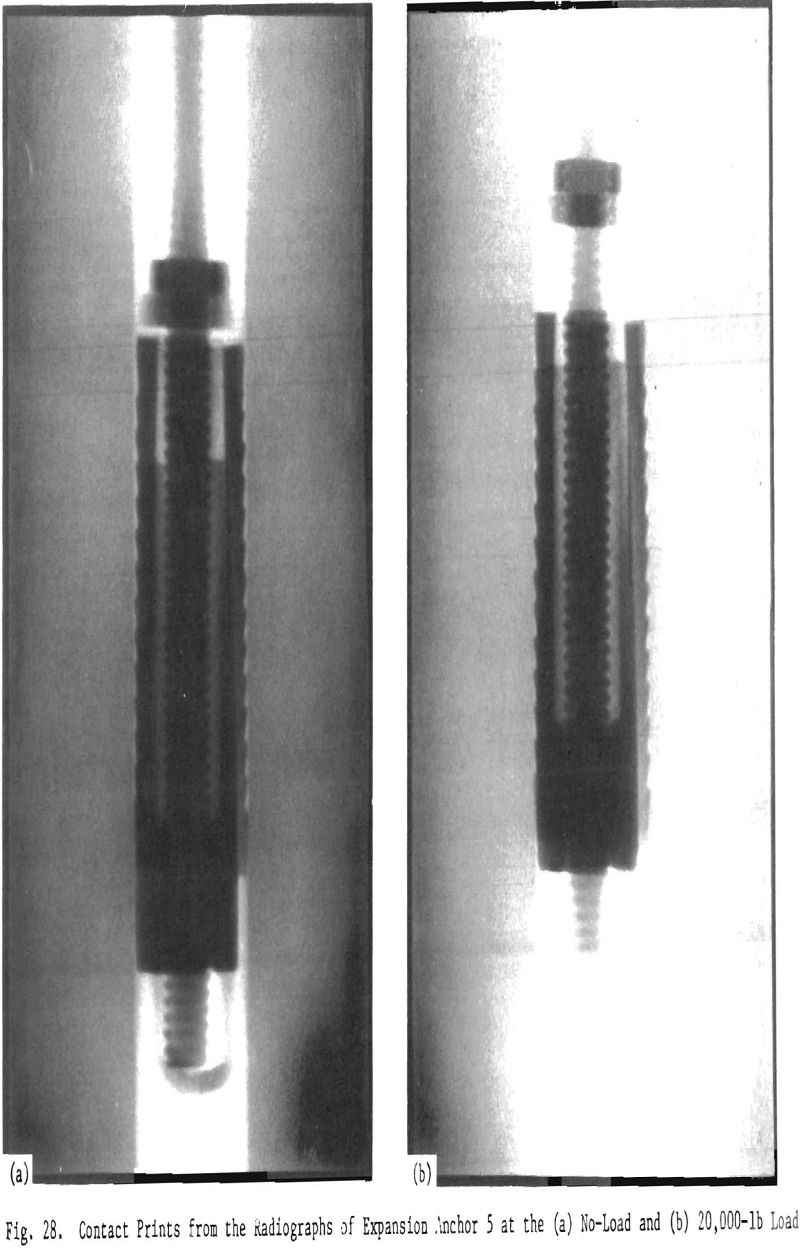
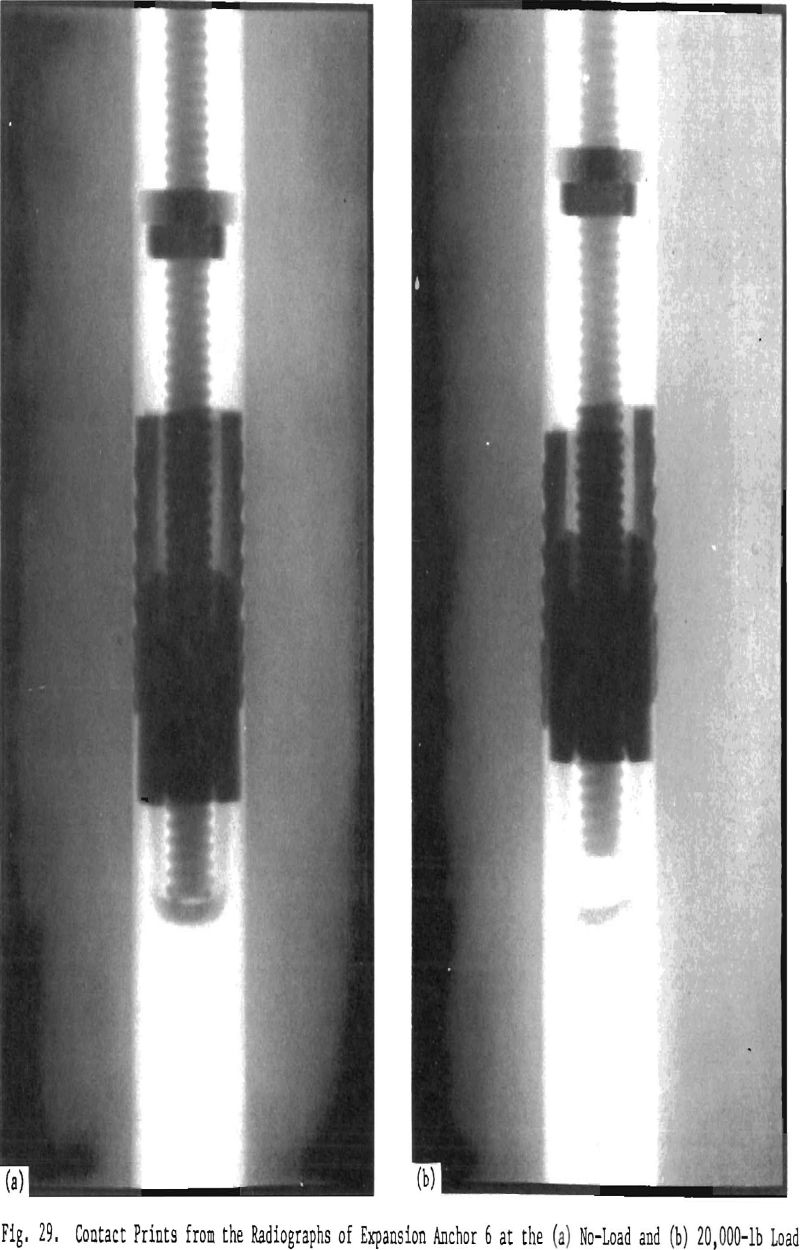

of all the anchors in all of the specimen types and sizes, because some of the specimens were not available.
The term, “excessive load bleed-off,” is used to describe the condition where the loading of an anchor would not stabilize at the desired level. In addition to the lack of a stable load, some of the anchor-rod combinations could not be stressed to the 20,000-lb level. Those that exhibited this characteristic were: anchor 1 in a 12-in.-diam limestone specimen peaked at 12,000 lb; anchor 4 in an 8-in.-diam limestone peaked at 18,000 lb; and anchor 7 peaked at 19,000 lb in an 8-in.-diam limestone and 14,000 lb in an 8-in.-diam sandstone.
Experimental and Theoretical Studies to Define the Relationship of Stress to Radiographic Change
As mentioned previously, there appears to be a relationship between the internal stress state of a rock specimen and the film density resulting when that specimen is radiographed. The objective of this phase of the program was to investigate the apparent relationship by comparing radiographic density tracings with geometrically corresponding stress variations for simple beam-shaped rock specimens.
The stress variations for the configurations used were determined theoretically by a system of finite element analysis and comparisons made with the radiographic density tracings.
Experimental Studies
Specimens and Equipment
The initial rock specimens chosen for this work were 2 x 2 x 15 in. limestone beams and were stressed in both compression and tension in a four-point bending fixture. These specimens were cut from the quarry with the naturally occurring layers parallel to the long axis of the specimen. Also, we used two 2 x 2 x 7 3/8 in. limestone specimens for pure compressive loading. One of these specimens had the layers parallel to its long axis, and the other had the layers perpendicular to its long axis.
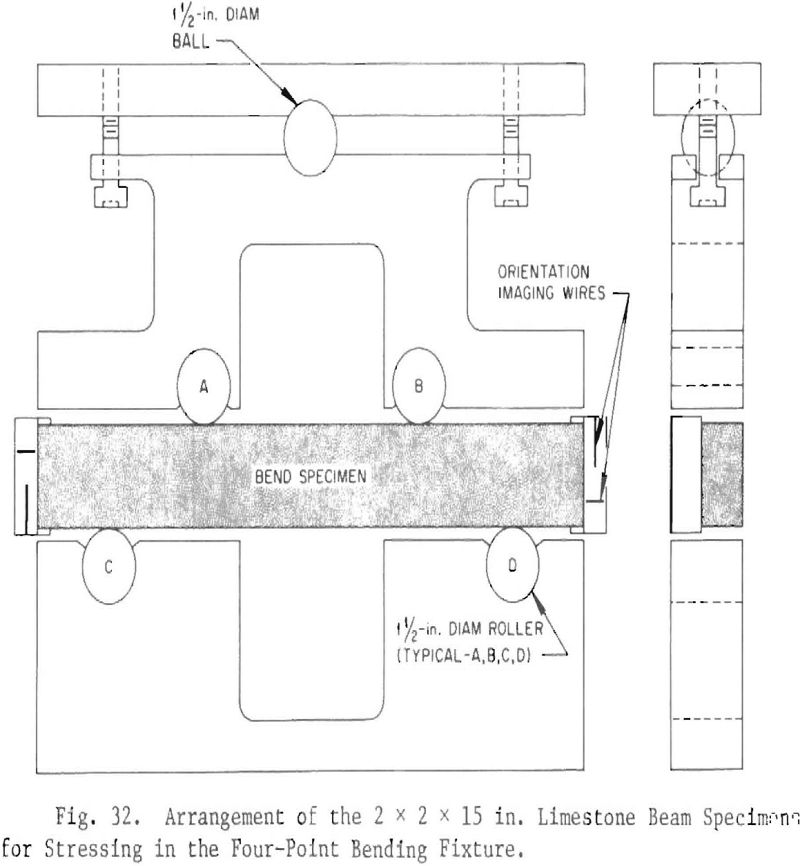
A sketch of the four-point bending fixture, fabricated from 2-in.-thick steel is shown in Fig. 32. The center-line distance between rollers A and B was 6 in.; and between rollers C and D was 11 in. Clamped to each end of the specimen are the assemblies that hold 0.010-in.-diam tungsten wires that provide alignment images on the radiographs. The details of these assemblies and their use will be described later.
The fixture was placed in a hydraulic press with its geometric center line coincident with the center line of the press. The assembly of the bend fixture to the hydraulic press with a limestone beam in position is shown in Fig. 33. Also shown is the rigid 4 ½ x 17 in. cassette placed on its holder behind the bend fixture. Behind the cassette and fixed to the cassette holder is a ¼-in.-thick lead plate (not shown in photo) to minimize effects from backscattered radiation; and, at the left side of the holder, there is a “stop” to ensure reproducibility of cassette positioning for sequential exposures.
We placed a 0.200-in.-thick by 4-in.-long section of steel In the cutaway portion of the base of the bend fixture beneath the center section of the limestone beam. The x-ray image from the steel, separate from the image of the rock specimen and unaffected by the applied load, had a film density equivalent to the average film density of the rock
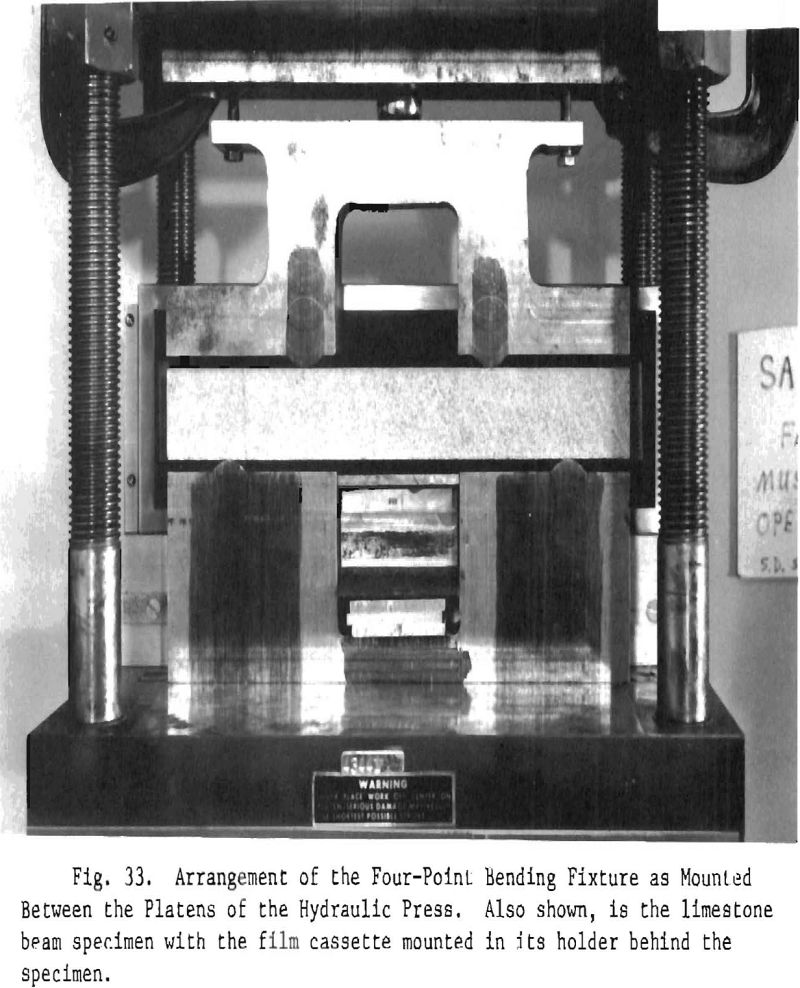
image. The image from the steel, was used to normalize the minor variations In the film densities (from exposure and processing variables) of the radiographs during the subtraction scanning with the tandem microdensitometers. A detailed description of the use of the image from the steel will be given in the later section of this report, “Scanning the Radiographs with the Tandem Microdensitometers.”
Figure 34 shows the arrangement of the 2x2x7 3/8 in. limestone post specimen and the fixture used to apply pure compressive loads to the rock. The upper- and lower-pressure plates are 5/8 x 2 x 12 in. steel with 1/8-in.-deep sockets cut into the geometrical centers to accept the 1 ½-in.-diam steel balls. The 0.200-in.-thick steel used for normalizing the radiographs rests on the lower pressure plate to the
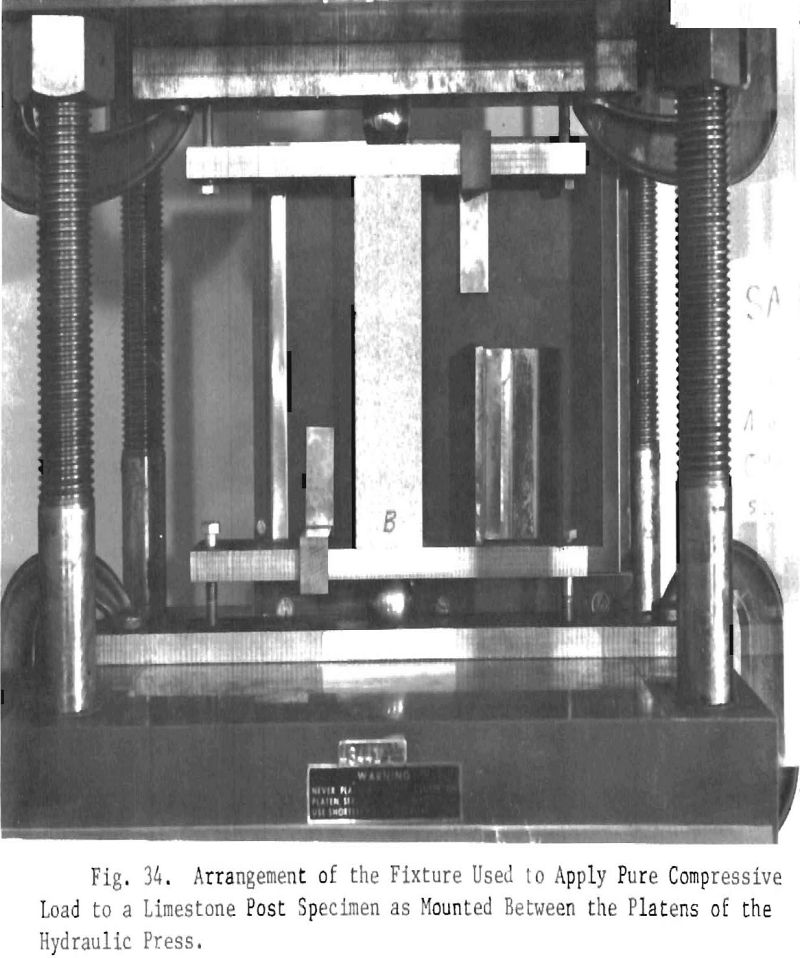
right of the rock specimen. We used an 8 x 10 in. rigid cassette with a cassette holder of corresponding size and similar to the one used for the beam specimens.
Figure 35 shows the arrangement of the x-ray machine and hydraulic press for the radiography of both beam and post specimens. We used a Norelco (50—150 kVcp) x-ray unit with a beryllium window tube and a 2.5-mm focal spot. The x-ray unit was operated at 150 kVcp and 11 mA at a 70-in. film-to-focal spot distance. We used Eastman Kodak type M film sandwiched between single sheets of PbO2-coated paper (obtained from Kodak lead-pack film). An exposure of 2 min 20 sec produced radiographs with a film density of about 2.4 in the image of the rock. The film was processed in an automatic processor.
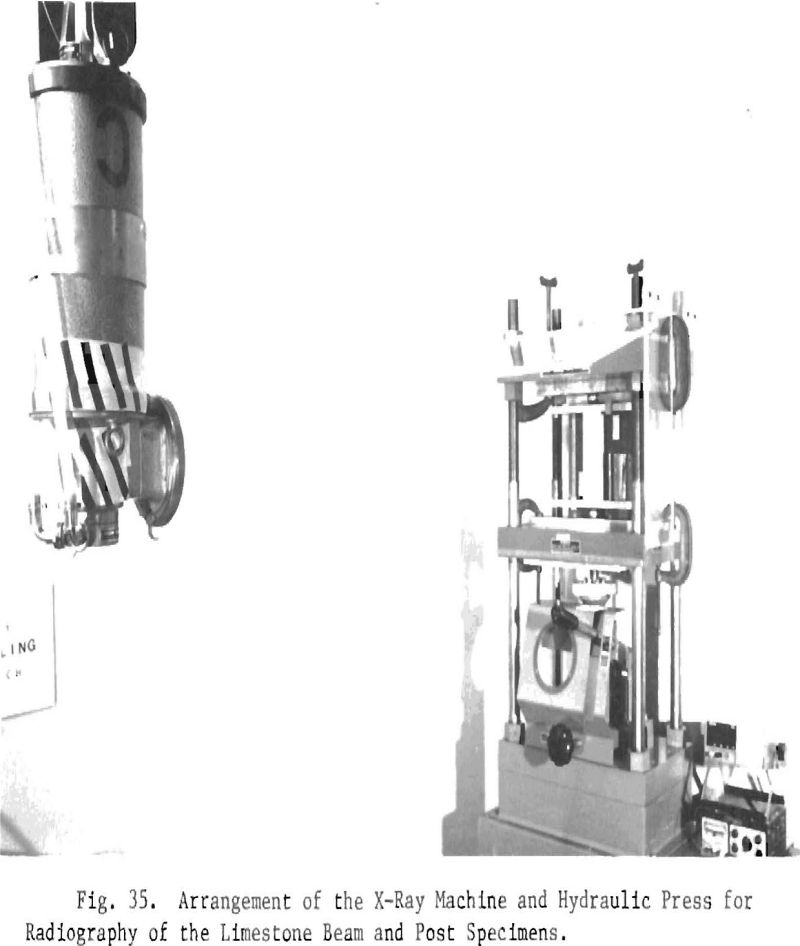
The load cell used to measure the total force applied by the hydraulic press is shown in Fig. 35 between the piston and underside of the lower platen. This is a Strainsert Universal Flat Load Cell, Model FL10U-2DP, with a 10,000-lb range and a 2 mV do output per volt input from the dc power supply. The load cell was operated with a 20-V dc input, which provided an output of 0.1 mV per 25-lb load. The output from the load cell was measured with a digital VOM.
The final piece of equipment to be described provides alignment marks on the radiographs to ensure proper positioning of the radiographs on the tandem microdensitometers so that identical areas in each of the radiographic images are interrogated simultaneously. These marks are created by imaging 0.010-in.-diam tungsten wires that are held to the ends of the beam specimens, as shown in Fig. 32. The wires were glued to a 0.020 x 5/8 x 2 ¼ in. strip of lead to form a “T” with a 1-in.- long vertical wire separated from a ½ in.-long horizontal wire by about ¾ in. This lead strip was then glued to a micarta clamp shaped to fit over the square end of the specimen and held to the rock with set screws. Another similar assembly was made fur the opposite end of the beam specimen, but with the wire “T” inverted. Similar markers were made for use with the compression specimens, but are clamped to the upper and lower pressure plates rather than the specimen, as shown in Fig. 34.
Testing Procedures
After the rock specimen was positioned in the loading fixture, a minimal pressure was applied to the lower platen of the hydraulic press to take up the vertical slack in the loading system components. At this point (no load on the specimen), the first radiographic exposure was made. This radiograph became the master to which all subsequent radiographs were aligned by superimposing the Images of the 0.010-in.-diam tungsten wire markers.
The hydraulic press was operated again until a 100-lb load was reached, and duplicate exposures were made at this level. Later, when these radiographs were scanned and subtracted by the tandem microdensitometers, a base-line recording was established.
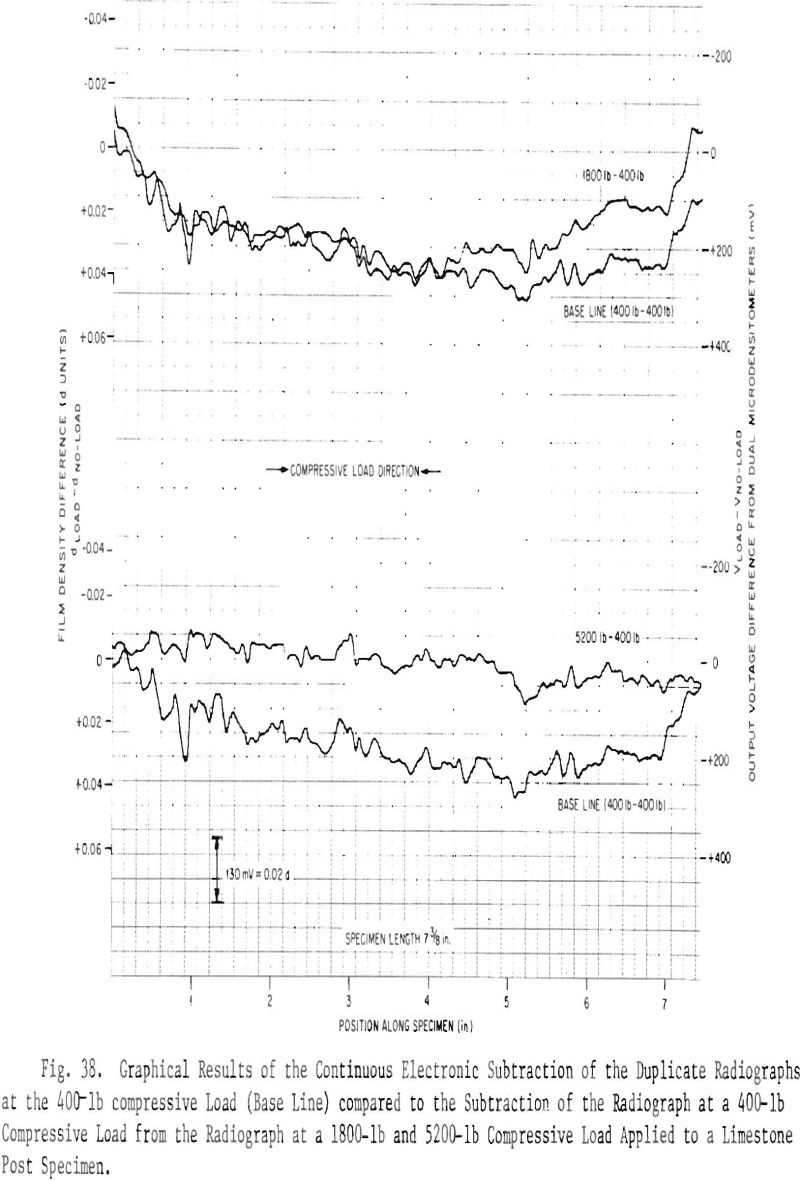
After these preliminary exposures, successive radiographs were made at increasing levels of load until the specimen cracked. All specimens subjected to four-point bending cracked at 1400 lb or lower. Experience showed that a practical schedule of load levels was 500, 900, 1100, 1300, and 1400 lb for the beam specimens. The schedule of loads used for the compression specimens, after the initial no-load, was 400 (duplicate radiographs), 1800, 3300, 4000, 4400, 4800, and 5200 lb. The magnitude of the internal compressive stresses at these applied loads was comparable to the magnitude of the internal compressive stresses resulting from the loads applied to the beam specimens.
Preparing the Radiographs for Scanning
Prior to scanning, a series of holes was punched in each radiograph to ensure proper positioning on the microdensitometers. These holes were located precisely by a predrilled Plexlglas template and were cut with a handheld punch similar to an awl. First, the specimen master radiograph was positioned on and taped to the template. Then, while being viewed on a light table, one of the other radiographs for the specimen was positioned over the master radiograph until perfect coincidence of the images from the alignment wires on each radiograph was achieved. At this point, the holes were punched, the load radiograph was removed from the template, and the procedure was repeated for the remaining radiographs of the specimen. Placement and alignment of the radiographs on the densitometer scanning tables was accomplished by inserting pins through the punched holes and into matching holes in the scanning tables.
Scanning the Radiographs with the Tandem Microdensitometers
Although we refined the entire experimental procedure to minimize the variables, there are inherent uncontrollable variables that result in slight differences of overall density from one radiograph to another within a complete set of radiographs. Because the relationship between stress and radiographic density was obtained by subtracting the electrical signals that are analogous to the film densities, the inherent differences were normalized or cancelled to provide a near absolute relationship between film density and load. This was done for each combination of load minus no-load radiographs by adjusting the recorder y-axis offset control for a midscale setting of the average difference signal while scanning over the 4-in.-long images of the steel normalizing strip.
We scanned the radiographic images of the beam specimens on paths parallel to the longitudinal axis of the specimens with the outermost scans within 1/8 in. of the edges of the image. Other scans within the boundary scans were ¼ in. apart. Each radiograph was scanned in two sections to cover its full 15-in. length because the densitometers were limited to a 9-in.-long travel. The radiographs of the compression specimens were scanned also on paths parallel to the longitudinal axis of the specimens. Here, though, we scanned on only three lines within half the width of the image, at 1/8 and ½ in. inside one edge and on the longitudinal center line, because the internal compressive stresses were symmetrical about the longitudinal axis of the specimen.
As was mentioned in the “Testing Procedures” section, we produced duplicate radiographs of the specimens at a load slightly higher than no-load. One of these was used as the basic “no-load” radiograph in the subtraction from the “load” radiograph. Additionally, when one of these duplicate radiographs was subtracted from the other, we were able to establish a base line to which the effects of load on radiographic density were compared. Theoretically this base should be a straight line, but inherent film and electronic noise and very minute uncontrollable variables in this highly sensitive system produced deviations from a straight line.
Several methods of data presentation were tried, but it became obvious that the clearest picture of the effect of stress on radiographic density was seen when the recording of a scan of the base-line radiographs over a certain scan path was presented along with the recording of the scan of a “load” radiograph over the same scan path. The total picture of the progression in the changes of radiographic density as the load was increased was seen when all the scans for a specific load were consolidated into one large montage.
Experimental Results
Figure 36 shows representative scans in the regions of maximum compressive and maximum tensile stress compared to the base-line scans for a 500-lb load on a beam specimen. Figure 37 shows scans in the same regions for a 1300-lb load. A comparison of these scans shows that the largest deviation of the load scan line from the base scan line occurs in the compressive stress region between the load points. When absolute radiographic densities were measured at identical spots on both the load and base radiographs in the region of maximum difference (near the load points In the compressive stress region), we observed that the load radiograph had a lower density than the base radiograph. Thus,
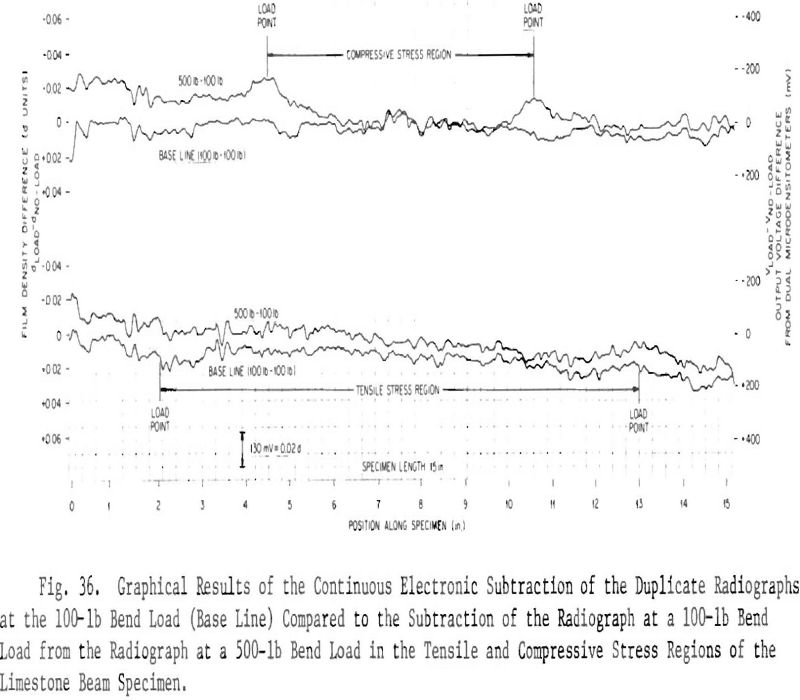
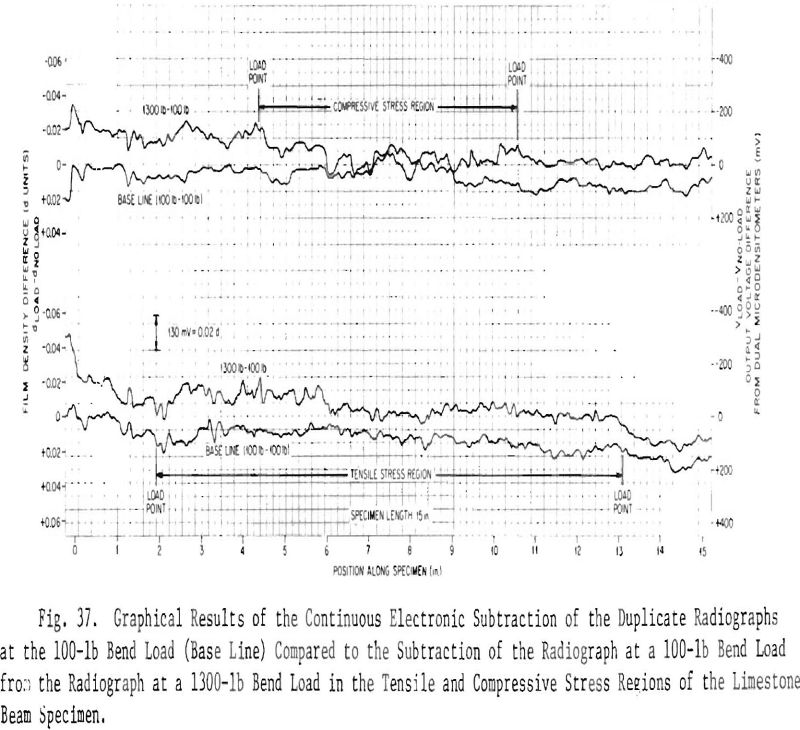
as the compressive stress increases there is an increase in the difference between the load and base radiographic densities and this increased difference is represented by a scan with a higher chart level than the base line. Note that the convergence of the 1300-100 lb scan with the base line occurs further from each load point into the compressive stress region than does the convergence of the 500—100 lb scan with the base line.
Figure 38 shows representative scans through the full length of the longitudinal center line of the 7 3/8-in.-long limestone specimen that was stressed in pure compression. Here, as with the bend specimen, we see a similar but more pronounced decrease of radiographic density of the load radiograph from the density of the base radiograph and, thus, a larger difference between load and base scans.
Theoretical Studies
Finite-Element Analysis of Stress Distribution
At the request of the Bureau we performed finite-element analyses for both the beam and the compression specimens to determine the stress distribution in the vicinity of the load application in the rock, specimens. An available finite-element code, based on Wilson’s work, was used. These data are available in this laboratory but will not be reported here. A detailed correlation of the stress distributions predicted by the finite-element analysis and the radiographic film densities was not done because the Bureau terminated its funding of this work.
Summary
We completed the development and utilization of the radiographic technique to examine qualitatively the behavior of a range of expansion anchor-rock-specimen combinations by producing a standard set of high-quality radiographs for eight representative expansion anchors in two
rock types (limestone and sandstone) of two diameters (8 and 12 in.) for as many as three orientations of the expansion anchor relative to the x-ray beam and at load levels between 0 and 20,000 lb. Some statistical data were also collected for each of the rock-anchor combinations. One anchor, Type 7, was prominent for exhibiting excessive load bleed-off at the higher load levels in both rock types. There was insufficient data to classify the anchors as to their effect on specimen cracking. In fact, the low number of specimens that cracked (about 8%) indicated that the combination of cylindrical shape and thick casing was more representative of an infinite rock layer than the previously stressed cubical shape with thin casing. The archive radiographic work was done to supply a product to the Bureau; additional analysis of this product is the responsibility of the Bureau.
We showed, through the theoretical studies of and experiments with the beam specimens under bend stresses and the post specimens under pure compression, that internal compressive stresses produce the major change in radiographic density as a function of load. However, we can only speculate about the mechanism that causes the decrease in film density observed when the compressive stress was increased. This mechanism may be the closure of microcracks resulting in an increase in specimen density.
This work was stopped because the Bureau did not feel it should play a role in additional funding of studies to define the radiographic mechanism or for further correlation of radiographic film density and stress.
Microdensitometer Modifications
To provide a flat surface for support of the 12 x 12-in. radiographs we removed the control assembly for the rotational movement of the specimen table, the scales used for measuring the rotary movement, and the stage clips. Removal of these parts provided a 7 x 14 ¾-in. surface. We fastened 1/8-in.-thick x 12 ½-in.-long aluminum strips to the top surface of the original traverse frame. These strips extended 5½ in. beyond the front edge of the original frame, and to the underside of these strips we bolted a 5 ½-in.-wide x 13 5/8-in.-long x 1/8-in.-thick aluminum plate. The extension assembly was fastened to the original frame so that the inner edges of the mounting strips were 1 in. from and parallel to the ends of the 10-in.-long opening for the glass plate film support of the original specimen table. The aluminum strip on the right side of the specimen table (when facing the microdensitometer control panel) served as the basic guide to position the radiographs on the specimen table.
Since the radiographs did not normally lie flat, we covered them with a 9 ½ x 12-in. sheet of 3/8-in.-thick Plexiglass. A 6 x 9-in. rectangle was removed from the Plexiglas sheet so the interrogating beam of the densitometer passed only through the film. This frame was heavy enough to hold the radiograph flat and also keep it aligned on the specimen
table.
Radiograph Cutting Procedure
The radiographic image of the central hole of the rock specimen was used as the basic reference for careful marking and precise cutting of the radiographs to the 12 x 12 in. size to assure that reproducible micro-densitometer scans of the radiographs would be made along known paths. To assure that all radiographs of a specimen were cut and marked precisely the same we made a template from 1/16-in.-thick Plexiglas. This template consisted of a Plexiglas strip, about the width of but longer than the center hole image, fastened to a large (18 x 18 in.) base sheet. In practice, the radiograph was sandwiched between the base sheet and the strip during viewing on a light table. A line scribed into and near the end of the Plexiglas strip normal to the longitudinal center line of the strip was used to align the image of the edge of the specimen (where the hole breaks through the surface of the specimen at the end away from the pressure plate). At a distance of ½ in. outside the scribed line and on the longitudinal center line of the Plexiglas strip we drilled a 1/32-in.-diam hole through the strip and base sheet. A similar hole was drilled 11 in. away at the opposite end of the strip. After a radiograph was aligned to the scribed line and the center hole strip, we punched holes through the radiograph by pressing a pointed stylus through the 1/32-in. holes in the template. Also, outside the scribed line and the 1/32-in.-diam hole, a section of the strip was cut away to provide a straight edge for marking the center-line position on the radiograph.
After a radiograph was aligned and marked as described above, it was cut on a paper cutter that was slightly modified by the addition of positioning pins on the base of the cutter and perpendicular to the cutter blade. These pins matched the location of the punched holes in the radiograph and positioned the radiograph for the first cut, which became the reference edge when placed on the densitometer specimen table. The other three edges of the radiograph were cut with the cutter guide bar used as reference. When the cut radiograph (12 x 12 in.) was put on the densitometer specimen table, the reference edge was butted against the specimen table guide, and the marked center line was set to match a line scribed on the guide.
