In topic one, we introduced stress and strain. These 2 variables are related because application of a stress results in a strain. In this topic, we will see how a specimen of intact rock responds when it is subjected to a simple compression. So, if we consider specimens, such as this one with flat ends, and we compress the specimen. So that could be represented as this little sketch here. So we have the specimen subjected to the compression and as the specimen is stressed, it deforms. So the mechanical response can be plotted in a stress, sigma, strain, epsilon, plane. It typically involves an initial non-linear part, where stress increases with strain non-linearly and is now, after that, followed by a linear evolution, where stress is proportional to strain.
Progressively, as we increase the stress, the rock starts to not be able to cope with the amount of stress anymore and that would lead to progressive failure, where the specimen breaks into pieces. The failure can be brittle, like glass breaking, and would have response like this, where the load suddenly falls, nut the specimen could also sustain the load, where we would have then a plateau there or even we could observe slight increase in the load past this inflexion point here, from the mechanical response, we can determine the unconfined compressive strengths of the rock, this corresponds to the peak value sustained by the rock specimen and we can read the value here, on the stress axis. However, this value, which is a resistance in compression, is not enough to fully characterize the strengths of the rock.
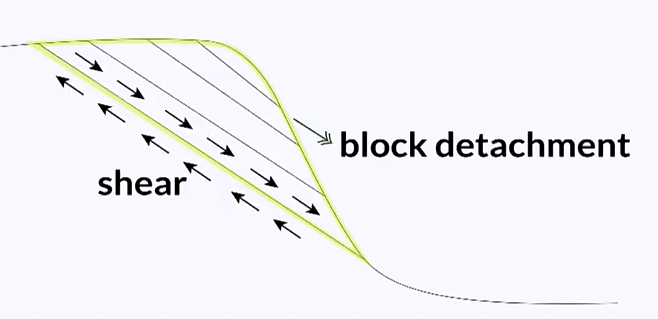
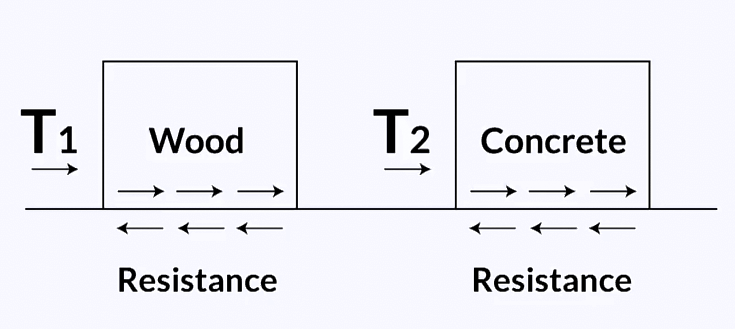
Take, for example, this rock specimen, which is broken here. It certainly has some strengths in compression, but there is no strengths in traction. So this shows that strengths has to be considered relative to loading conditions. In fact, in many engineering applications, another failure mechanism prevails. It is called shear, and it is a form of resistance to sliding. Consider this rock shape with discontinuities you can see on this figure. If the block highlighted in yellow detaches from the face, it would slide and that shows that the discontinuity is not subjected to tension or compression. This type of loading is called shear and it occurs when the forces acting on the specimen are not aligned anymore. So when it comes to the strengths of a rock, it is usually required to quantify the unconfined compressive strength, or also called U-C-S, the tensile strength, typically noted sigma t. sigma t is typically lower than about tenth of the unconfined compressive strength and we also have this shear strength we have just mentioned with the previous picture. The thing is this shear strength is not a unique value and this can be illustrated using this coming picture. If you consider two blocks resting on a flat surface, one block made of wood, one made of concrete, you would have more difficulties pushing and sliding the concrete block than the timber block, because the concrete block is heavier than the timber block. So that shows that, to some extent, the sliding resistance, or the resistance offered by the surface, depends very much on the amount of compressive stress applied perpendicular to the sliding direction. So the shear strength is not unique and in fact, of going back to the analogy of pushing a block, we should actually measure the shear strength for different values of weight of blocks, or vertical stress applied to the surface and by plotting all the values of shear strength against the vertical stress we have applied, we can form a failure criterion. So unconfined compressive strength, tensile strength, and the failure criterion of shear strength will provide all the information we need on the strength of the rock, because strength is the maximum value of stress the material can sustain, it is independent from the geometry of the specimen tested. That is the definition of stress we have seen in topic one. So strengths full characterize the material regardless of the geometry.
In topic 1, we said that it is important to assess how a material deforms under a load. To do so, we need the material’s deformability. This can be inferred from the stress-strain curve we have drawn before. Let us draw this curve again for a case of simple compression. So, we have stress as vertical axis, strain as horizontal axis, and the response we drew before was something like this. The deformability of the material is typically quantified through the coefficient of proportionality between stress and strain, which is called E and is the Young’s Modulus. So when it comes to engineering, this non-linear part is typically neglected and we simply consider that stress equals E times strain. E is very critical information to relate stress and strain. So let me explain this E a bit more to you. E is called the Young’s Modulus and we have a relationship between stress, sigma, equals E times epsilon. We set sigma as a unit of pascal. We set strain as no unit, hence, E as unit of pascal as well. Because stress and the strain characterize a material, regardless of the geometry of the specimen we have tested so does E. E is an interim property of a material, regardless of the geometry of the specimen we have used to obtain this response.
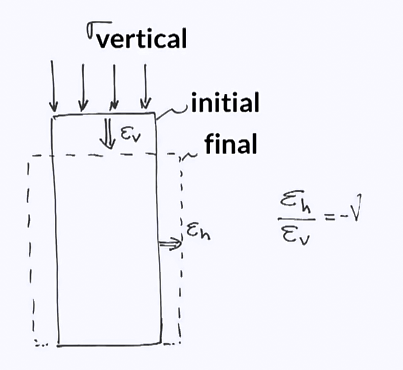
So now let us have a look at what happens in the direction perpendicular to loading. So that is, for example, if we know a specimen vertically, what happens in the horizontal direction? And let us start with an experiment. Let us take this rubber band and we are to stretch it. Look at how wide it is, and look at what happens to the width as we stretch it. We can clearly see that the rubber band narrows as we pull on it. If we had a specimen subjected to compression, the opposite would occur. As the specimen gets shorter, it would bulge and get thicker. This is illustrated in this picture. As the vertical strain and horizontal strains are related. They are in fact perpendicular and the coefficient of proportionality is called Poisson’s ratio. So we have the horizontal strain divided by the vertical strain equals minus Poisson’s ratio. The Poisson’s ratio, noted nu, ranges from 0.1, typically to 0.4 for rocks and a typical value would be around 0.3. you can notice a negative sign on the equation we showed on the picture. This is to reflect the fat that the compression in one direction creates an elongation in the other, and vice versa. So, in conclusion, knowing the properties of rock material, such as strengths and deformability is critical when it comes to designing a structure on a rock mass.
In the next topic, I will present you some of the laboratory tests we can conduct to infer the strengths of rock material.
https://youtu.be/E7eU54rAVAc
