Table of Contents
What is the potential of copper leaching operations in the western states to increase human health risk from drinking water? Should new leach pads be designed for worst case scenarios or for the most likely scenario? With limited funding, is money being spent on highest priority areas to reduce the greatest risk to human health and the environment? These are some of the questions that can be quantitatively evaluated with the probabilistic methodology being developed in the Mine site Risk Assessment (MSRA) project at the Minerals Availability Field Office (MAFO) in Denver, CO. The primary purpose of this paper is to present a risk assessment methodology and preliminary results that provide more realistic information for decision makers. Owners, regulators, and designers can use this methodology to determine the risk-benefit of different design options.
Risk, as defined by the Environmental Protection Agency (Fed. Reg., 1992), is the probability of deleterious health or environmental effects. The National Academy of Sciences (1991) defined risk assessment as the qualitative or quantitative characterization of the potential health effects of particular substances on individuals or populations.
Copper dump-leaching methods are currently being used at several mine sites in Arizona and New Mexico to recover copper from low grade copper ore. Many of these leaching operations are unlined heaps situated directly on bedrock. Generally the bedrock is a Pre-cambrian granite or a Tertiary volcanic, however some heaps are located on the Gila conglomerate. The Gila conglomerate consists of deposits of sand, pebbles, cobbles, clay, and boulders cemented with calcite. In many parts of New Mexico and Arizona the Gila conglomerate forms the unsaturated or vadose zone (500 to 1500 feet thick) above the water table. The Gila conglomerate also represents a source of groundwater in the region (Peterson, 1962).
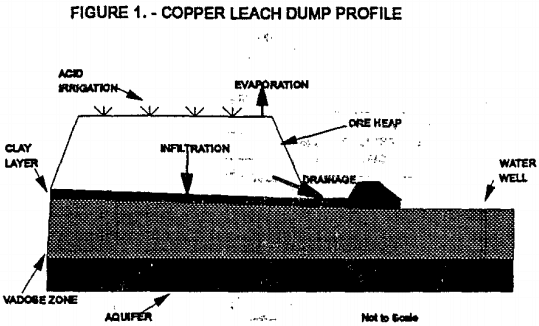
Dump leaching is similar to truck end-dumping of waste rock over nearby terrain whereas heap leaching is usually done on engineered-pads. Figure 1 depicts a generic copper dump-leaching operation. As noted in figure 1, the primary components of solution movement are 1) acid irrigation (and some precipitation), 2) evaporation, 3) infiltration, and 4) drainage to a collection pond.
The Mine Site Risk Assessment project pursues a course of action following recommendations made by the National Academy of Sciences (Nat. Acad. Sci., 1989) to develop further modeling of the following: 1) groundwater flow in unsaturated and fractured media, 2) mass transport coupled with chemical reaction and 3) methods for identifying and presenting uncertainty. In addition to these recommendations, the EPA’s Guidelines for Exposure Assessment (Fed. Reg., 1992) makes the following key statement regarding a modeling
strategy: “Often the most critical element of assessment is the estimation of pollutant concentrations at exposure points. This is usually carried out by a combination of field data and mathematical-modeling results. In the absence of field data, this process often relies on the results of mathematical!models. The general framework for the course of, action taken in this project was presented by Freeze et al.(1990).
Given the current, and possible new requirements of the Resource Conservation and Recovery Act (RCRA), Safe Drinking Water Act (SDWA), and Clean Water Act (CWA), the Mine Site Risk Assessment project presents a relatively inexpensive and practical methodology for determining the potential risk of copper leaching operations to contaminate-drinking water. The project takes off the shelf computer programs to examine solute movement in the vadose (unsaturated) zone, geochemical reactions, saturated flow, risk analysis, and human health risk assessment. The project uses probability methods to quantify input-parameter uncertainties. These uncertainties include sources such as measurement errors, sampling errors, and spatial variability.
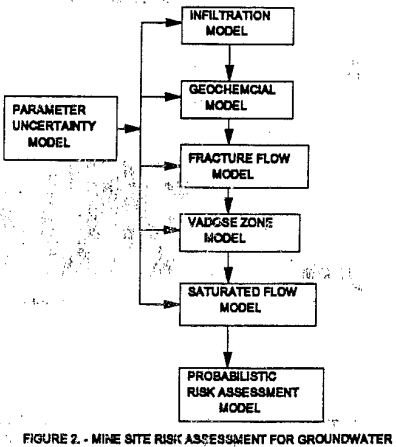
The planned course of action for this project is shown in figure 2. To model mathematically the different solute transport processes, chemical reactions, and quantify uncertainty, different computer models are used to simulate each phase of the solution movement. The parameter uncertainty model, produces probability distribution functions for the input parameters that may contain uncertainty or variability. At this stage in the project, the programs are manually coupled rather than automatically providing input for the next program. The probabilistic risk assessment model uses the probability outputs to determine the probability of deleterious human health effect’s, from drinking water. This methodology when combined with another MAFO project (investigating the costs for liners, closure caps, and financial assurance for copper leaching operations) provides a cost-risk-benefit approach to proposed copper leaching operations. This methodology could also be applied to other leachate generators such as municipal landfills.
This report will generally follow the flowchart shown in figure 2. The report consists of five sections much like chapters of a book. These sections will cover, the following topics: 1) parameter uncertainty analysis, 2) infiltration modeling, 3) fracture flow review, 4) geochemical modeling, 5) vadose zone modeling. This report does not cover saturated flow modeling at this time because the preliminary results indicate the heavy metals may not reach the saturated zone. The modeling of fracture flow and the risk to human health
will be done at a later date. The last section is followed with references and a glossary.
Since this a preliminary report, the following assumptions and qualifiers are listed as caveats:
- The data used in the models are for a generic mine site, because site specific data were not available.
- The models have not been calibrated or verified with actual field data, because this is a preliminary effort and site specific data were not available.
- Only a few selected heavy metals’ are modeled, because this was a preliminary and developmental effort.
- The models assume that the Gila conglomerate is initially uncontaminated, because there were not actual field data.
- Biochemical processes are not addressed, because this was a preliminary and developmental effort.
- No 3-D modeling, therefore the effects of horizontal dispersion are not included. This can be addressed at a later date with site specific data and more complex models.
- The modeling does not include ion exchange, adsorption, dilution, colloids, or organics, because this was a preliminary and developmental effort.
- The vadose model assumes that there are no continuous interconnecting fractures. This assumption was made because models used in this developmental effort do not account for fracture flow. Fracture flow will be addressed later.
Parameter Uncertainty Analysis
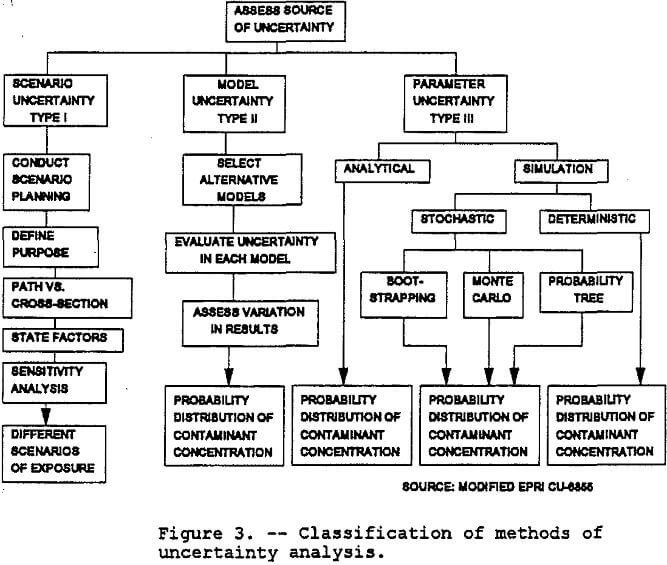
The EPA’s Guidelines for Exposure Assessment (Fed. Reg., 1992) describe the general concepts of exposure assessment including definitions and associated units and provides guidance on planning and conducting exposure assessments. These guidelines list three types of uncertainty:
- Uncertainty regarding missing or incomplete information needed to fully define the exposure and dose (scenario uncertainty or Type I) .
- Uncertainty regarding gaps in scientific theory required to make predictions of causal inferences (model uncertainty or Type II) .
- Uncertainty regarding some parameter (parameter uncertainty or Type III)(Faruqui, 1990).
Scenario uncertainty includes descriptive errors, aggregation errors, errors in professional judgment and incomplete analysis. Sources of parameter uncertainty include measurement errors, sampling errors, variability, and use of generic or substitute data. Relationship errors and modeling errors are the primary sources of modeling uncertainty. Figure 3 shows the taxonomy of methods for dealing with the three types of uncertainty. Note that variability is the receipt of different levels of exposure by different individuals, whereas uncertainty is the lack of knowledge about the correct value for a specific parameter. Spatial variability will not be addressed in this paper.
The approaches for analyzing uncertainty listed in order of increasing complexity and data requirements are sensitivity analysis (deterministic), analytical uncertainty propagation, probabilistic uncertainty analysis, and classical statistical methods. Sensitivity analysis is the process of changing one variable while leaving the others constant and determining the effect on the output. In analytical uncertainty propagation, both the model sensitivities and input variances are evaluated. The Monte Carlo technique is the most common form of probabilistic uncertainty analysis. Classical statistical methods are based on the evaluation of confidence intervals
and require a well-defined system and measure input-parameter data (Cox & Baybutt, 1981).
In groundwater contamination modeling the dependent variables are the hydraulic head (which is the dependent variable in the flow equation) and the concentration (which is the dependent variable in the transport equation)(Freeze et al, 1990). The model input-parameters that are subject to uncertainty are hydrogeologic parameters such as porosity, hydraulic conductivity, dispersivity, and moisture content. These parameters may be homogeneous or heterogeneous and isotropic or anisotropic over space or time.. The magnitude of the parameter uncertainty is a function of the spatial heterogeneity and temporal variability of aquifer properties, boundary conditions, dependent variables, density of observation points, and the measurement techniques.
If parameters are known with certainty, then they can be modeled deterministically. In deterministic analysis, a base case is created using best estimates of the parameters and then a sensitivity analysis can be done to determine the impact of varying different parameters. If not, then probabilistic uncertainty analysis is used to quantify uncertain quantities (random variables). Probability analysis can be done using classical statistics or Bayesian updating. Classical statistics require measured data to create probability density functions (PDF). In the Bayesian approach a prior estimate of the probability density function is made. Prior estimates may be based on limited data or subjective information. When additional data becomes available, it is used to update the prior estimates of the statistics to posterior estimates using Bayes theorem (Aczel, 1989).
Bayesian statistics assume those population parameters such as the mean and variance are random variables rather than fixed quantities, as in the classical approach. An advantage of the Bayesian approach is the possibility of carrying out a sequential analysis —continually updating the probability distribution function as additional information becomes available (Aczel, 1989).
Stochastic Simulation
A stochastic process is the concept of statistically characterizing a family of random variables that are a function of time. Stochastic simulation of uncertainty in the input parameters is addressed with probability density functions. These uncertainties are propagated by three different methods (Freeze et al., 1990):
a. First-order moment analysis uses the first two moments (expected value and variance) of the input parameters. The expected value is given by the following equation:
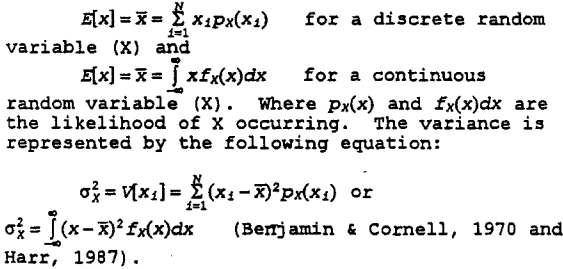
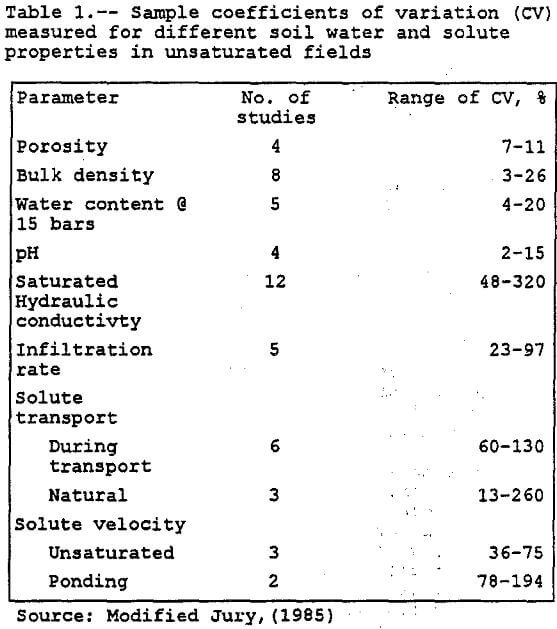
Variance is a measure of dispersion of the random variable around its mean. The smaller the variance, the more sharply concentrated is the probability density function around its mean value. The square root of the variance is called the standard deviation of a random variable. The ratio of standard deviation to the mean is called the coefficient of variation denoted by CV. According to Harr (1987), the CV is a fairly stable measure of variability for homogeneous conditions. Harr’s rule of thumb for CV is below 10% is low, between 15-30% moderate, and above 30%, high. Table 1 lists sample coefficients of variation (CV) measured for different soil water and solute properties in unsaturated fields. First-order analysis is limited to linear or nearly linear systems where the CV is less than one (Peck et al, 1988).
b. In perturbation analysis the output variable and the input parameters are defined in terms of a mean plus a perturbation about the mean. During the simulation an algorithm tracks what would have happened if the parameter had not been “perturbed” or greatly disturbed. This method is best suited to analytical solutions with a small coefficient of variation in the input parameter (Freeze et al., 1990).
c. Monte Carlo simulation requires that the complete PDF be known for each input parameter. There are three types of Monte Carlo techniques: 1) direct Monte Carlo, 2) Monte Carlo with variance reduction, and 3) Latin Hypercube. The random sampling technique of the Monte Carlo simulation does not adequately sample the tails of the distribution of key model parameters and inputs. This weakness is overcome with the Latin Hypercube sampling technique (Faruqui, 1990). Shields et al., (1989) points out the significance of using Monte Carlo simulation in risk assessment by noting that it not only provides the probability of occurrence but also prevents the use of unrealistic combinations of input, which can happen with worst-case analyses.
Vadose Zone Hydraulic Conductivity
As Freeze et al. (1990) note, the input parameter with the largest uncertainty is the hydraulic conductivity. For this project parameter uncertainty analysis was applied to the hydraulic conductivity used in the vadose zone model. The frequency distribution of hydraulic conductivity is assumed to be lognormal. This is a reasonable assumption because many physical variables in nature are best represented by lognormal distributions(Davis, 1986 & RISK, 1992). Work done by Woldt et al. (1992), Freeze (1975) and Hoeksema and Kitanidis (1985) also supports the use of the lognormal distribution for the hydraulic conductivity.
The intent of this paper is to address parameter uncertainty by generating PDF’s for each uncertain parameter beginning with the hydraulic conductivity. Values from these PDF’s would be entered as starting values for each iteration of the model. Each iteration of the model would produce values for the output PDF. Values from the output PDF would be used as input for the next model. Ideally, all the models could be coupled through the computer so that the output from one model becomes the input for the next model with an overall Monte Carlo simulation occurring for each iteration of the combined models. This would allow uncertainties in the hydrogeologic parameters to be automatically propagated through the models, thus providing a probabilistic risk assessment to human health. For this preliminary work, the models are manually coupled.
For this, paper, a simulation was only conducted for the hydraulic conductivity used in the vadose zone model. The mean unsaturated-hydraulic-conductivity value was generated by the RETC model (see the vadose modeling section). Using the mean value and the coefficient of,variation (320%) for saturated hydraulic conductivity from Table 1, the standard deviation was calculated. (This approach was taken because of very limited data on the unsaturated Gila conglomerate.) The lognormal distribution requires only the mean and the standard deviation to create a distribution. The PDF was generated by the RISK program (RISK, 1992). RISK is an add-on to the Lotus 123 spreadsheet that does Monte Carlo simulations based on a selected probability distribution such as the lognormal distribution.
Estimating Infiltration From Copper Leach Operations Using The Help Model
This section estimates the water balance associated with the movement of copper leaching solution at a copper leaching operation by using the Hydrologic Evaluation of Landfill Performance (HELP) (Schroeder et al., 1992) computer model. Determining the potential of a copper leaching solution to infiltrate a geologic formation underlying a copper leaching operation is the first stage of determining the potential of a copper leaching operation to pollute an aquifer. The leachate quantity entering the underlying formation, which could be a vadose zone, is required for modeling the potential for leachate contamination of the underlying formation. Data used in this modeling effort was gathered from literature reviews, trip reports on Arizona and New Mexico copper mines, and state agencies.
The HELP model was chosen for its appropriateness to the task, availability, and broad-in-depth user base. Hutchison and Ellison (1992) used HELP to predict the infiltration and percolation rates in mine waste piles. Williams (1993) used the HELP model to determine the performance of various configurations of tailings cover configurations in Australia. Peyton and Schroeder (1992) field-verified the HELP model for landfills at six-different sites in California, Kentucky, and Wisconsin.
HELP Model
The HELP model evaluates the hydrologic performance of landfill designs by mathematically tracking water movement across, into, through, and out of landfills. Daily runoff, evapotranspiration, percolation, and lateral drainage for a landfill are calculated by the model. HELP does not model solute transport through the vadose zone or the saturated zone. It is a quasi-two-dimensional, deterministic, water-budget model adapted from the HSSWDS (Hydrologic Simulation Model for Estimating Percolation at solid Waste Disposal Sites) model of the U.S. Environmental Protection Agency, CREAMS (Chemical Runoff and Erosion from Agricultural Management Systems), and SWRRB (Simulator for Water Resources in Rural Basins) models of the U.S. Agricultural Research Service.
Model Input
Model input consists of three general data sets: soil data, site data, and climatological data. The soil data portion of the model contains two options for entering data: default values or manual entry. The manual soil-data entry requires the following information:
a. number of soil layers (12 maximum)
b. layer types
c. thickness
d. wilting point
e. field capacity
f. porosity
g. saturated hydraulic conductivities
h. leakage fractions for synthetic membrane liners
j. runoff curve number
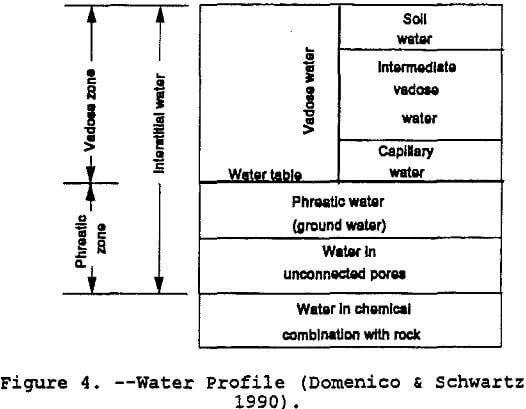
Figure 4 shows the various components of water in the soil.
Site data describes the landfill physical composition with descriptors such as layer types and soil textures. Landfill profile type refers to the different soil layers that the model uses. The model uses three generic layers to categorize water movement. The user must identify the layers used in each modeling application. These layer types are listed below:
- Vertical percolation layer — the flow is either downward due to gravity drainage or upward due to evapotranspiration. The rate of percolation is assumed to be independent of conditions in adjacent layers. Waste layers and vegetation layers are examples of vertical percolation layers.
- Lateral drainage layer — flow is in the vertical and lateral directions. A barrier soil is usually placed immediately below a lateral drainage layer. For lateral drainage layers, the model has the following processing limitations for the lateral layer base: 0 to 30 percent slope and drainage length of 7.62 m to 762 m.
- Barrier soil layer — restricts vertical flow. The model uses two types of barrier layers: those composed of soil alone and those composed of soil overlain by an impermeable synthetic membrane.
The climatological data is entered by one of three options: default, manual, or synthetic precipitation. For each of the options the daily temperature and solar radiation data are generated stochastically. Synthetic daily temperature is created from the mean monthly temperature and daily rainfall. Synthetic daily solar radiation is generated from the latitude, daily rainfall, average dry-day solar radiation and average daily wet-day solar radiation.
Model Assumptions
The developers of the HELP model made the following assumptions when creating the code for the model:
- The entire landfill lies above the water table.
- Surface runoff from adjacent areas does not run onto the landfill.
- Physical characteristics of the landfill remain constant over the modeling period.
- Darcy flow through the soil and waste layers.
- Flow through fractures, root holes or animal burrows is not included.
- Percolation always occurs over the entire barrier layer.
Estimating Infiltration
Entering Soil Data: To run the program, the input module is first run to manually input soil data and climatological data, or use the default values and synthetically generate climatological data. Obtaining soil data for the ore and Gila conglomerate has been one of the most time consuming efforts of the project. Schlitt (1992) and Bartlett (1992) also noted the lack of heap permeability data and vadose zone data. Data has been complied from various U.S. Bureau of Mines (USBM) personnel data-gathering trips to Arizona and New Mexico. These data provide some but not all the information needed to accurately profile the heap and Gila Conglomerate. Soil data characteristics used in this project are best estimates based on available information.
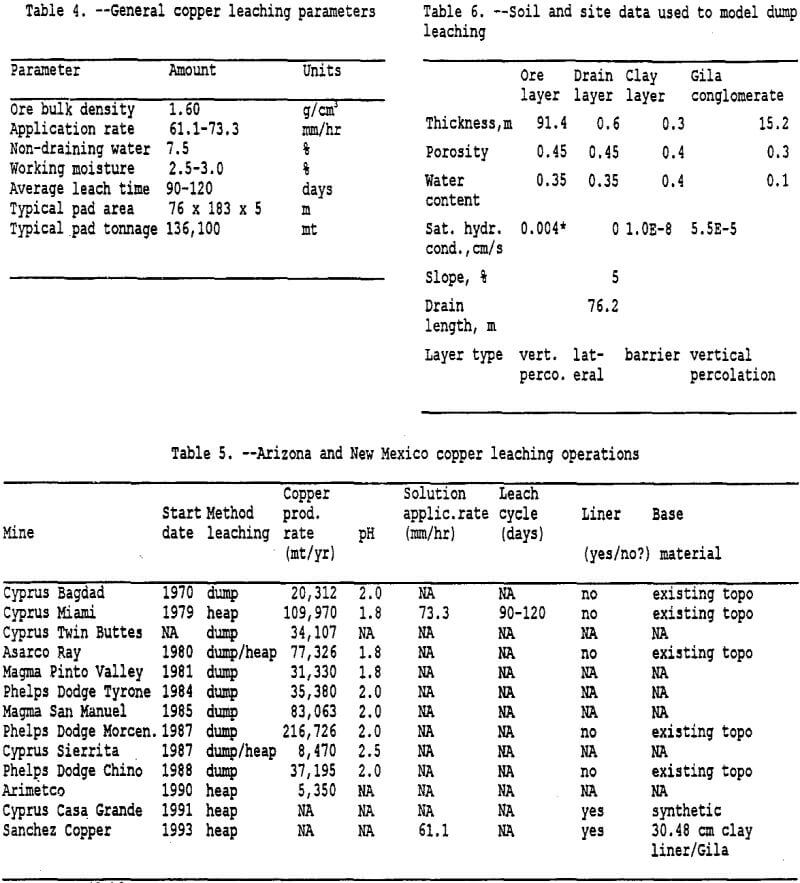
Dump leach operations may have difficulty lining the surface prior to placing ore for leaching because of slope and terrain features (see Table 5). However, for this project, the ore is assumed to be placed directly on the Gila Conglomerate, which contains calcium carbonate and clays as a matrix material. As noted by Bartlett (1992), carbonates and soluble calcium bearing silicate minerals cause precipitation of gypsum, which has a molecular volume much greater than the minerals it replaces. In addition, formations that contain clay or minerals that weather to clay quickly lose permeability. A 30.5 cm thick clay layer was used to simulate the reduction in permeability at the interface between the heap and the foundation layer. Van Zyl (1993) also noted that as the solution comes in contact with clay, gypsum will precipitate and decrease the permeability of the clay. The model requires a clay layer (barrier layer) in order to generate lateral drainage.
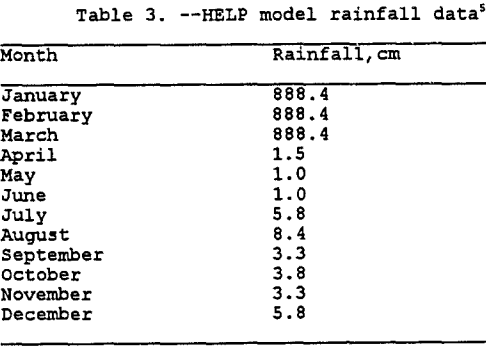
Entering Climatological Data: As mentioned previously, the input module also incorporates the climatological data. Three options are available as noted above. To simulate the irrigation of the heap for 90 days each year over 5 years, rainfall data was manually entered for each day. This was accomplished by using the average monthly rainfall data from Miami, Arizona from 1913 to 1986 (Hydro Geo Chem, 1989) combined with the solution application rate for typical copper leaching operations. Rainfall data used in the model is listed in table 3. The model could be improved by entering actual daily rainfall amounts for five different years. However, for this modeling effort the rainfall data is identical for each year. Refer to tables 4 and 5 for more detailed information on solution application rates. Note that the application rate has been converted to millimeters of rainfall over a 13,935 sq. meter area for a 90 day period. Currently available information suggests that the mining operations cycle-times limit the irrigation of a leach pad to roughly once a year. For modeling purposes the 90 day period was placed at the beginning of the calendar year, more extensive modeling could examine placing the 90 day period over a 12 to 18 month cycle.
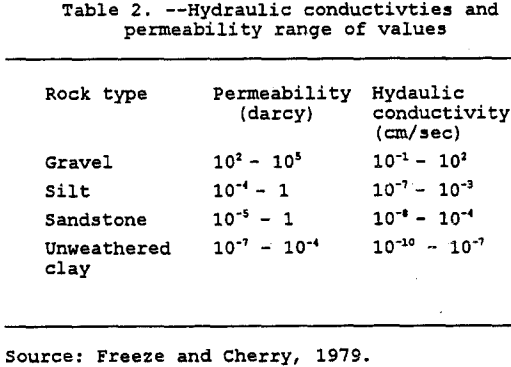
The application rate is calculated by dividing the leach-solution volumetric flow rate by the surface area on which the solution is actually being applied. Regardless of the application rate, the solution velocity through the heap is controlled by the hydrostatic head and the permeability of the heap. The permeability is a function only of the medium through which the fluid flows. It is usually measured in darcies or sq. cm. Table 2 lists the hydraulic conductivity and permeability range of values for different rock types.
The irrigation rate is a measure of the intensity of leaching. The irrigation rate is defined as (Barlett, 1992):

Results
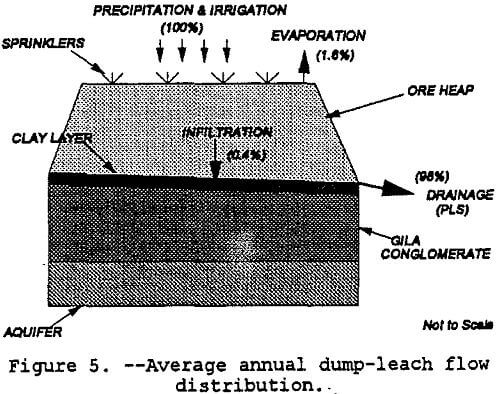
The modeling of infiltration was done with a generic vertical profile of the ore heap and foundation material. The heap was simulated as a vertical percolation layer which would reflect the unsaturated conditions needed for iron-oxidizing or sulfur-oxidizing bacteria such as thicbacillus thiooxidans and thiobacillus ferrooxidans to become active (Peters, 1991) . As noted in Figure 5, the heap overlays a 0.6-m thick drainage layer which is sitting on a 0.3-m compacted clay layer. Underlying the clay layer is the Gila conglomerate with thicknesses varying from hundreds to thousands of meters. Only 15.2 meters of the Gila conglomerate were modeled. Table 6 shows the soil and site data used for modeling. The HELP model simulated leaching over five years and produced the following water balance results: precipitation = +100%; evaporation = -1.6%; Gila conglomerate infiltration = -0.4%; and drainage to the collection pond = -98%. These distributions are shown in figure 5. As noted in the caveats of the introduction, this preliminary water balance is not based on site specific data nor has the model been calibrated. However, the infiltration amount is similar to Barlett’s (1992) estimate of one percent of the recirculating solution flow rate for a leach dump placed unlined ground.
Modeling of Contaminant Transport in Fractured Rock
The issue of flow in fractured rock is important because most, if not all, geologic formations contain fractures whether they are very minute microfractures or major fault systems. Contaminant transport in fractured formations is complicated because of the many unknowns associated with fractured formations and the cost in time and money to gather the necessary data. These unknowns are compounded even more when solute transport is examined in fractured unsaturated versus fractured saturated medium. Representing these complex systems with computer models is a science that is in the research and development stages.
Rock systems
Fractures are physical discontinuities within the rock medium. These discontinuities were formed during various development stages of the rock medium. The physical discontinuities may consist of fractures, joints, or shear zones; all of which are affected by the internal and external pressures on the rock medium. The fracture apertures can be open, mineral-filled, deformed, or a combination of these. Fracture permeability can also be reduced by gouge and low-permeability fracture skin —surfaces of the fracture that are exposed to the solute.
Fractured rock has primary and secondary porosity. Primary porosity relates to the pore space formed at the time of deposition and diagensis of the rock medium. Secondary porosity is created during fracturing and weathering of the rock mass (EPA, 1989). With low primary permeability, the secondary porosity and permeability tend to increase with increasing fracturing and weathering. Metamorphic and igneous rocks have permeabilities in the range of 10 -12 to 10 -16 cm² (Anderson & Woessner, 1992). Sedimentary rocks such as shale, claystone, and siltstone have high matrix porosities, but low permeabilities, whereas sandstone has high matrix porosity with significant matrix permeability ( van der Heijde and El-Kadi, 1989). In general, for a fractured rock system, secondary permeability can increase the effective hydraulic conductivity by five orders of magnitude (Anderson & Woessner, 1992).
Contaminant transport
Contaminant transport in fractured, saturated rock formations is controlled by the same transport processes that occur in porous saturated formations: advection, mechanical dispersion, diffusion, sorption, and chemical and biological processes. Major factors affecting flow in fractured rock are the fracture density, orientation, effective aperture width, and the nature of the rock matrix. The rate of contaminant movement into and out of the rock matrix depends on the low-permeability fracture skins, matrix permeability, and the matrix diffusion coefficient of the contaminant (Schmelling and Ross, 1989). Mechanical dispersion within fractured rocks results from the following: 1) mixing at the fracture intersections; 2) variations in fracture aperture width; and 3) variations in aperture width along stream lines. Van der Heijde (1989) believes the major contributor to dispersion in fractured media is the geometry of the network of interconnected discontinuous fractures.
Miller (1993) recommends that the following information is needed to accurately calculate fracture flow dispersion:
- Directional components of groundwater flow.
- Hydraulic conductivity.
- Direction of hydraulic conductivity.
- Number of fracture families.
- Fracture spacing of each fracture family.
- Strike of fracture family.
- Frequency of fracture family occurrence.
- Standard deviation of the spacing of individual fracture segments.
- Average porosity of the fracture family.
Types of models
Presently, several different geometric concepts for modeling fracture flow have been proposed or tested. The three basic conceptual models are 1) equivalent porous media, 2) discrete fracture, 3) dual porosity.
The equivalent porous media model treats the fractured rock system like an unconsolidated porous medium. The method replaces the various primary and secondary porosities and hydraulic conductivities of different fractures with one set of effective hydraulic properties representing a continuous porous medium. This method is useful when the spacing of the fractures is small compared to the scale of the system being studied. The equivalent porous media model provides a good representation of a regional flow system. However, it does not accurately represent local conditions.
Discrete fracture models exclude the fracture geometry and treat the fractures as flow channels with parallel sides. This idealization assumes that the parallel sides have a uniform separation equal to the fracture aperture. This model assumes that water moves only through the fracture network. It is normally used to model fractured media with low permeability such as crystalline rocks. An accurate description of the fracture network, including fracture apertures and geometry is required. According to Schmelling and Ross (1989) for practical purposes it is impossible to define the fracture system at a site in fine enough detail to apply this model.
If the rock formation has significant primary permeability, the dual porosity model may be used. The dual porosity model uses one porosity value for the fracture system and one porosity value for the porous rock matrix. This model assumes that flow through the fractures is accompanied by movement of solute into and out of the surrounding porous rock matrix.
The review of current literature shows that modeling of solute transport in fractured rock formations is still in the research and development phase. Presently, the available models require assumptions that vastly over-simplify the actual fractured system. The cost to reduce the oversimplification is too prohibitive for most practical applications. To date no models have been field-validated. Therefore, the mine site risk assessment project did not attempt to model fracture flow.
Geochemical Modeling
Conceptual Approach
Currently available codes for modeling subsurface contaminant transport combine both chemical and transport expressions to capture the complexity of the physicochemical processes occurring between the contaminants and the reactive matrix through which the contaminants flow. Most of these models are limited to a constant ground water velocity moving in either one or two dimensions (Mangold and Tsang, 1991). These models are based on either one of two available approaches: (1) substitute variables from several expressions to form one set of equations, or (2) solve the chemical relationships and transport equations sequentially at each time or distance step.
It was decided to use the second approach in designing a manually coupled model to describe the contaminant transport by linking transport model SWMS 2D (Simunek et al., 1992) with the equilibrium geochemical model MINTEQA2 (Allison et al., 1991). The modeling is accomplished by determining the geochemistry of segments of Gila conglomerate over a range of pH values using MINTEQA2. The geochemical output for each segment is used to derive effective first-order rate constants for the precipitation of copper and aluminum.
Complexation and subsequent precipitation of dissolved metals can have a significant effect upon the fate and transport of these metals through porous unsaturated and saturated subsurface environments containing carbonate minerals. The calcite acts as a base and will raise the pH of the solution. This increase in the pH will allow many of the metallic contaminants, including Fe, Cu, and Al to form complexes in solution. In many cases the complexes formed are solids and will precipitate out of solution, which will retard the migration of the contaminants (Eychaner, 1989). The rate of precipitation will not be constant, but will depend upon variables such as pH, metal concentration, redox potential, bacteria, etc. Thus, to model the transport of the metal contaminants, the combined effect of these variables on the rate of precipitation must be taken into account. The approach chosen to model this combined effect of variables consisted of using MINTEQA2 to determine the mass distribution of the chemical species of interest as the solution reacts with the calcite in the system for given volume increments of Gila conglomerate and pregnant leach solution (PLS). Thus, by dividing the system into individual discrete increments, the effective first-order precipitation rate constants for each segment can be approximated. These rate constants will then be used in future efforts to model the transport of the contaminants through the unsaturated zone using the variably saturated transport code SWMS 2D (Simunek et al., 1992). The sum of these increments should then describe the overall behavior of the contaminant plume as it migrates through the Gila conglomerate.
PLS Characteristics
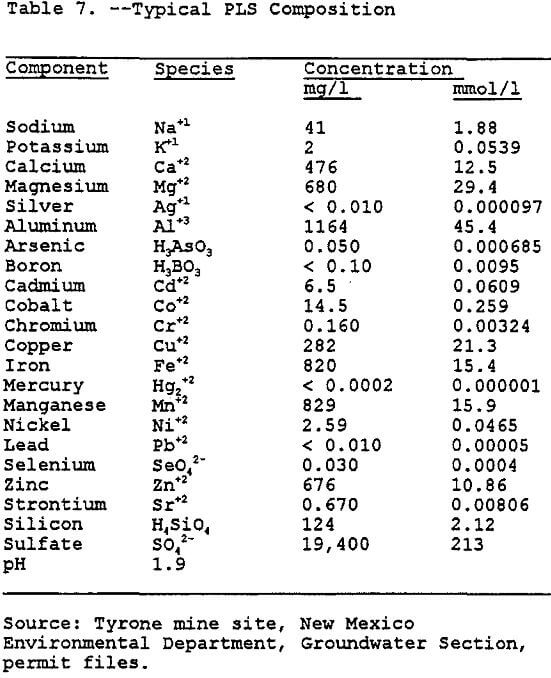
Copper leaching, solvent extraction, and electrowinning (L-SX-EW) have been traditionally used to recover copper and other metals from low grade ore. Since this work is not directed toward determining the potential for contamination at a specific site, a generic site was chosen. This generic site combines the characteristics of several copper mining operations in the region. The PLS that drains from the heap is heavily laden with dissolved metals (see Table 6).
Gila Conglomerate Composition
The Gila conglomerate primarily consists of deposits of sand, pebbles, cobbles, and boulders of local origin cemented with calcite. The Gila conglomerate is periodically interbedded with layers of sand, tuff, and sheets of basalt. The Gila conglomerate overlies all older deposits. It rests upon erosional surfaces with considerable angular unconformities and relief. The features of the deposit are typical of alluvial fans which are laid down by periodic floods and intermittent streams. The character and composition of the Gila conglomerate will differ from site to site depending upon the source of the deposits and upon the amount of transportation and weathering they have undergone. The deposits range from completely unsorted and unconsolidated rubble of angular boulders up to 15 feet in diameter to well-stratified deposits of firmly cemented sand, silt and gravel containing well rounded pebbles and cobbles (Peterson, 1962).
The only uniform characteristic of the Gila conglomerate of geochemical importance is the calcite, which acts as a cementing agent. The amount of the calcite varies, but it has been nominally reported to be 1.5 % by weight (Eychaner, 1989). Besides the calcite, the only other characteristic which is consistent at each site is that the predominant nature of the geology in the region consists of old crystalline schists, which have been highly deformed and intruded in various areas by igneous rocks. Therefore, in order to determine the mineral characteristics which are required inputs into MINTEQA2, a typical composition was determined. This composition was assumed to be approximately the same as that of the Schultze granite reported by Peterson (1962) and, after comparison with the minerals available in the MINTEQA2 database, was assumed to approximate the composition shown in Table 8.
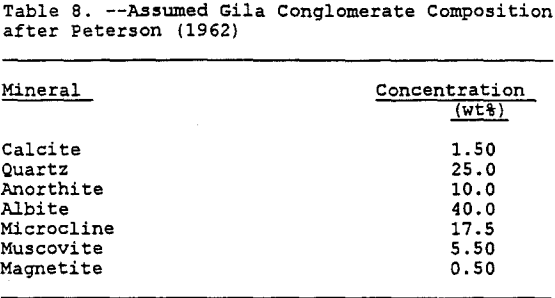
For the geochemical modeling, the input of the mineral phases present requires a concentration in moles of mineral per liter of solute. These concentrations were determined based upon the nominal chemical compositions (Monttana et al., 1978 and Pough, 1983)of the minerals and are tabulated in Table 9.
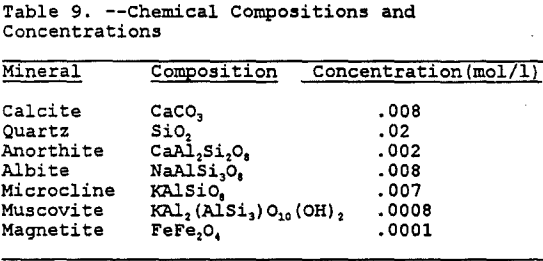
After running MINTEQA2 several times with all or only a few of the minerals in Table 8 present, it was determined that besides calcite, only anorthite seems to provide significant buffering of the PLS. While the silicate minerals will provide buffering, the kinetics of most of these reactions are very slow when compared to the calcite and carbonate reactions (Stollenwerk and Eychaner, 1989). To further simplify the geochemical modeling, quartz, albite, microcline, muscovite, and magnetite were not included in the geochemical modeling.
Geochemical Modeling
The overall problem is very complex, with several separate reactions occurring for each ionic species as the PLS is introduced to the Gila conglomerate. It is not within the scope of any modeling project to account for all of the possible reactions, only those which dominate the overall behavior. Thus, the two processes which were included in the geochemical modeling include precipitation and redox behavior. As was earlier stated, it has been shown that in sites like the one being characterized, the precipitation of metals as the pH increases is the primary cause of retardation of the plume.
Calcite: The concentrations of dissolved metallic constituents in the acidic ground water will be retarded as they migrate through the Gila conglomerate. As the calcite dissolves, the pH of the PLS will rise, which will make the metallic species less soluble and they will precipitate. The total concentration of calcite is 1.5% by weight, but as earlier stated, the amount which will react with the PLS will be a fraction of the total. Thus, to simplify the modeling it will be assumed that 10% of the calcite will react with each passing volume increment of PLS.
The dissolution and precipitation kinetics of calcite has been reported to consist of four separate independent reactions depending upon the pH and Pco2. Thus, depending upon the system, the rate of the calcite dissolution will be dominated by the rate constants k1, k2, k3, or k4 in the Plummer et al., (1979) expression. For the purposes of this model, the dissolution of calcite will be assumed to consist of reactions with CO2 (g) and H+. The reaction with CO2 is:
CaCO3 + CO2 (g) + H2O = Ca²+ + HCO3-
where logKeq = -5.97 at 25C. The reaction can also be written in terms of H+:
CaCO3 + H+ = Ca²+ + HCO3-
where logKeq = 1.85 at 25C.
In this model, the Pco2 is being held constant at 0.01 bar, thus the overall dissolution of calcite in the model will be controlled by the pH of the PLS as it migrates through the Gila conglomerate.
Aluminum: The concentration of the aluminum is also dependent upon the pH of the solution. As the pH increases, the solubility of the aluminum will decrease until a pH of around 7, when the solubility should then begin to increase (Langmuir, 1992). The solubility of aluminum in this system is assumed to be dependent upon the behavior of three aluminum minerals, a basic Al sulfate mineral (AlOHSO4), basaluminite (Al4(OH)10SO4), and gibbsite (Al(OH)3). Other Al minerals could possibly form, and show positive saturation indices (SI) during the MINTEQA2 runs, but once again the assumption is that the kinetics of such minerals forming is not favorable.
Iron: The solubility of iron is, like all of the other contaminants in this study, related to the pH. As the pH rises, the iron will become less soluble and will precipitate. The solubility is not controlled solely by the pH, however, it is also controlled by the redox potential of the ground water. There are a number of minerals which show positive saturation indices in MINTEQA2. Of these, only amorphous ferric hydroxide [Fe(OH)3] has been found to precipitate in the Globe, Arizona site (Stollenwerk and Eychaner, 1989). However, Stollenwerk and Eychaner (Smith, 1991) have determined that there is some difficulty in matching the Keq for amorphous Fe(OH)3 with the ion activity product (IAP) because of the uncertainty presented with the measurement of the Eh.
To determine a more reasonable estimation of the Eh of the system, it was assumed that equilibrium existed between total dissolved Fe and amorphous Fe(OH)3. By maintaining pH and total dissolved Fe at the values measured in the water samples and allowing Eh to vary until equilibrium with Fe(OH)3 was attained and the SI = 0, the Eh value was determined to average about 0.55 volt (Stollenwerk and Eychaner, 1989).
Copper: Copper, like aluminum, precipitates more than one mineral depending upon the pH of the PLS. The minerals identified as possible precipitates are chalcanthite [CuSO4.5H2O], antlerite [Cu3 (SO4) (OH)4, brochantite [Cu4(SO4) (OH)4], and tenorite [CuO] . The sulfate minerals would be expected to precipitate first at the lower pH values. As more of the sulfate is depleted, the precipitation of the sulfate minerals become unfavorable and tenorite will begin to precipitate.
Manganese: Manganese, like iron, is controlled by both pH and Eh. Manganese has been observed to closely follow the acidic front in the Globe site (Lind, 1991, Haschenburger, 1991, and Stollenwerk and Eychaner, 1989). Thus, the manganese stays as soluble Mn²+ and ion pairs over most of the pH range that is encountered in the system. This indicates that the Eh must be used to properly model the behavior of manganese. The mineral which has been identified as a probable precipitate in the conditions of this system is birnessite (MnO2), which to maintain mobility should not begin to precipitate until the solution is almost completely neutral, as was the case with the iron system.
MINTEQA2
MINTEQA2 (Allison, et al., 1991) is a geochemical equilibrium speciation model capable of computing equilibria among the dissolved, adsorbed, solid, and gas phases in an environmental setting. MINTEQA2 includes an extensive database of reliable thermodynamic data which is also accessible to PRODEFA2. PRODEFA2 is an interactive program which is designed to be executed prior to MINTEQA2 for the purpose of creating the required MINTEQA2 input file.
The data required for MINTEQA2 to predict the equilibrium composition consists of a chemical analysis of the sample to be modeled giving total dissolved concentrations for the components of interest and any other relevant invariant measurements for the system of interest, including pH, pE, or the partial pressures of one or more gases. A measured value of pH and/or pE may be specified or MINTEQA2 can calculate equilibrium values. Also, a mineral may be specified as presumed present at equilibrium, but subject to dissolution if equilibrium conditions warrant, or definitely present at equilibrium and not subject to complete dissolution.
The primary advantage of MINTEQA2 is the flexibility it gives to the user. By using MINTEQA2, the user is allowed to solve a variety of environmental problems involving aqueous and solid phases, redox, and adsorption. The only disadvantage with using MINTEQA2 is that since it is an equilibrium model it will not take kinetics into account. Thus, the user must carefully scrutinize the inputs and use care when examining the results to take into account kinetic constraints.
Results
To estimate the rate constants, the change in solution conditions over the expected range of pH values must be determined. Initially the solution composition is as shown in Table 6, then as the solution reacts with the calcite and anorthite, the pH will rise. By setting the pH for each increment, the relative depletion, and the mineral phases present were determined. The solution composition after equilibration at each pH then becomes the influent concentration for the next iteration with an increase of 0.25 pH. By using this stepwise process, which is similar to using the sweep function present in MINTEQA2, the solubility behavior of the solution can be determined. As can be seen in Figure 6, as the pH increases, the total dissolved concentrations of aluminum, iron, manganese, and copper decreases. The iron shows the greatest change in solubility followed by aluminum, copper, and manganese.
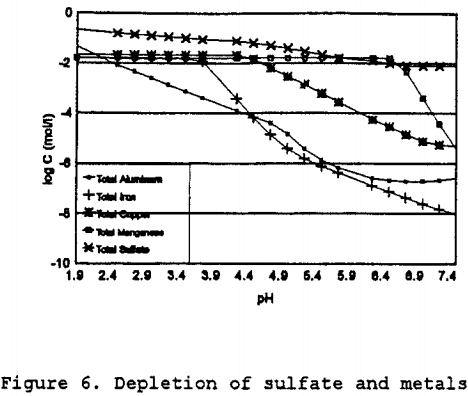
Estimation of Precipitation Rate Constants: After determining the behavior of the species of interest over the range of pH values which could be observed, the next step was to determine what the pH values would be in each of the segments which are to be modeled. This was accomplished by first entering the concentrations from Table 7 into MINTEQA2 along with the concentrations of calcite and anorthite and letting the program determine the equilibrium pH for each segment.
Once again the results of each iteration contained the solution conditions for the next iteration, thus allowing the determination of rate constants for each segment. The first iteration of rate constants will not be exactly accurate in that the time considered will only be the amount of time it takes water to filter through one volume increment of Gila conglomerate neglecting dispersion and other attenuating variables. Each segment is then approximated to be 33.3 cm in depth. The 33.3 cm is determined by first assuming that the porosity of the Gila conglomerate is 0.30 (Stollenwerk and Eychaner, 1989). It then takes 3.3 volumes of Gila conglomerate with a porosity of 30% to absorb one volume of PLS, or one liter of PLS and 3.33 liter of Gila conglomerate. The Gila conglomerate is in increments of one cubic liter. Assume that this volume increment of one liter can be described by a cube with equal dimensions of 10 cm. Thus, if 3.33 liter of Gila conglomerate are being used to accommodate one liter of PLS, the depth of infiltration of one unit volume of PLS is 3.33 x 10 cm = 33.3 cm. The 33.3 cm depth then becomes the initial thickness of each segment.
The hydraulic conductivity of the Gila conglomerate varies, depending upon the depth of the sample, and upon whether the sample is fractured or unfractured. The saturated horizontal hydraulic conductivity ranges between 0.084 to 1.34 m/day (Bechtel, 1981) with the lower reading coming from a deep unfractured sample and the higher reading coming from a fractured surface sample. The vertical hydraulic conductivity has been reported to be one or two orders of magnitude less that the horizontal value (Hydro Geo Chem, 1989). Thus, the initial value chosen for the hydraulic conductivity is 0.1 m/day. Assuming that the change in the piezometric head is equal to the travel distance, thus the hydraulic gradient can be assumed to equal unity. It can be shown using Darcy’s Law that the time it takes for the PLS to migrate through the Gila conglomerate is proportional to the hydraulic conductivity. Thus, it would take approximately 3.33 days for water to filter through each segment.
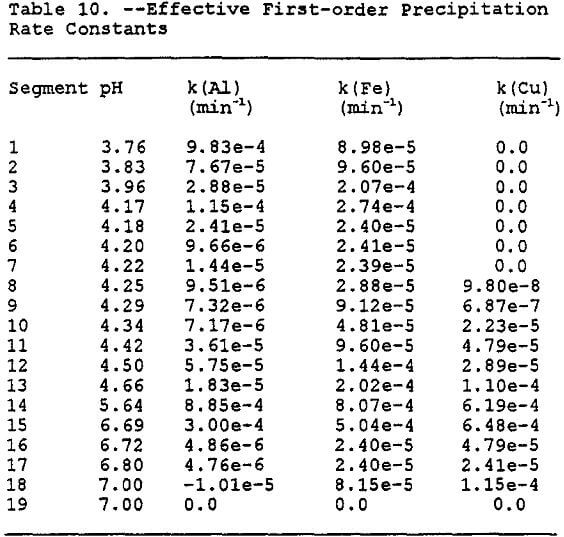
The effective first-order precipitation rate constants can be determined using the simple expression for a effective first-order reaction:
![]()
where k(i) is the effective first-order rate constant for precipitation of species i. These values for each segment and species are tabulated in Table 10.
The Gila conglomerate has been shown in column experiments to be a good neutralizing agent (Stollenwerk and Eychaner, 1987) and those results have been reproduced using MINTEQA2. The data produced by the simulation favorably compares with data for acidic and neutralized ground water at the Globe site in Arizona Eychaner, 1989) (The data presented by Eychaner (1989) is for both alluvium and Gila conglomerate. The alluvium has different physical and chemical properties than the Gila conglomerate and thus the data is useful for a rough estimate only.)
By assuming only precipitation as the removing agent, each volume increment of PLS would need approximately 19 segments of Gila conglomerate to be neutralized as shown in Table 9. If you take the 19 segments, which contain 3.3 volume increments, the approximate volume of Gila conglomerate it would take to neutralize one volume increment of PLS can be shown to be 19 x 3.3 = 62.7 volume increments. Thus, as a rough estimate, it would take approximately 63 volume increments to neutralize one volume increment of PLS. In other words, it would take approximately 63 liters of Gila conglomerate to neutralize one liter of PLS. Using the rate constants in Table 10 and incorporating them into the transport code SWMS 2D, the concentration decrease of the dissolved metals will be modeled in the next section.
Modeling Solute Transport in the Unsaturated Gila Conglomerate
Until recently, the study of the vadose zone by hydrogeologists has been very cursory in nature. Historically, soil scientists studied the vadose zone as they were concerned with the flow of solutes and water to plant roots. Lately, hydrogeologists have shown more interest in the fate and transport of contaminants in the vadose zone. This is a result of increased interest in remediation efforts and ground water protection. Only recently have multi-discipline scientific efforts taken into account the synergistic effects of the various physical, chemical, and biological processes occurring within the vadose zone.
The Vadose Zone
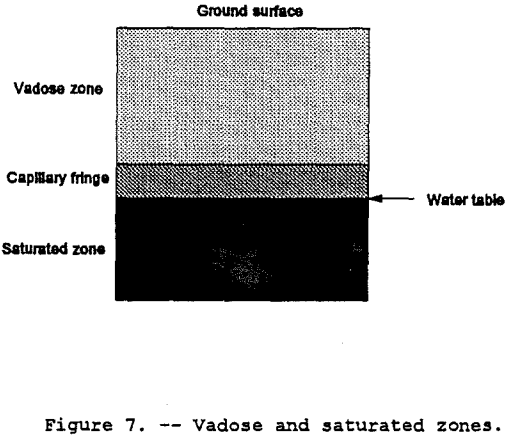
In a vertical geologic cross-section, the vadose or unsaturated zone is that band bounded by a top-soil surface and the top of the water table (refer to figure 7). The vadose zone differs from the saturated zone because the vadose zone contains air in some voids or pore spaces. Pore spaces are only capable of containing a fluid, air or water or both and possibly immiscible fluids. This presence of pore space air has a direct impact on the hydraulic properties of a porous formation. The lower portion of the vadose zone consists of a band referred to as the capillary fringe. This fringe is caused by liquid surface-tension pulling moisture up from the saturated zone. A review of the concepts relating pore-space air and moisture content to hydraulic conductivity is contained in the following sections.
Review of Concepts
The driving force for groundwater flow in the saturated zone is the pore water pressure combined with the elevation head. In the vadose zone, the driving force consists of the matric potential and the elevation head. The matric potential or capillary potential is negative pressure caused by surface tension. As stated by Hillel (1982), it is the physical affinity of water to soil particle surfaces and capillary pores. Water drawn from where thicker hydration surrounds the particles to where hydration is thinner and from a zone where the capillary menisci are less curved to where they are more highly curved. This driving force in the vadose zone is greatest at the wetting front — thousands of times greater than the gravitational force. In figure 7, the wetting front is the upper edge of the capillary fringe. Another way to picture the wetting front is the leading edge of a horizontal contaminant plume where the liquid is beginning to replace the pore-space air.
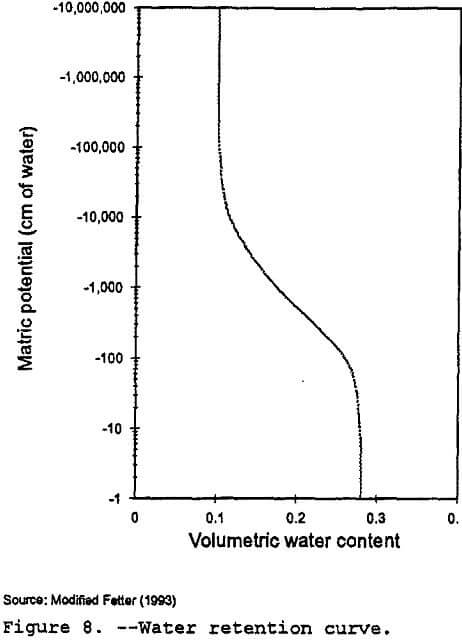
Matric Potential: The matric potential or pressure head is a function of the volumetric moisture content of the soil. The volumetric moisture content varies between zero and the porosity value of the soil. The lower the moisture content, the more negative the matric potential becomes. However, van Genuchten (1991) states that the moisture content should not be equated to the porosity of the soil because the saturated moisture content of field soils is generally 5 to 10% smaller than the porosity due to entrapped or dissolved air. The volumetric moisture content is the volume of water per total soil volume. Degree of saturation is the ratio of the water volume to the void volume. Porosity is equal to one minus the solid volume fraction.
Soil-Moisture Retention Curve: The relationship between the volumetric moisture content and the pressure head in the vadose zone is called the soil-moisture retention curve or the moisture characteristic curve. These curves take on different shapes depending on whether the soil is being saturated (wetting curve) or desaturated (drying curve). This difference between wetting and drying curves is called the hysteresis effect. It is due in part to entrapped air in the soil after wetting (Butters et al.,1989).
Hydraulic Conductivity: The most important difference between the saturated and vadose zones is in the hydraulic conductivity which is dependent on the moisture content. As soils desaturate, pores become filled with air reducing the conductive water portion of the soil’s cross-sectional area. In addition, suction pulling on the water further reduces the water conducting pore area. This increases tortuosity — the ratio of direct water-flow-length to actual water-path-length — which increases the distance that water must travel. The transition from saturation to unsaturation generally involves a sharp drop in hydraulic conductivity, which may decrease by several orders of magnitude (sometimes down to 1/100,000 of its saturation value as suction increases from 0 to 1 bar) (Hillel, 1982).
Modeling Mass Transport In The Vadose Zone
Modeling mass transport in the vadose zone is in many ways just beginning to evolve from the theoretical realm to field calibration and verification. Many different models have been proposed for modeling mass transport in the vadose zone. Butters et al. (1989) have organized transport models into the following three groups: (a) convection-dispersion equation models with constant coefficients (deterministic), (b) convection-dispersion equation models with random variable coefficients (stochastic), and (c) transfer function models.
Major assumptions in many of these models include the following (Nielsen, 1990):
- Equilibrium versus nonequilibrium sorption.
- Steady-state flow and hysteresis.
- Magnitude of anisotropy in the hydraulic conductivity.
- Use of adsorption isotherms.
The starting point for developing the mass transport equations to model the transport of solute is the conservation of mass equation, which in words is (Domenico and Schwartz, 1990):
mass inflow rate – mass outflow rate ± mass production rate = change in mass storage with time
There are three mechanisms, when incorporated into the mass-balance equation, that determine the solute transport in both saturated and unsaturated soil systems. These are (a) advective transport, in which the dissolved solutes are transported with the flowing water, (b) hydrodynamic dispersion, in which the molecules are transported by molecular diffusion or through the effects of mechanical dispersion, and (c) the effects of reactions, sources, or sinks, including the effects of dilution, radioactive decay, biological activity, sorption, as well as chemical reactions like precipitation or dissolution reactions. These three mechanisms when incorporated into the mass balance give the advection-dispersion equation, which for saturated conditions can be written as (Domenico and Schwartz, 1990):
![]()
where
Ci = concentration of chemical constituent, mg/l,
t = time, sec,
∇ = gradient operator, d/dx + d/dy + d/dz, l/cm,
Dh = hydrodynamic dispersion, cm²/sec,
ri = reaction terms for solute i, moles/l/sec,
v = fluid velocity vector, cm/sec,
∅ = porosity, unitless.
In the unsaturated zone, the controlling parameter is the moisture content θ. The moisture content is the ratio of the volume of water to the total volume in a representative soil sample. The governing flow equation for describing water flow in unsaturated soil is the Richards’ equation, which relates the moisture content to the unsaturated hydraulic conductivity. The equation is represented by the following equation after Fetter (1993):
![]()
where
Ψ = matric potential,
K = unsaturated hydraulic conductivity function, cm/sec,
z = elevation above reference plane
Combining the advective-dispersive and the Richards equation leads to an advective-dispersive mass balance that describes the flow of solute in the unsaturated zone that can be written as (Healy, 1990):
![]()
These equations are the fundamental starting equations that are then solved depending upon the conditions of each simulated transport problem. Further detailed numerical derivation of the actual mathematical expressions used to represent this problem and complete discussion of all the parameters are beyond the scope of this report, but can be found in the manuals’ for the computer codes (Simunek, et al., 1992 and Healy, 1990) as well as in many text books (Domenico and Schwartz, 1990 and Bear, 1972).
Computer Codes
RETC: The RETC code (Van Genuchten et al., 1991) is a numerical code that can be used to quantify the hydraulic parameters for unsaturated soils. The program can be used to fit several analytical models to observed water retention or unsaturated hydraulic conductivity data. Using models developed by van Genuchten (1980), Brooks and Corey (1966), Burdine (1953), and Mualem (1976), RETC can generate water retention curves from soil water retention data and predict the unsaturated hydraulic conductivity from soil water retention data. As noted by Wosten and Van Genuchten (1988), predictive models such as RETC can provide accurate estimates for characterizing the hydraulic properties at a generic site.
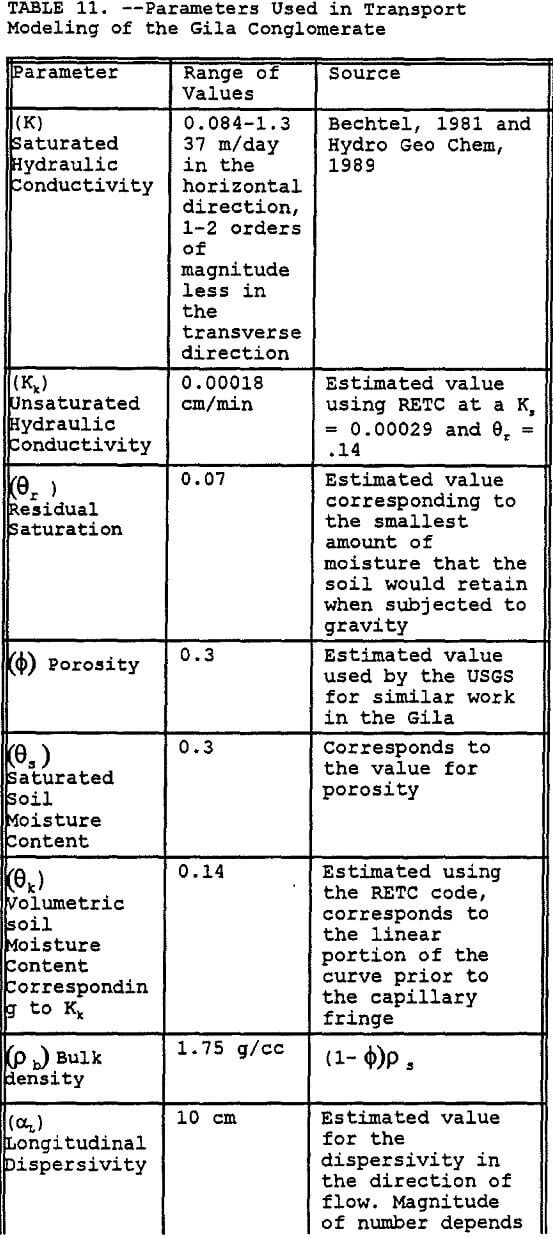
In order to generate a water retention curve similar to Figure 8, RETC used the saturated hydraulic conductivity and moisture content listed in Table 10. Since field data on the Gila conglomerate was not available, data from the Las Cruces trench site in New Mexico (Wierenga et al., 1989) was used as starting values for the van Genucthen shape factors used by the RETC program. The program generated values for the unsaturated hydraulic conductivity and the pressure head or matric potential for various moisture content values.
SWMS 2D: The SWMS 2D computer code simulates the flow of solute and water in two-dimensional variably saturated media. The program numerically solves Richards Equation for saturated and unsaturated water flow and the advection dispersion equation for solute transport. The water flow equation includes provisions for internal and external sinks and sources, including root water uptake. The solute transport equation also allows the use of zero and first order production or decay as well as sorption assuming a linear isotherm. The flow region itself can be composed of many different layers of soil each, layer having unique parameters unrelated to the other layers. The water flow portion of the model will allow for the specification of either Dirichlet, Neumann, or Cauchy boundary conditions as well as boundaries controlled by atmospheric conditions.
Modeling the Gila Conglomerate
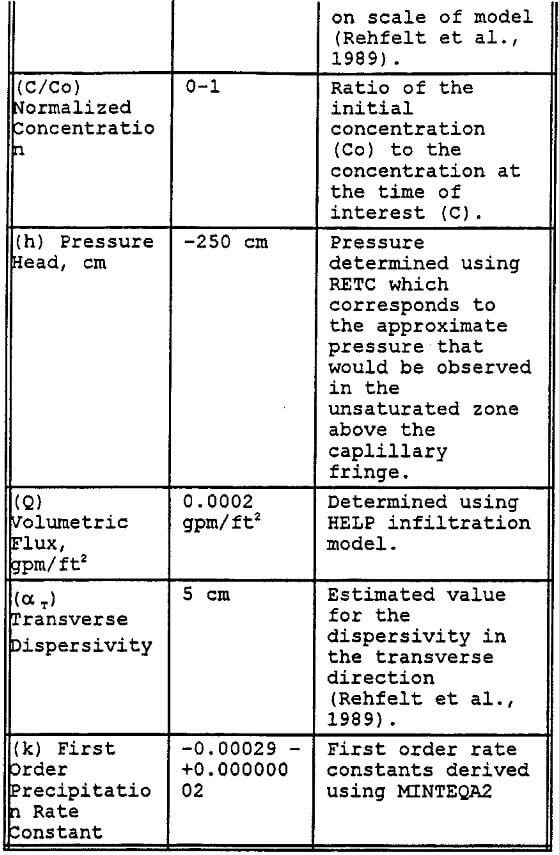
Preliminary modeling was done using the SWMS 2D code to model a thin two dimensional column of simulated Gila Conglomerate using the results of the RETC simulation for unsaturated soil hydraulic parameters, results of the MINTEQA2 simulations for first order precipitation rate constant, and previously reported hydraulic properties. Key parameters used in this model are listed in Table 11. The major assumptions used in this modeling effort include the following:
- The geologic profile is initially uncontaminated.
- The leachate is applied in one continuous 90 day cycle.
- No sorptive reactions.
- Vertical hydraulic conductivity is two orders-of-magnitude less than the horizontal hydraulic conductivity.
- Percent calcite for the Gila conglomerate is 1.5%.
- Dispersivities are dependent upon the scale of the modeling effort.
The simulation was done by modeling the transport of the leachate components Al and Cu through a column of one cm thickness and 6-m depth. The sides of the column are set to be impermeable, thus allowing only vertical transport of the contaminant of concern. The column was divided into 19 different layers of Gila conglomerate each having a different effective precipitation rate constant that was derived using MINTEQA2. In addition, the hydraulic conductivity of each segment in the column decreases by a small increment to account for the potential blockage of pores by the precipitation of gypsum and other minerals (Sanchez Copper, 1992, and Van Zyl, 1993).
Results
The results indicate that the dissolved aluminum in the leachate as predicted by the geochemical modeling, exhibit a dramatic initial concentration decrease, followed by a more gradual decrease as the solution is buffered toward neutrality. The copper did not experience a major decrease in dissolved concentration until the plume was deeper into the Gila conglomerate.
Aluminum: The simulation was done for a specified-volumetric flux (figure 9). Figure 9 shows the preliminary results of the modeling effort by plotting the normalized concentration versus depth for 100 to 400 days after initial application of the 90 day pulse of leachate.
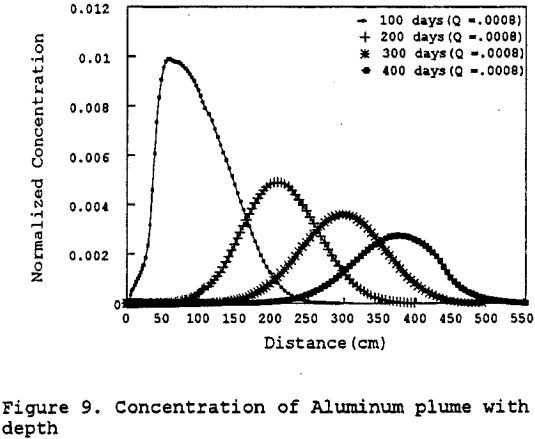
As the leachate solution infiltrates into the Gila conglomerate the maximum concentration decreases as a result of dispersion and precipitation. Thus by specifying the rate of the precipitation, it can be observed that the majority of the aluminum will precipitate out of solution in the upper portion of the test column. After this initial large decrease, the decrease in the dissolved aluminum concentration is much more gradual for the remainder of the simulation. The data indicate that the leachate infiltrates the Gila conglomerate at a very slow rate, about 0.5 to 1.0 cm per day.
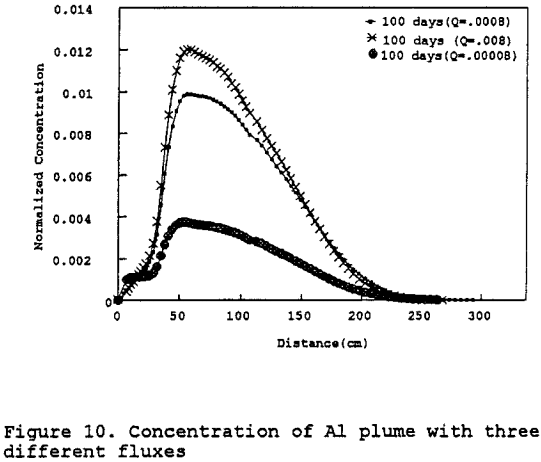
Figure 10 represents a sensitivity analysis done on the leachate mass flux into the test column. The sensitivity analysis indicates that the controlling parameter is the hydraulic conductivity as earlier stated — not the leachate mass flux. Therefore, if more of the leachate were to leak through the pad potentially contacting the Gila conglomerate, it would not further contaminate the Gila conglomerate due to the low permeability of the Gila conglomerate.
Copper: The model was also run using the same parameters as indicated in Table 10, except for copper precipitation rate constants. Figure 11 shows that after the first four hundred days of contact the concentration of copper is reduced only by the effects of dispersion. This behavior correlates with the behavior observed in the geochemical modeling portion of this project which predicted that the copper would not be appreciably precipitated out of solution until the pH of the leachate was greater than 4.25, which does not occur until approximately 10 segments into the test column, or 333 cm. A sensitivity analysis was also done to demonstrate that the concentration of copper would not increase appreciably even if the mass flux were to increase by an order of magnitude (figure 12).
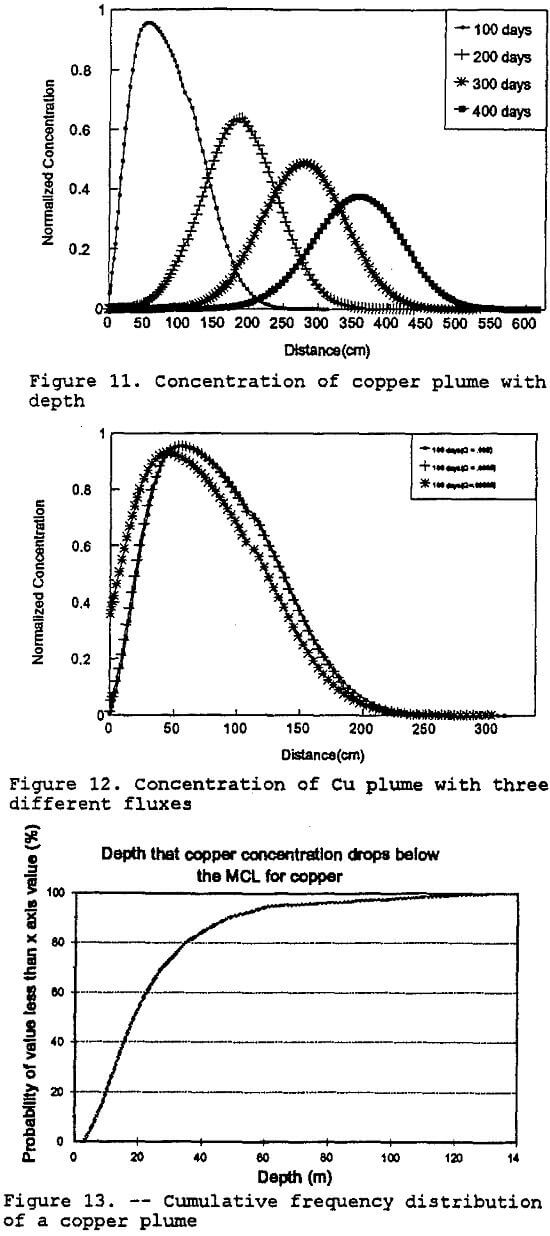
Monte Carlo Simulation of Copper: In order to demonstrate the methodology addressing parameter uncertainty as discussed in this paper, an abbreviated simulation was done in the following manner. A Monte Carlo simulation (100 iterations) using a lognormal distribution generated a PDF for the unsaturated hydraulic conductivity. The PDF was generated using the RISK program (RISK, 1992) as previously discussed in the parameter uncertainty analysis section of this paper. Fifteen random hydraulic-conductivity values were taken from the PDF curve and used for fifteen different runs of the transport model. The outputs from the transport model runs were used to produce a cumulative distribution curve of contaminant concentration with depth. Figure 13 shows the cumulative frequency distribution for the depth at which the solute copper concentrations drop below the proposed maximum contaminant level (MCL) for copper. The MCL for copper is 1,300 ug/l (Fetter, 1993). The expected value generated for this simulation is 25 meters, suggesting that the copper concentration drops below the MCL at that depth. Further simulations will examine the other inorganic contaminants modeled with the geochemical model.
Conclusions
This report is a trail blazing effort to lay out an integrated, inter-discipline methodology for determining the potential of copper dump-leaching operations (or any other type of leachate producing operation such as landfills) to pollute an aquifer. Therefore the results should be considered preliminary in nature. Use of this methodology for site-specific evaluation requires actual field data, model calibration, and model validation.
The methodology presented in this paper included a combination of models for simulating the movement of pregnant leach solution from the surface of a copper dump-leach operation into the unsaturated base material and the geochemical processes occurring as the solution moves through the unsaturated zone. Only precipitation was modeled for this paper. Additional modeling could examine ion exchange, oxidation-reduction, complexation, and sorption (van der Heijde and Elnawawy, 1993). The uncertainty of hydrogeologic parameters such as hydraulic conductivity were addressed by using probability distribution functions. The spatial variability of hydrogeologic parameters was not discussed in this paper. Techniques such as geostatistics could be used to address spatial variability (Journel, 1989; Freidel, 1993; Freeze, et al., 1990).
The geochemical model showed that the Gila conglomerate is a good neutralizer of the PLS. The model generated effective precipitation rate constants for use in the vadose zone model. The vadose zone model indicated that the aluminum concentration decreased rapidly as a result of advection, dispersion, and precipitation within the first 500 cm. The copper concentration decreased initially as a result of advection and dispersion and began to decrease after 350 cm as a result of precipitation.
The vadose zone model did not reflect the potential blocking of pores by gypsum deposition (product of calcite in the Gila conglomerate reacting with the acidic PLS) over the life of the property which reduces the porosity and hydraulic conductivity of the Gila conglomerate. In addition, the modeling effort did not account for scale effect on the horizontal dispersion coefficient where the dispersion coefficient may increase 4-6 orders of magnitude from the lab scale to the field scale (EPA, 1989) nor does it account for any horizontal movement within the aquifer to a compliance point, all of which world further reduce the heavy metal concentrations.
The overall intent of this paper was to demonstrate a scientific method for determining the risk to human health from copper-dump leach operations. The methodology presented provides means for presenting more realistic data for decision-makers as opposed to worst-case data.
By reducing the variance (uncertainty) of each parameter, the decision-maker can produce modeling results that are more realistic and useful. This will allow decision-makers the flexibility to compensate for the potential application of overly conservative estimates of risk using standard Environmental Protection Agency methods. Mine operator may consider using this methodology in the permitting process to evaluate various design alternatives or in the environmental auditing process to evaluate potential risks.
Acknowledgments
We want to thank Dr. Dirk Van Zyl of Golder Associates, Inc., Dr. Helen Dawson of the Colorado School of Mines, John Davis of the USBM Branch of Minerals Availability, Len Rothfeld of the USBM Minerals Availability Field Office, and Mike Friedel of the USBM Twin Cities Research Center for their guidance and technical assistance.
