Table of Contents
Interest in the separation, purification, reduction, and metallurgy of the various lanthanide rare-earth elements has necessitated developing sensitive and flexible instrument-analysis techniques . The widely accepted analytical application of the spectrograph in many phases of metallurgy suggested its use in the analysis of complex rare-earth elements. Moreover, by using an optimum internal standard and a favorable buffer, the analysis of samples having wide matric variations should be possible.
Literature concerning spectrographs analysis of rare-earth elements is extensive. A 1935 publication by Bauer describes what may have been the first published attempt at a quantitative spectrographic analysis of rare-earth elements, McCarty, Scribner, et al, in 1938 described the use of magnesium oxide and, more successfully, zirconium oxide as internal standards when numerous ores were analyzed for yttrium, neodymium, samarium, gadolinium, lanthanum, dysprosium, and ytterbium. A successful but time-consuming multiple-electrode technique for the determination of europium in samarium was published by Gatterer and Junkes. The sensitivities claimed in “copper spark” methods sound promising but have been found difficult to interpret and to reproduce in complex matrices. Although used subordinately to molybdenum, lanthanum was perhaps first used as an internal standard for gadolinium in samarium by Lopez de Azcona who presented an extensive publication in 1941 that included tables of persistent rare-earth lines and a sequential listing of the wavelengths of sensitive rare-earth lines. He used aluminum and magnesium oxide as buffers; however, Fassel criticized their use as not fulfilling the requirements of a true buffer. McClelland used a 4-ampere a.-c. source and chemical preconcentration with iron as the internal standard. Smith and Wiggins published a very useful line-sensitivity study describing a simple technique for suppressing bothersome CN bands by displacing atmospheric nitrogen with steam.
One of the most successful attempts at analyzing rare-earth elements with the spectrograph was by Fassel and his various coworkers as reported in four publications from 1948 to 1955. They demonstrated that the judicious use of rare-earth-element internal standardization in simple rare-earth-element systems gave excellent results with low deviations. A similar approach seemed desirable in developing a method for analysis of rare-earth elements in any system. The desirability of an economical, high purity, rare-earth oxide with a relatively simple spectra suggested the choice of lanthanum for the major-constituent internal standard.
This report describes the method developed using lanthanum as an internal standard and a lead-sulfate-graphite mixture as a stabilization buffer. The method is used daily in this laboratory for the analysis of any high-purity rare-earth element for all rare-earth elements. It is also used for analyzing variable matrix rare-earth-element mixtures as well as rare-earth ores and concentrates.
Analytical Apparatus
The basic instrument was a Jarrell-Ash Wadsworth 3.4 meter spectrograph with a 30,000-line-per-inch grating, which gave a reciprocal linear dispersion of about 2.4 A / mm. in the first order. The power supply was the Jarrell-Ash Varisource JA 4000 with full wave rectification. A 10-percent transmission filter was used to attenuate the light. The photometry was done on a Jarrell-Ash 2300 recording microphotometer.
Selection of Analytical Line Pairs
The optimum analysis line for an individual rare-earth salt matrix can often be found in literature. Matching the excitation potentials is done when feasible. With complex and variable matrices, it is often necessary to have alternate line pairs available, as either or both lines may receive interference from the almost unlimited possibilities arising from the spectra of the various rare-earth elements. At best, the choice of a line pair may be one of several with the least interference. If something is known of the major constituents, as with a visual estimation preanalysis, the best of several line pairs usually can be chosen with the aid of the cataloged interferences.
For any particular matrix, line pairs that are essentially free of interference can often be picked. If interferences do exist, there is occasionally a fortuitous coincidence of interference on both the analysis and internal-standard lines, which gives an approximately equal effect. An example of this is the line pair Pr 4408.84/La 4432.95, wherein approximately equal interferences result from cerium lines 4408.87 and 4432.92. Synthetic mixtures can be prepared and analyzed to aid in the determination of the best line pairs for complex matrices.
Choice of Internal Standard and Stabilization Buffer
It has been amply demonstrated by numerous investigators that as a result of similar volatilization and excitation properties the optimum internal standard for a rare-earth element is another rare-earth element. The most obvious application is that of analyzing a high-purity rare-earth element for its rare-earth-element impurities by using it as a self internal standard. This report is primarily concerned with the problem of multiple rare-earth-element-matrix analysis, although the method developed is also applicable to “pure” rare-earth-element analysis.
Using a rare-earth element in constant major percentage for the internal standard has the advantage of providing a similar volatilization buffer and precludes the necessity for “exact” predetermination of the standard. Lanthanum oxide is used as the standard at 50-percent level and comprises 5 of the 20 mg. placed in each electrode. The lanthanum is predetermined by whichever of several methods is most convenient for a particular sample. A visual estimation from standard plates has usually proved to be adequate, particularly if the quantity is low, since a small difference in percentage does not affect the intensity of the internal-standard line appreciably at the 50-percent level obtained after appropriate addition. If the value is known to be less than 1 percent, the residual lanthanum can be ignored. The lanthanum content is frequently determined by X-ray spectrometry. A cerium internal-standard method for lanthanum is also available.
Lanthanum has a simpler spectra than most rare-earth elements, and the oxide is readily obtainable in very high purity. Lanthanum oxide has the disadvantage of being very hygroscopic; therefore, it must be reignited frequently and kept in a desiccator.
The efficacy and lasting quality of graphite as a buffer is well established in spectrographs methods. Jaycox has used lead sulfate as an alternate to cupric oxide for the buffer-internal standard. The reason lead sulfate is used as a buffer with refractory metals, such as rare earths, is not so obvious; however, the stabilization effect of lead sulfate suggested its application to rare-earth elements.
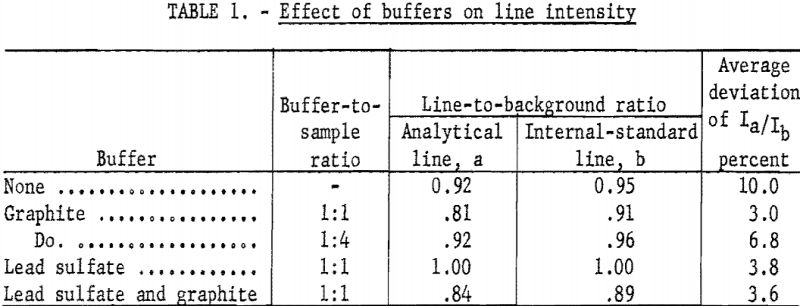
Buffer studies were made using graphite, lead sulfate, both, or no buffer. The respective effectiveness of these combinations was measured in two ways; the line-to-background ratio indicated the sensitivity, and the deviation of line-intensity ratios was used as a measure of the reproducibility. The best sensitivity did not occur with the best reproducibility. The unbuffered rare-earth oxide gave good sensitivity, but the deviation was high. Adding graphite improved the reproducibility but decreased the sensitivity. Using lead sulfate alone resulted in the best sensitivity (highest line-to-background ratio). Lead sulfate mixed with graphite gave better reproducibility while lowering the line-to-background ratio. Since it was felt that the well-established buffering action of graphite would justify a reduction in sensitivity, the mixture of lead sulfate and graphite was used. Data in table 1 summarize the results; each value is the average of quadruplicate exposures.
Time studies showed that for an average sample burn time of about 100 seconds most of the lead was volatilized in about 15 seconds, and essentially all the lead was gone in 25 to 30 seconds. Lack of stabilization early in the burn resulted in appreciable quantities of sample being blown out. Two measures were found to be helpful in minimizing this effect: The burn was initiated at low current (9 amperes) with the electrodes together, followed by a gradual separation and increase in current, so that 20 amperes were attained at the end of the 10-second prearc period; using 5 mg. of lead sulfate in addition to 5 mg. of graphite as a stabilization buffer helped stabilize the arc in the critical heating period. Although the graphite probably helped throughout the burn, the rare-earth elements apparently attained essentially self- stabilization when, sufficiently hot. The time study indicated that the carbon emission increased and the rare-earth emission decreased very sharply at the end of the stabilized period.
Analytical Procedure
Excitation Parameters
The arc is struck at about 9 amperes and is gradually brought to 20 amperes at the end of the 10-second prearc period. With an electrode separation of 2 mm., the potential across the gap has been measured with a high-impedance voltmeter at about 25 volts.
Emulsion Development and Calibration
The Eastman Spectrum Analysis No. 2 plates were chosen because of their relatively flat response gradient between 2,400 and 4,600 A. The use of the Seidel function to straighten the calibration curve involved the plotting of the recommended two-step curves (2, fig. 3). A slight decrease in the slope of the intermediate intensity curves was observed and suggested the intensity-retardation-of-development (IRD) effect. The IRD effect, if present, was minimized by developing the plates for 5 minutes instead of the recommended 3.
Standard and Sample Preparation
Four standard series were prepared, each containing 50 percent La2O3 and and 3 or 4 rare-earth oxides in concentrations ranging from 0.01 to 5.0 percent, with Y2O3, Gd2O3, or Sm2O3 as a secondary diluent. Standards were prepared by combining standard solutions of the individual oxides dissolved in 1:1 HCl and precipitating with a saturated-oxalic-acid solution. The rare-earth oxalates were ignited in an electric muffle furnace for 1 hour at 1,000° C.
To prepare samples for analysis, the concentration of the internal-standard element (lanthanum) is adjusted to 50 percent by adding lanthanum oxide or a suitable diluent, such as yttrium oxide. The following equations are used to calculate the amount of La2O3 to be added to a sample:
A. For samples with less than 50 percent La2O3:
X = 5/1-(.01) (% La2O3 in sample, and Y = 10-X
where X = mg. sample to be used)
Y = La2O3 to be used) for a total of 10 mg.
B. For samples with greater than 50 percent La2O3:
X = 5/(.01) (% La2O3), and Y = 10-X
where X = mg. sample to be used)
Y = mg. Y2O3 to be used) for a total 10 mg.
In both instances the percentage of rare-earth oxide read from the working curve is multiplied by a factor of 10. Ten milligrams of the 50-percent-lanthanum sample is mixed intimately with 10 mg. of graphite-lead sulfate mixture (1:1). If multiple electrodes are desired, a suitable amount may be weighed in the same proportion, ground, and divided approximately equally among electrodes without individual weighings. Pellet-forming graphite is tamped firmly on top of each electrode to carry the arc and to minimize volatilization of the sample during the prearc period.
Preparation of Working Curves and Analysis
The standards or samples are arced in undercut, preformed electrodes, 3/16 inch in diameter and 3/16-inch crater depth, with hemispherically pointed, 3/16-inch-diameter, preformed counterelectrodes. Each electrode is arced for 120 seconds to roughly standardize the background density, although the sample has burned to completion in 60 to 120 seconds, depending on the matrix. The analytical part of the emission is integrated on 2 or 3 Eastman Spectrum Analysis No. 2 (10-inch) plates. The plates are developed in Eastman D-19 for 5 minutes and further processed and dried on the Jarrell-Ash photoprocessor.
After photometry and emulsion calibration, the working curves are plotted on log-log graph paper. Background corrections are made by obtaining an average value of percent transmission from each side of a line, converting to relative intensity, and subtracting from the relative intensity of line plus background. Intensity ratio of analysis line and internal-standard line is plotted versus the percentage of rare-earth oxide.
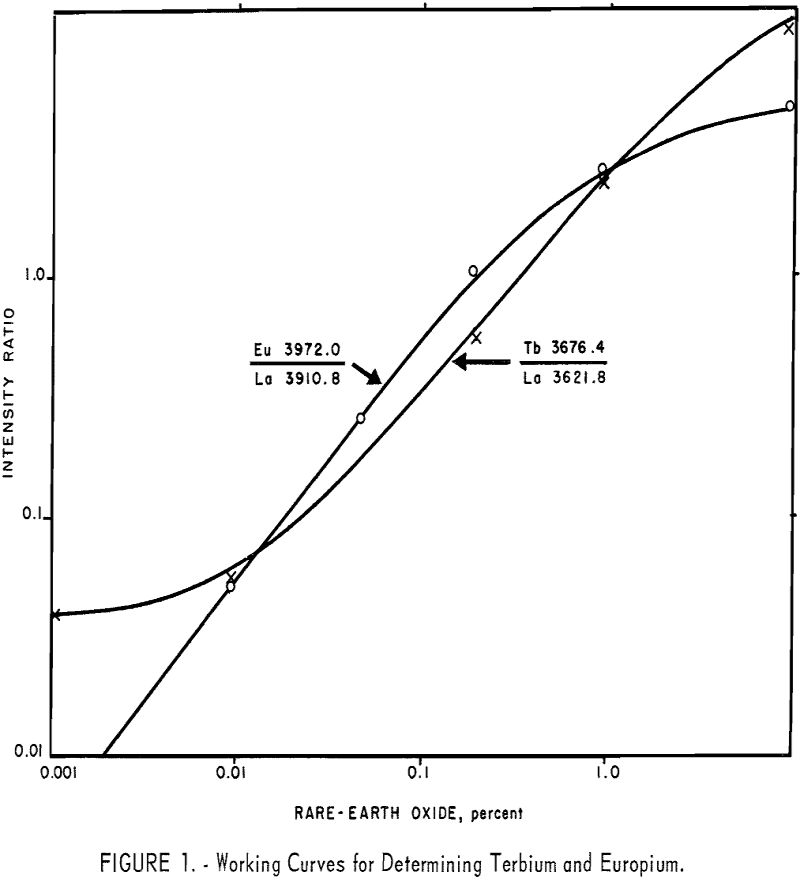
The working curves are prepared on a basis of 10 mg. standards (including 5 mg. of lanthanum oxide); however, adding lanthanum oxide to an essentially lanthanum-free sample, dilutes the sample. Therefore, the sample is half-size (or some fraction, depending on the original lanthanum), and after reading the percentage value from the working curve the result is doubled or appropriately factored. Typical working curves are shown in figure 1. Although all standards are prepared in concentration ranges of 0.01 to 5.0 percent, the sensitivities of all analysis lines do not extend to 0.01 percent. An example of this may be seen in figure 1, in which the terbium 3676.4 A line loses its useful linearity below about 0.02 percent concentration.
Results and Discussion
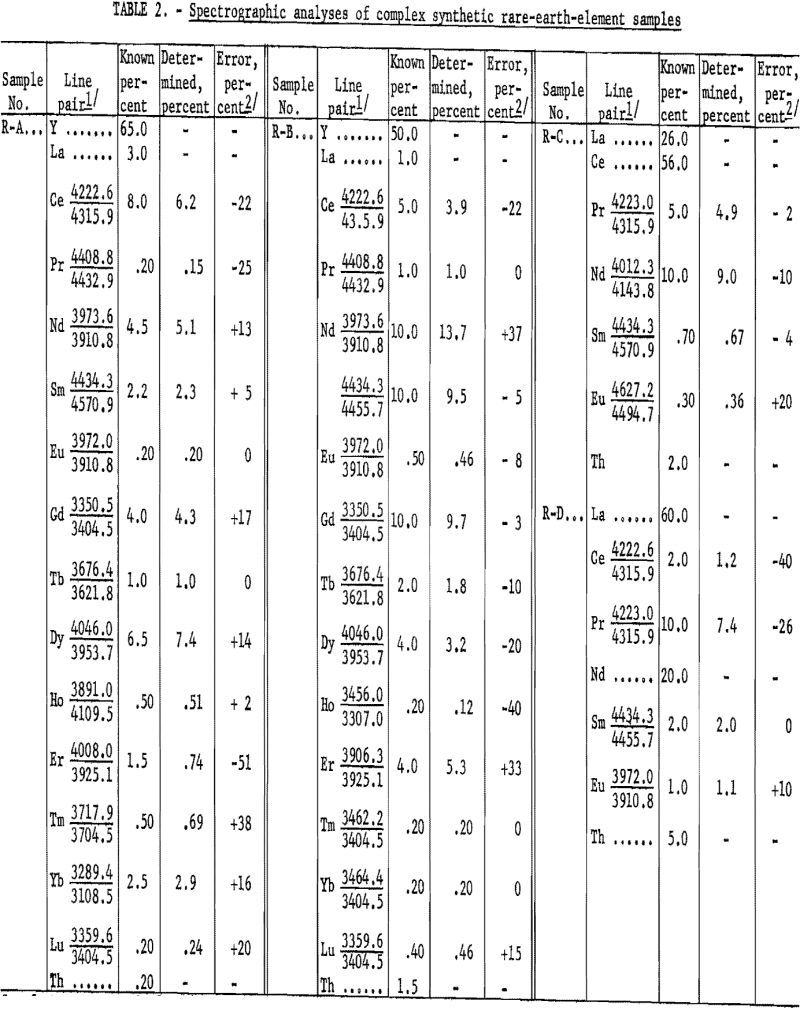
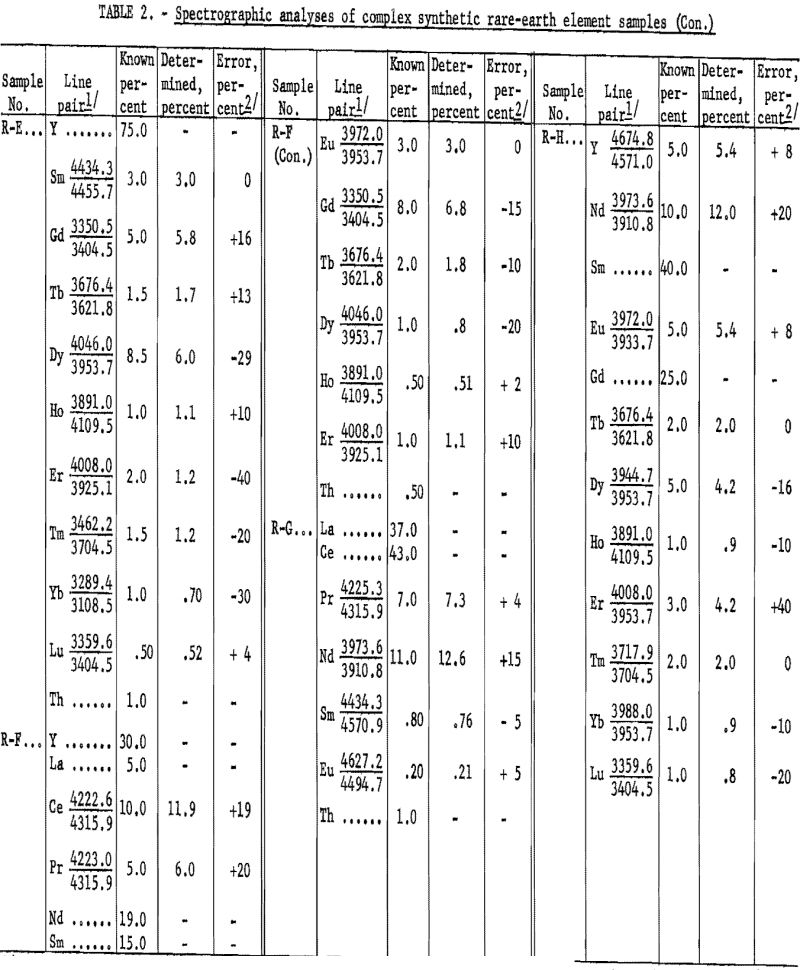
Table 2 shows the analytical results as derived from synthetically prepared rare-earth-oxide mixtures. These samples were prepared to approximate various ore concentrates and concentrate fractions, pertaining to ion exchange and liquid-liquid processing, from bastnaesite and euxenite ores. The analytical results, including individual element-analysis errors, are related to the particular line pair used. The average error was 14.6 percent. Although, on occasion, a slight extrapolation has been observed to be valid (see neodymium in R-G), the procedure usually has been limited to the determination of 10-percent concentration as a maximum. Values above this level can be determined by a preliminary dilution of the sample with, for example, Y2O3.
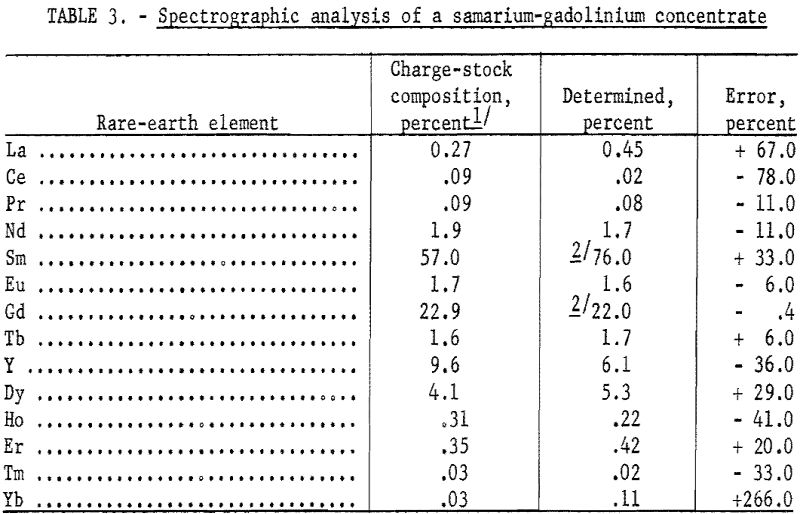
A commercially obtained concentrate used as a charge stock for an ion-exchange column was analyzed, and the results are shown in table 3. The charge stock was used primarily for a source of gadolinium and samarium. The results are compared to the values determined by X-ray analysis of the fractions obtained by ion exchange concentration.
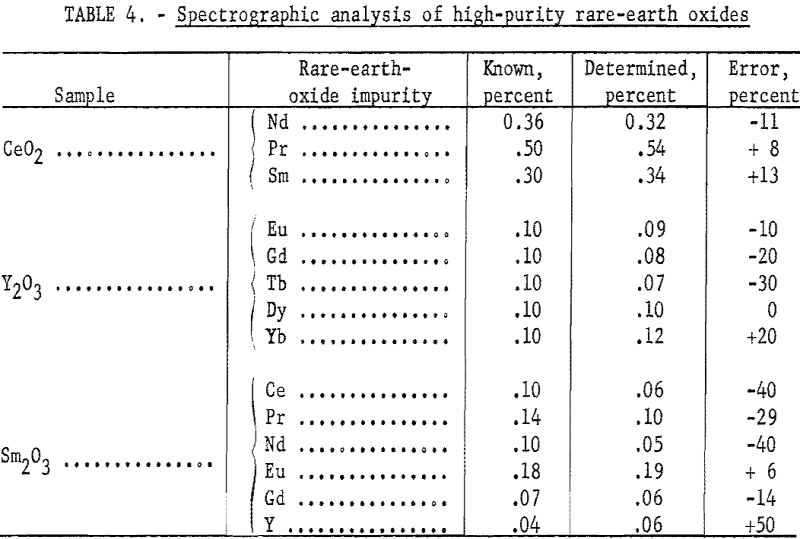
A frequent usage of this method in this laboratory is the analysis of relatively high-purity rare-earth oxides. Table 4 shows results obtained with the method as applied to matrices that are essentially Ce, Y, and Sm. A major advantage of this method, over other instrumental self-primary matrix methods, is the small consumption of expensive rare-earth elements, such as europium and thulium, in preparing standards for their analysis.
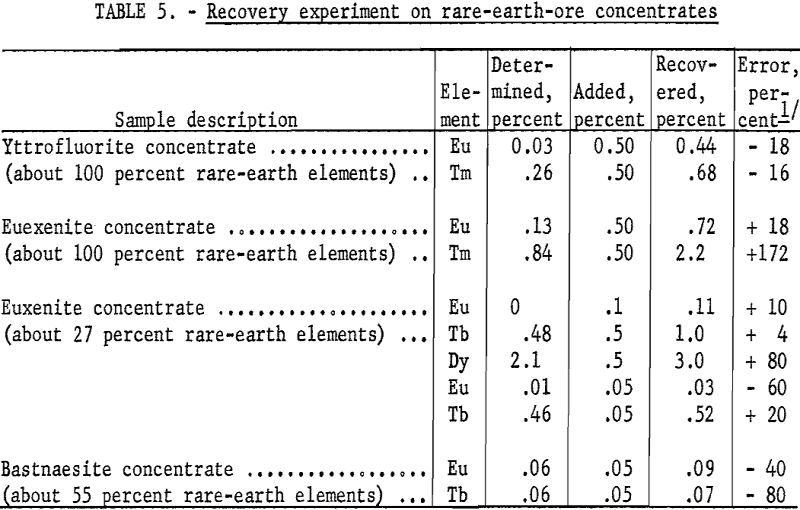
Table 5 gives the results of several recovery experiments in which low-level additions were made to ore concentrates to test the efficacy of the method in ore matrices. Some low-level weighing error is probably inherent in the deviation. These additions, although not added in the same molecular form, show that the method might be useful for evaluating ores and ore concentrates that are not entirely rare-earth-compound in constitution.
The reasons for some of the high deviations obtained in the various analyses are not entirely clear; however, they may be accounted for, in part, by rare-earth-element interference lines and by “less than homologous” line pairs. The quality of the results in variable rare-earth-element matrices is perhaps more operator-dependent than in most spectrographic methods, because interference evaluation is a pervading problem that offers many serious difficulties to exact delineation. The experimental difficulties encountered seem to reflect the inherent insensitivities and extreme complexity of the emission spectra of most rare-earth elements.
The versatility of the method is its main advantage. The sensitivity is comparable to other known spectrographic methods. The lanthanum diluent approach is considered to be most useful as a “first” method in a laboratory concerned with rare-earth-element analysis. Subsequent methods of better sensitivity and accuracy can be developed for analyzing high-purity rare-earth elements by using the major constituent as internal standard. The scarcity of the heavier rare-earth elements in sufficient quantity and purity may limit this approach, in which case the lanthanum method can serve.
