A closed grinding circuit, typified by a ball mill-cyclone combination, is often required to treat a feed comprised of a variety of minerals of differing properties. Usually, the individual behaviour of the minerals is not assessed, a procedure which requires sizing and metal or mineralogical assaying of each size fraction. Further, sizing is frequently by screening to perhaps 325 mesh bearing that detail on the important -44 µm fraction is unavailable.
Experimental Part
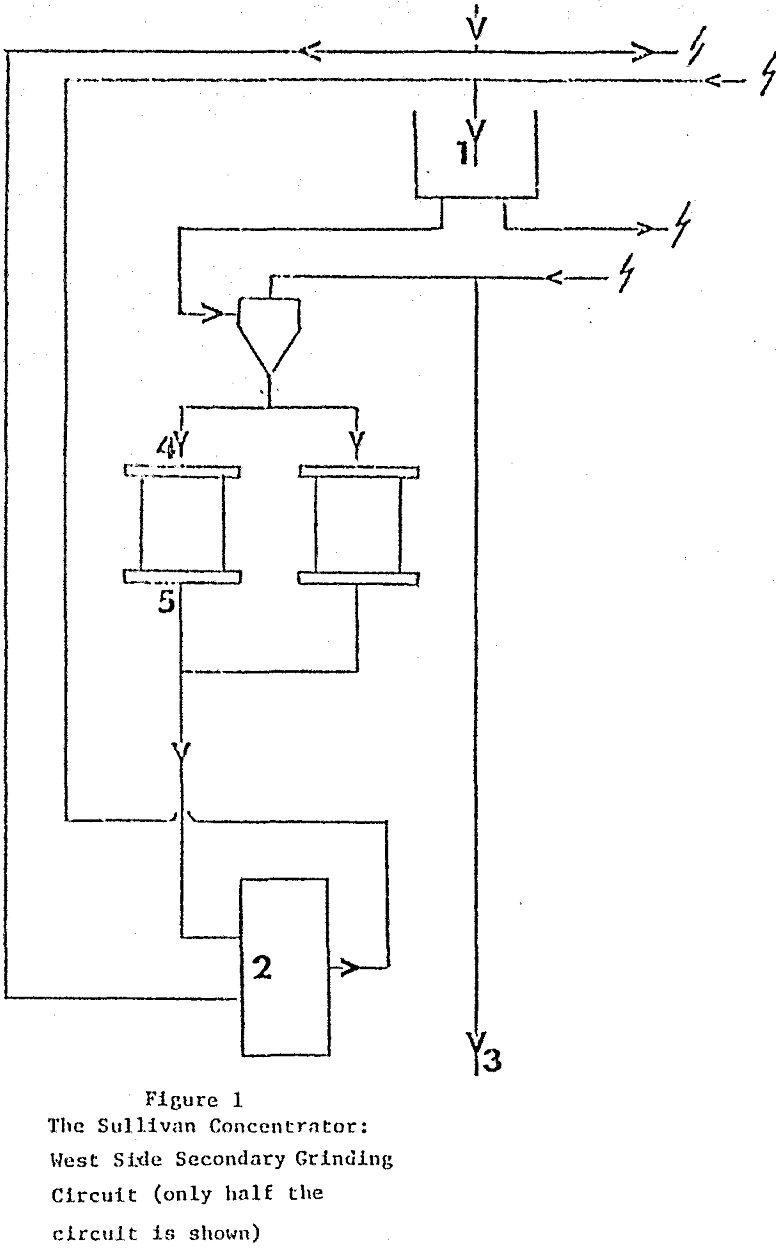
Discharge from a head tank is feed to two parallel clusters of three 20″ cyclones, each cluster being in closed circuit with two parallel 8’x 48″ conical, overflow discharge ball mills. Combined cyclone overflows go to flotation. Fresh feed comprises product from primary grinding and zinc rougher tailings flotation returns.
Sampling points are numbered 1 to 5. Cyclone feed was taken at two points, at the discharge into the head tank and discharge into the pump sump. A combined cyclone overflow sample was taken. Cyclone underflow (and ball mill feed) was taken through a hole cut in the ball mill feed box. Ball mill discharge was sampled at the discharge lip. Samples were cut every 15 mins for 2 hours with conventional hand cutters, except for sampling point 1 where a cut of pipe discharge was taken three times, at the beginning, middle and end of the sampling period.
Results
Silica and calcite/dolomite assays were determined by difference after converting the metal assays to mineral assays. The assay of the finest cyclosizer fraction was determined by difference knowing the combined sample assay. Individual mineral cut-sizes for the cyclosizer fractions were determined from the operating conditions and the mineral specific gravity.
From the available data, overall circulating load could be estimated from the per cent solids assay or the size-weight assay of cyclone overflow, underflow and feed. The latter is considered more reliable . By observing that a balance must exist for the weight of particles of a specific range in settling velocity entering and exiting the classifier, then the cyclosizer fraction-weight assays can be included in this method of CL estimation. The ingredient balance is:-

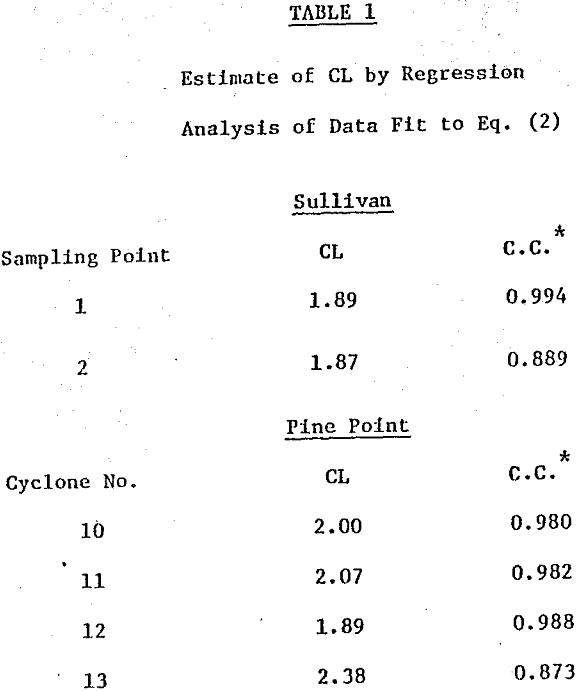
A plot of (u w, i – f w, i) as the abscissa and (f w, i – o w, i) as the ordinate should be linear, pass through the origin and yield a slope equal to CL. This is illustrated for the Sullivan data in Fig. 3 for both cyclone feed sampling points 1 and 2. A regression analysis was performed on the data to yield an estimate of circulating load and a correlation coefficient to indicate the fit to Eq. (2). The results are summarized in Table 1 for both circuits.
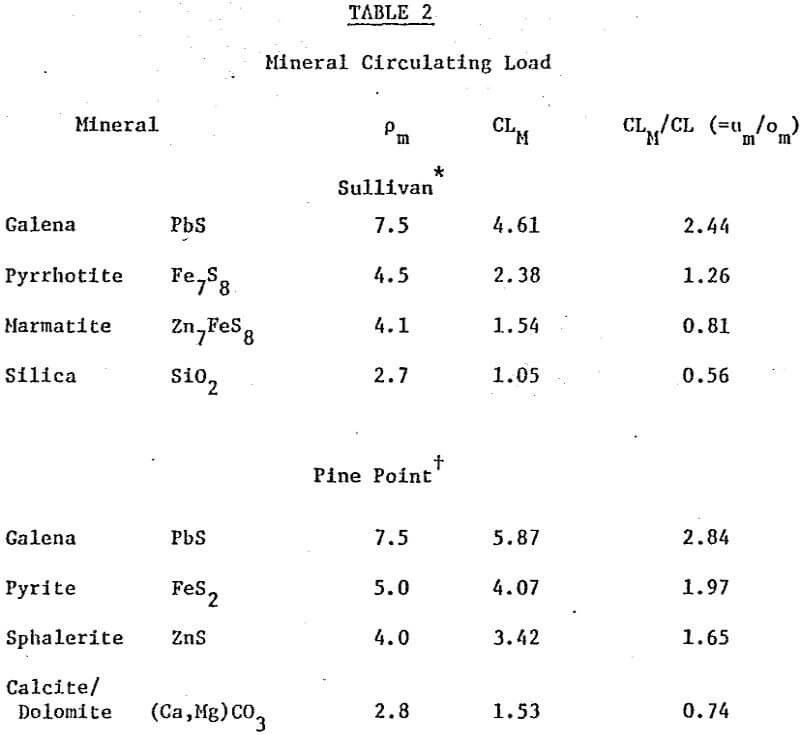
CLM can be estimated from the overall circulating load and the mineral assay for cyclone overflow and underflow:-
CLM = um/om · CL…………………………………………………..(3)
A classifier cyclone performance curve is a plot of Y vs d, where Y is the weight fraction of feed of size d reporting to the underflow.
The performance curves are parallel and lie to finer sizes with increasing mineral specific gravity. With decreasing particle size, the curves appear to display a discontinuity at a d such that Ym is constant for finer sizes. That is, Ym reaches a limiting value, given the symbol am. The location of the discontinuity is dependent on the mineral type, occurring at coarser sizes with decreasing mineral specific gravity.
Discussion
An attempt was made to provide a statement of data reliability. The size-weight assays are examined by the regression analysis of the CL estimate. The size-mineral assays are examined for the Sullivan circuit by comparing the α-adjusted and reconstituted feed methods of performance curve calculation; the similarity at tests to the minor adjustments required to strike a balance.
A possible generalized form of the performance curve is:-
Y = Y’ (1 – a – b) + a
where Y’ = 1 – exp [-0.693 (d/d50(c)n]
It is understood that the same equations can be written in terms of Ym and Y’m.
Following is a comparison of present results with previous observations on CLM, a, b, d50(c), and n.
(1) CLM increases with pm. This was clearly shown by Kelsall et al. and is also demonstrated here. The observation is in accord with cyclone theory. Comparing the magnitude of CLM, or even CLM/CL for different circuits is complicated by a dependence on factors other than just mineral specific gravity.
b = bm = 0
A claimed characteristic of cyclone performance is that Y → 1.0 as d → ∞, i.e. b = 0. Tests with uni-mineral samples tend to confirm this. Recently, performance curves for multi-mineral feeds have been reported where b ≠ 0. The curves developed what was described as a ‘long-tail’ at the coarse end, Kelsall et al. reported this for the individual mineral performance curves, Lynch et al reporting it for the overall performance curve. Considering the Pine Point data, bm = 0 for all minerals but development of a long-tail in the overall is suggested up to – 200 µm. At coarser sizes, however, the calcite/dolomite classification exerts itself, giving the upward inflection and Ym = Y = 1.0 at d – 500 µm. The nature and extent of mineral locking may contribute to the observation of a long-tail in mineral performance curves of the higher specific gravity minerals.
d50(c) α (pm – pL)-K
From hydrodynamic theory, K can have values of 0.5, 0.62 or 1.0 corresponding to laminar, intermediate and turbulent flow conditions respectively . In the analysis, pL is usually taken as 1.0. Treating particles less than 200 mesh, Dahlstrom concluded that K = 0.5, a value frequently used in cyclone models. For cyclones less than 3″, K = 0.62 has been suggested. Kelsall et al. concluded that K = 0.5 did not fit the d50(c) measured for galena, marmatite and silica in a 20″ cyclone; for similar minerals and cyclones Lynch et al. concluded K = 1.0. Iwanic found that K = 0.65 for 10″ cyclones treating hematite, pyrochlore and silica. The present work gives values of 0.75 (Sullivan) to 1.5 (Pine Point).


