Table of Contents
Crushed stone operations have become more difficult due to rising costs of labor and equipment, with the consequent reduction in profit margins. Competition from other operators and the encroachment of vertically integrated companies place severe restrictions on available markets. The seasonal demand for stone precludes any definite production level, and changes in productivity have to be accommodated. These influence profitability, and therefore production plans must be continuously adjusted to keep pace with rapidly changing conditions.
Mathematical Modelling
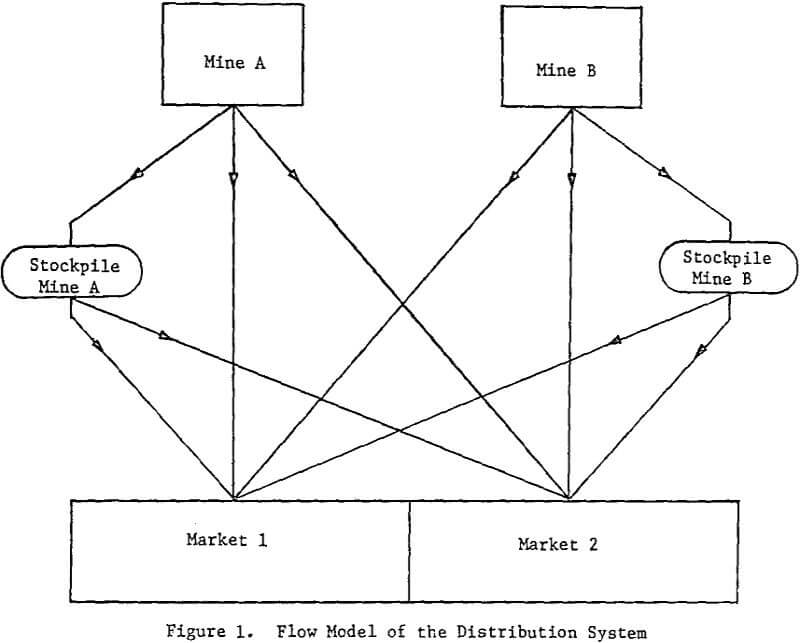
Basic aspects of the system being modelled can be brought into focus by referring a flow model for two mines serving two markets. The production from each mine can be shipped to either market, excess production being diverted to Stockpile. During other periods, material is also shipped from the stockpile to the markets to meet peak demands. The actual system studied here is much more complex in the sense that there are more mines and more market areas.
Notation: The following notation will be used throughout this thesis.
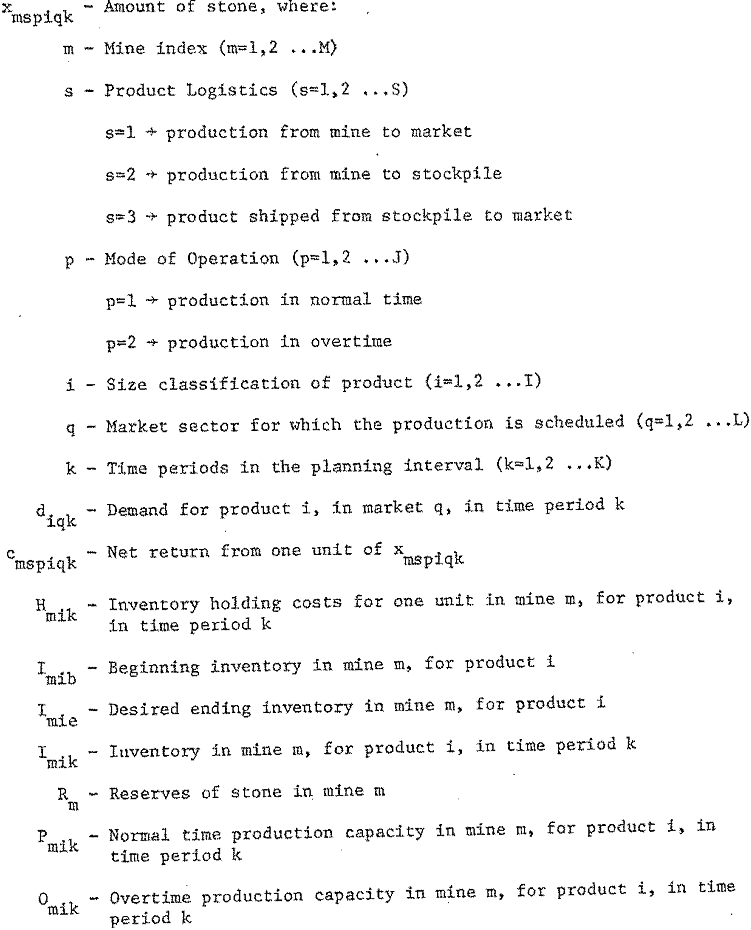
Restrictions and Requirements: With the above symbols, the constraints are written as follows:
- The demand in market sector q for product i in time period k must be met. This can be met by direct shipping from the mine and also by shipping from stockpile.

- The normal time production of the product i, in mine m, in time period k, cannot exceed the designed normal time production capacity.

- Similar restrictions will be applicable to overtime production.

- The inventory restrictions are exact equalities. The ending inventory in the (k-1) time period, plus production into stockpile in time period k must equal the ending inventory in time period k plus the demand that was supplied from the inventory in time period k. This is true for each product in each mine.
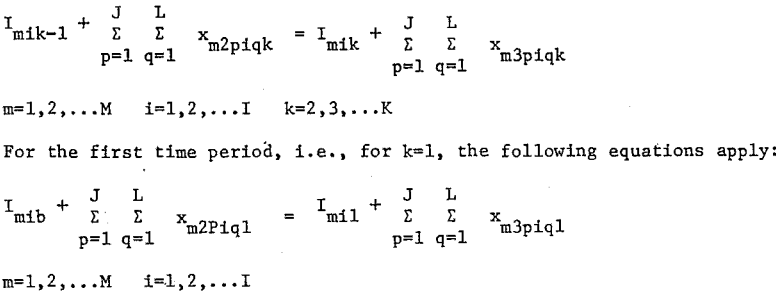 Under the above definition, it should be noted that Imie = Imik. The restrictions and requirements for maximum and minimum inventory levels and the desired ending inventory for each product can be considered implicitly in the computer algorithm to be used for solving the problem.
 - In each mine, the total stone produced during the planning interval cannot exceed the available reserves of stone.

Model Testing
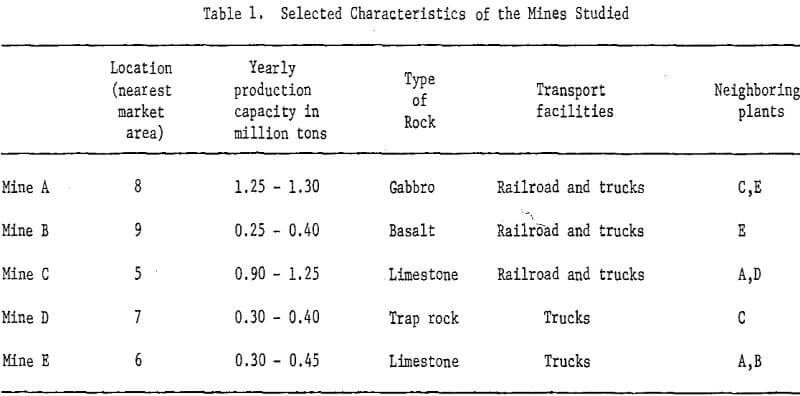
The mathematical model proposed above was tested against an operating proto-type to prove its validity. For the purposes of this study, five operating plants were considered. The general marketing area covered by these plants was divided into a number of marketing sectors. Plant capacities and cost figures were available from historical records. However, collection of some of the data for model input was an involved procedure and is explained below. In Table 1 are presented some information on these plants. Owing to the commercial implications of the numerical data and the contractual obligations of the investigators, it is not possible to publish the precise values used in the analyses.
Determination of Market Areas: Plants shipping stone to construction contractors, townships and other major consumers were noted for the entire market area. This provided a working basis for division into distribution areas for each plant and also provided an opportunity to identify those areas where the plant normally does not market its products.
Estimation of Demand: Conventional thinking with respect to sales forecasting in the stone industry has been to forecast sales from each plant.
Production Capacities: There are a number of products produced by the plants to meet the standard specifications of Pennsylvania, New Jersey, Maryland, Delaware, etc.
Transportation Differential Cost: When delivered price for a customer is quoted, the company can maximize its net return by supplying the demand from the plant with the lowest delivered cost. When this demand is met from some other plant, there is a decrease in the net return.
Discussion of Results
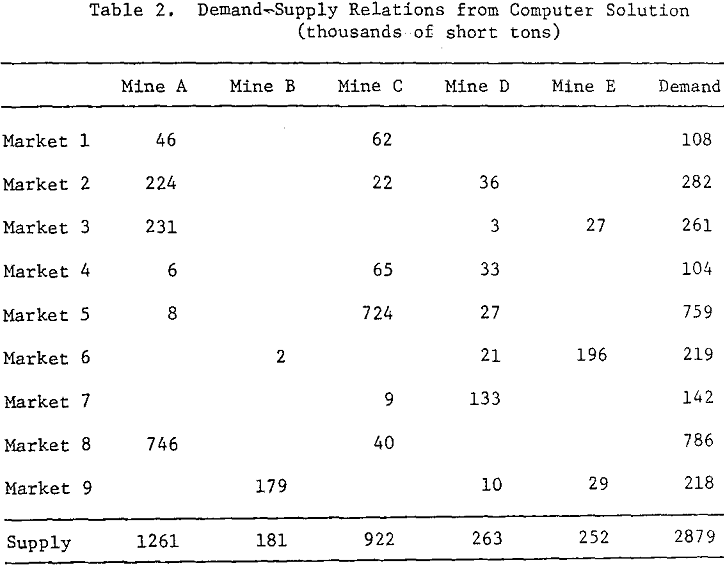
From the linear programming solution, the demand-supply relation between the markets and the production centers has been abstracted. Mine B is not in a competitive position with any other plant in any other market because of its distance from these plants and other market areas. The policy, therefore, for Mine B should be to match its production with demand in market mine. On the other hand, a significant interaction between markets 1, 2, 4, 7 and 8, and Mines A, C and D can be discerned. This is particularly important because Mine A and C have large production capacities and Mine D has an unlimited supply of stone. The importance of this interaction can hardly be overemphasized if production capacities at these plants were to be readjusted. Such adjustments are usually required either due to mining conditions or due to the long-term policies of the company.
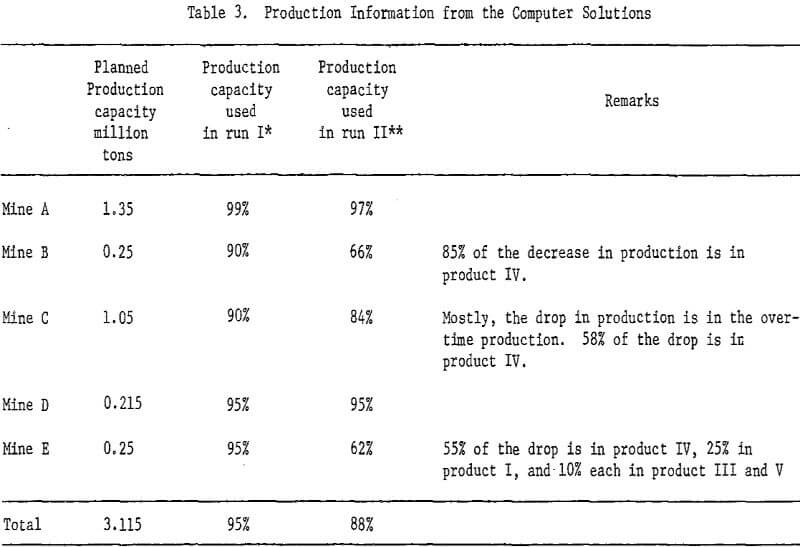
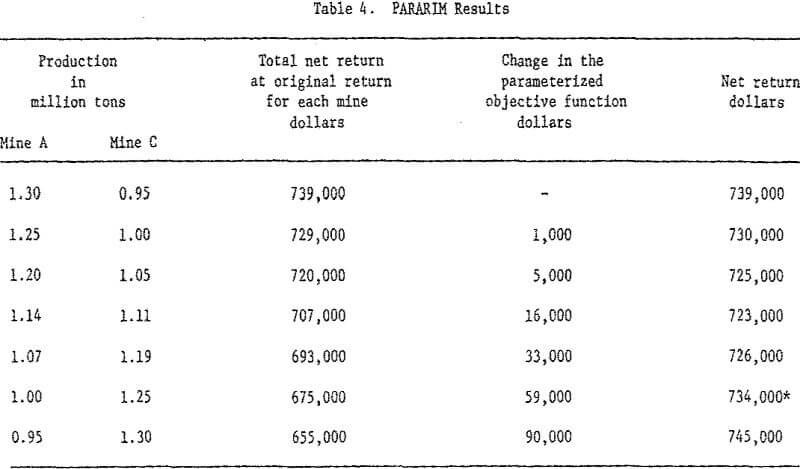
A parametric programming analysis was conducted to study the effect of the interaction using the PARARIM procedure. In this analysis Mine A production capacity was gradually decreased from 1.35 million tons to 0.95 million tons whereas Mine C production capacity was gradually increased by the same amount. During this process it was assumed that mine A’s net returns will gradually decrease, to a final decrease of 12 cents per ton whereas that of mine C will gradually increase to a final increment of 15 cents per ton.
A number of other applications for the model can be outlined. The model can be readily applied to any company having other products in its production scheme. For example, production planning and scheduling problems for ready mixed concrete plants and asphalt plants competing in the same market area can be easily solved. Also, analyses to predict the effects of production changes in plants, demand changes in the markets, changes in quotation prices, etc, can be conveniently carried out.
