Table of Contents
Molten-salt electrolysis of lead chloride is an integral unit operation in a ferric chloride leaching process that was developed by the U.S. Bureau of Mines for treating galena concentrates as an alternative to smelting. Prior to the Bureau’s work, several other investigators had studied molten-salt electrolysis of lead chloride. As part of the Bureau’s research effort, several monopolar and bipolar electrode designs were investigated in bench-scale electrolytic cells, which ranged in capacity from 5 to 400 A. The Bureau also built and operated a 3,000-A lead electrowinning cell that was tested at 450° C with a LiCl-KCl-PbCl2 electrolyte as part of an integrated, semi-continuous operation of the process. The 3,000-A (fig. 1) cell used horizontal graphite plate electrodes and was capable of producing 225 kg of lead metal per day. The anode consisted of two graphite plates 37 by 61 by 7.6 cm thick. The bottom surfaces of the anode plate were grooved with six 0.95-cm-wide channels which were sloped at 4° from the horizontal to direct chlorine gas away from the anode surface. The cathode was a single graphite plate measuring 74 by 61 by 5.1 cm thick. The cathode had six 0.64-cm wide grooves slanted to direct the lead metal in the opposite direction of the chlorine gas. The lead metal collected beneath the cathode that was supported 7.6 cm from the cell bottom by eight 7.6-cm-diam graphite rods. Average operating data for the previous operation of the 3,000-A cell with horizontal, flat-plate electrodes are shown in table 1.
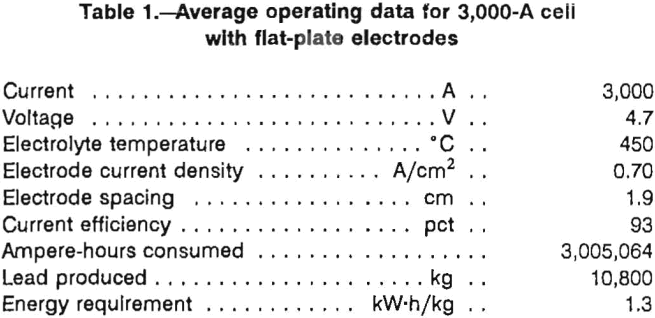
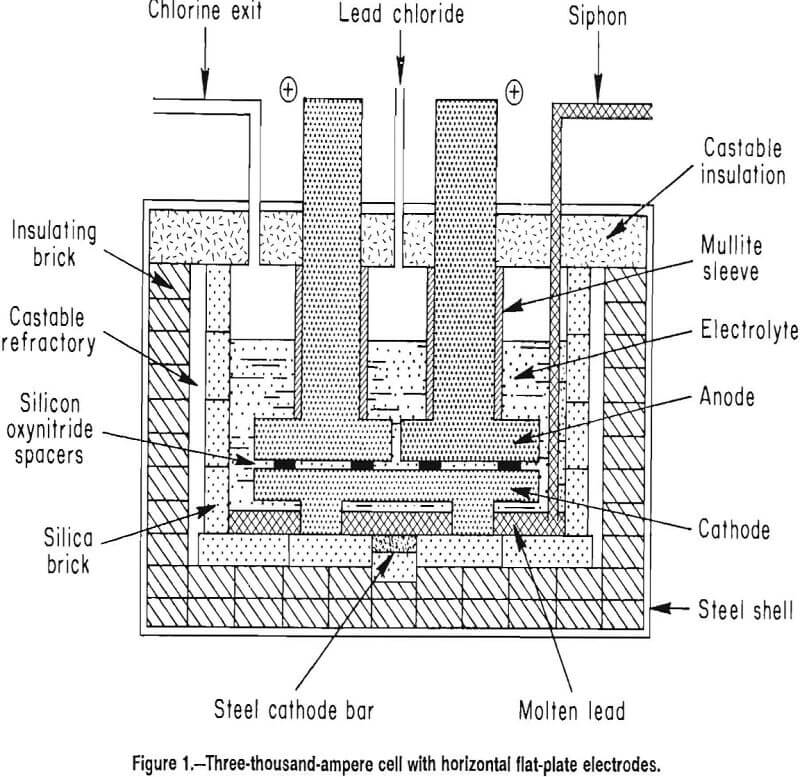
A cost evaluation based on data obtained from the bench-scale cells showed that electrolysis was the most expensive step in the process. The energy requirement in the previous operation of the 3,000-A cell was 1.32 kW-h/kg which was even higher than anticipated from electrolysis in bench-scale cells. As a result, it was decided that alternative electrode designs should be investigated to determine if the energy required for electrolysis in the 3,000-A cell could be significantly decreased.
To decrease the energy requirement, the electrode assembly should (1) facilitate chlorine removal from the anode surface, (2) increase the effective electrolyte and electrode area, and (3) decrease the electrode spacing. Four electrode designs were investigated on a bench scale, and one design was tested in the 3,000-A cell at 3,000 and 4,000 A. Some of the data from the investigation were presented previously.
Theoretical Considerations
The cell voltage is the sum of several voltages and is given by equation 1:
Vcell=Vd + Na + Nc + ReI + RmI…………………………………………………(1)
where Vd is the decomposition voltage of PbCl2, Na is the anode overvoltage, Nc is the cathode overvoltge, ReI is the voltage drop in the electrode leads and the electrodes (Re is the electrical resistance of the electrodes and I is the cell current), and RmI is the voltage drop in the electrolyte (Rm is the resistance of the electrolyte).
Decomposition voltage was measured to be 1.33 V in bench-scale cells. The decomposition voltage can be calculated from the well-known Nernst equation 2:
Vd = E° + RT/ZF lnAPbCl2……………………………………………………(2)
where E° is the standard electrode potential, R is the gas constant, T is the absolute temperature, Z is the number of electrons transferred in the reaction, F is the Faraday constant, and A is the activity of PbCl2 in the molten electrolyte.
E° is calculated from ΔG°, the free energy of formation of PbCl2 at 450° C, as given by Wicks and Block,
E° = -ΔG°/ZF………………………………………………………………(3)
which yields E°= 1.31 V. To solve the second term on the right side of equation 2, the activity of PbCl2 must be determined. Subtracting the calculated E° of 1.31 V from the measured Vd of 1.33 V yields a difference of 0.02 V. The 0.02 V differences corresponds to an activity of 0.5 which is reasonable if the PbCl2 is very weakly associated in the melt.
The voltage drop in the electrolyte, RmI, is related to the effective electrolyte conductivity, K’, by
RmI = LI/KxA……………………………………………………….(4)
where L is the electrode spacing, and I/A is the current density. K’ differs from K, the absolute electrolyte conductivity, because of chlorine gas buildup in the electrolyte. According to DeLaRue and Tobias, K’ is related to K by
Kx = K(1 – E)1.5……………………………………………………..(5)
where E is the volume gas fraction in the electrolyte.
Equipment and Experimental Procedures
All reagents used in the bench-scale experiments were reagent grade. Technical grade PbCl2 was used in the 3,000-A cell, while other salts were reagent grade. For all experiments, the electrolyte composition was, in weight percent, 6.5 LiCl, 16.5 KCl, and 77 PbCl2, and the operating temperature was 450° C.
Two Curtis 1002 integrating meter outputs were averaged to obtain ampere-hour data. Cell currents were determined to 0.05 A by measuring the voltage drop across a calibrated shunt. Voltages were measured with a Fluke Model 8026B multimeter calibrated against a potentiometer. To eliminate the potential drop in the electrode leads, ReI, from the cell potential measurements, the voltage was measured from cathode to anode. For voltage measurements in the bench-scale experiments, 0.24-cm-diam tungsten rods were pressed into holes drilled into the cathode and anode to serve as voltage probes. In the 3,000-A cell, tungsten wire probes were placed in contact with the anode and cathode when the voltage measurements were taken. In both cases, the tungsten probes were cemented in borosilicate glass tubes with Cotronics 919 ceramic cement. For the 3,000-A cell, the voltages given in the tables and used for calculating energy requirements were measured externally to be consistent with previous 3,000-A cell measurements.
With the bench-scale cells, enough electrolyte was added to the cell container so that the electrode assembly was covered with at least 3 cm of electrolyte. Current density-voltage curves were obtained for all electrode designs by increasing the current density incrementally. Electrolysis was continued for 1 min at each selected current density.
Electrode Designs Tested On Bench Scale
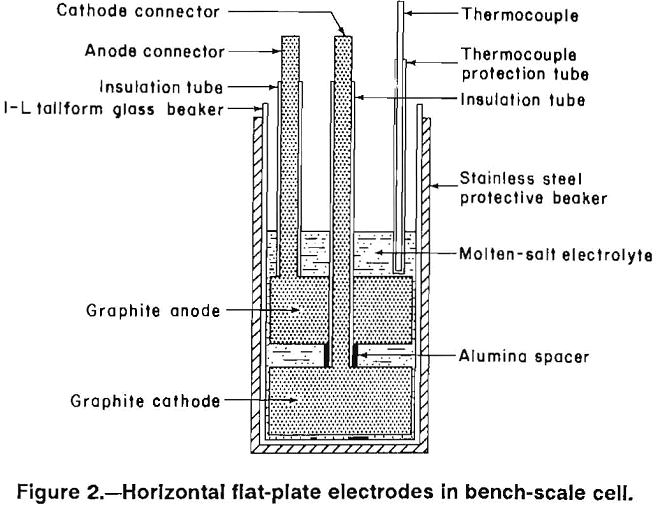
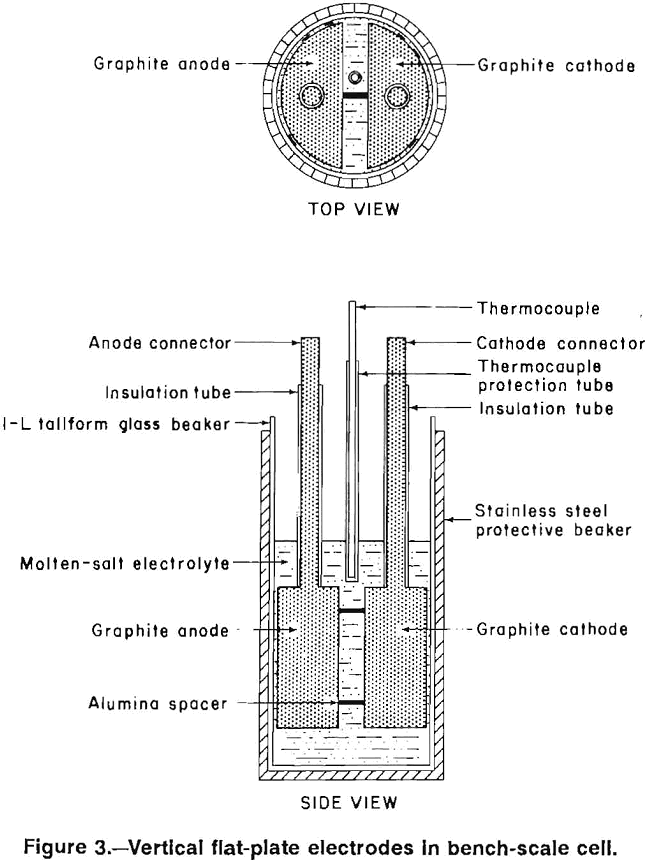
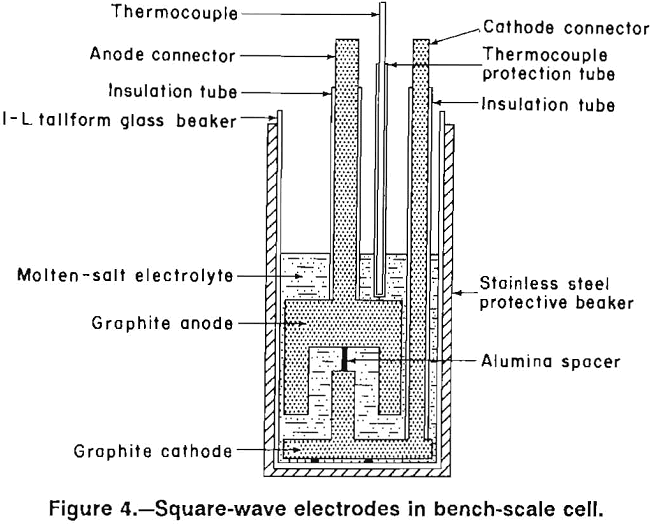
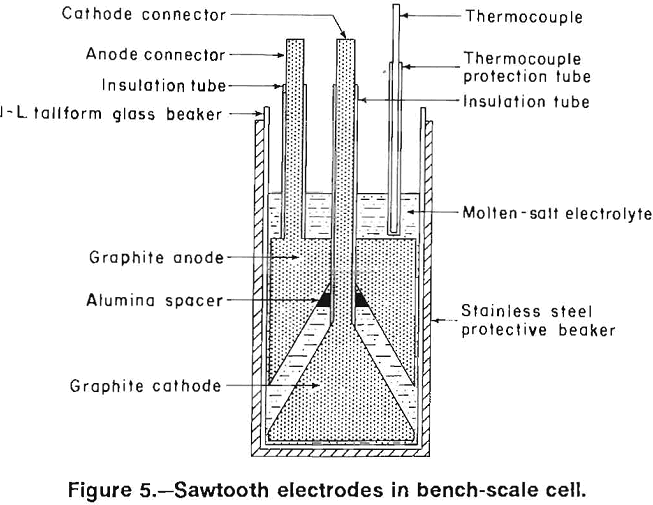
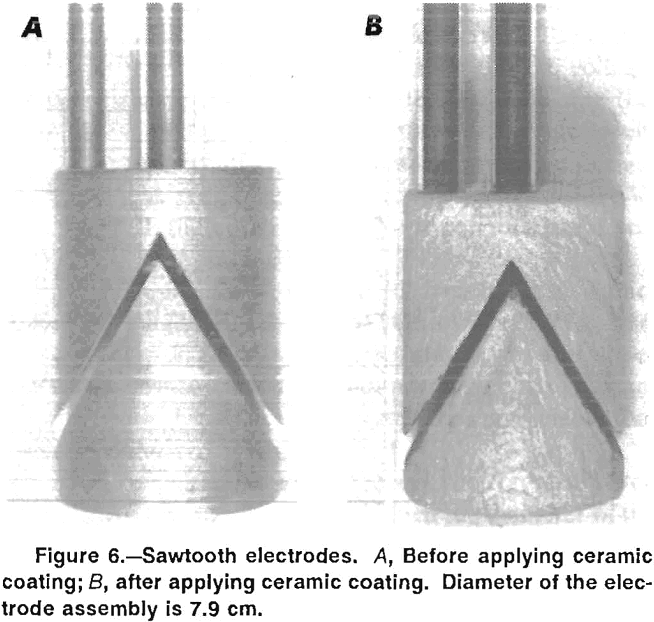
Four electrode designs (figs. 2-5) were selected for testing on a bench scale. The electrode assemblies were horizontal flat plate (fig. 2), vertical flat plate (fig. 3), square wave (fig. 4), and sawtooth (figs. 5-6). All the electrodes were made from 7.9-cm-diam graphite rod. The electrodes were held at the desired spacing with two 0.32-cm- diam alumina rods. Graphite rods, 1.3-cm diam, were threaded into the electrode plates and were connected to the rectifier leads. Borosilicate glass tubes insulated the graphite connecting rods from the electrolyte.
The horizontal flat plates were 1.3-cm-thick disks. The vertical flat-plate electrodes measured 7.6 by 7.6 cm on the inside faces. The square-wave assembly cathode had a raised portion 1.3-cm wide and 2.5-cm high while the trough in the anode was 3.8-cm wide and 2.5-cm deep. The sawtooth cut was 6.3-cm deep and the angle of the groove was 60°. The horizontal flat-plate, square-wave, and sawtooth electrodes had 0.2 cm clearance to the sides of the glass container, while the vertical flat-plate electrodes had 0.7 cm clearance. The side clearance was important for all electrodes, except the vertical electrodes because it determined the size of the pathway for and hence the resistance to chlorine escape.
In subsequent experiments, an insulating coating of Cotronics 919 ceramic cement was applied to the external surfaces of the vertical, horizontal, and sawtooth electrodes. Figure 6 shows the sawtooth electrode assembly before and after the ceramic coating was applied. The coating adhered reasonably well to the electrodes, although some touchup was needed before the electrodes were reused. Since the ceramic coating was approximately 0.1-cm thick, the space between the horizontal and sawtooth electrodes and the container wall was decreased to about 0.1 cm.
Sawtooth Electrode Assembly for 3,000-A Cell
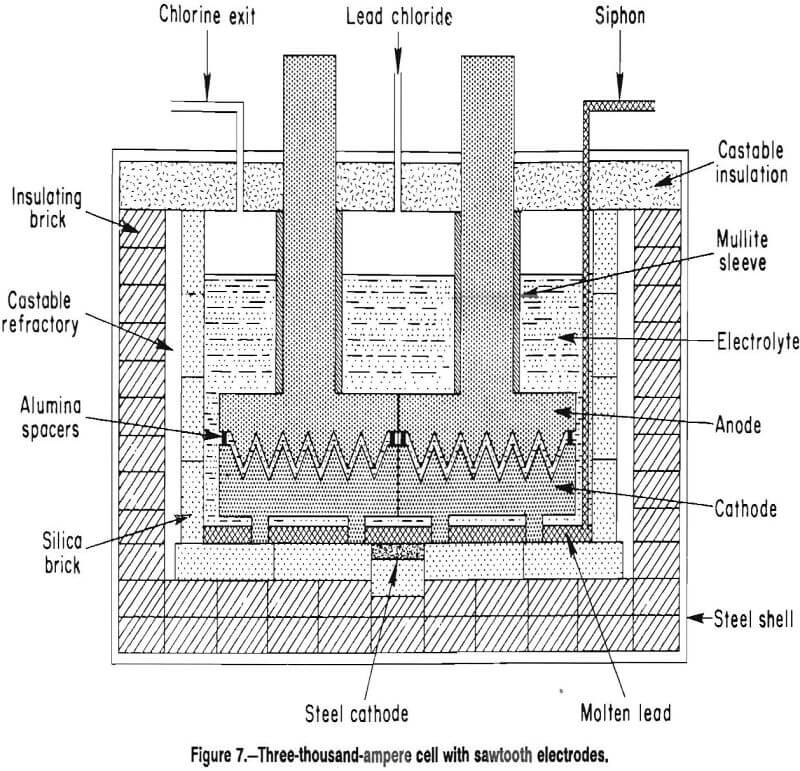
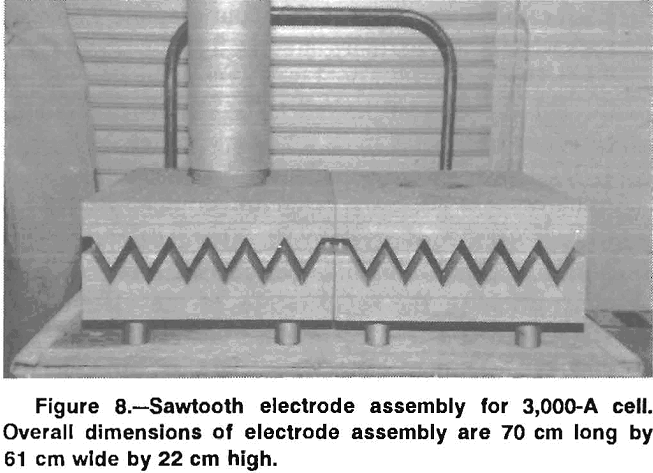
The sawtooth electrode design was scaled up for operation at 3,000 A. The cell with the sawtooth electrode is shown in figure 7, and the electrode assembly is shown in figure 8. Two anodes were cut from 61- by 35- by 10.2- cm-thick graphite plates. As in the bench-scale cell, the apex angle of the triangles was 60°. The depth of the grooves was 5.1 cm. The anodes had 1.27-cm-diam holes cut in the top of the trough and spaced 7.6 cm apart to permit chlorine escape. A 15-cm-diam graphite rod was threaded into each anode and the upper ends of the rods were connected to a copper busbar. The graphite rods above the anode plates were protected from air oxidation by mullite sleeves. The cathodes were similar to the anodes, but without the holes. The lead metal formed on the cathode, moved
down the side of the sloping well to the bottom of the trough, and flowed along the trough to the end of the cathode. The lead collected in a pool below the cathode. Each cathode was supported by four graphite 7.6-cm-diam rods which were partially immersed in the pool of molten lead. Under the lead pool was a steel bar that protruded through the sides of the cell. The steel bar served as the cathode connection to a 5,000-A rectifier. The anode-cathode plates were separated by 1.27-cm-diam alumina rod spacers. Two removable 10-cm-diam graphite electrodes were connected to an alternating current (ac) power supply. During idle periods when the cell was not electrowinning, the temperature of the electrolyte was maintained at 450° C by resistive heating with alternating current. During electrolysis, less resistive heat was required. Cell interior dimensions were 86 cm long, 64 cm wide, and 46 cm deep. The inside walls were constructed of silica bricks, and the lid was constructed of refractory cement and low-density aggregate.
Electrode Assemblies in Bench-Scale Cell
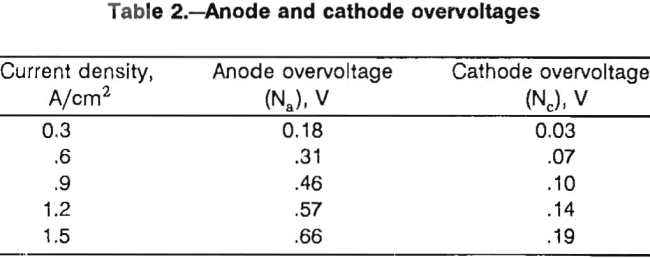
Current density-cell potential curves were obtained for the electrode assemblies at 1.27-cm electrode spacing. The data are plotted in figure 9, which also shows the theoretical curve calculated with equation 1. The conductivity of the electrolyte, K, was calculated to be 1.2 Ω-¹ cm-¹ from the data of Mikhail, MacLean, and Webster. Values for the anode and cathode overvoltages, Na and Nc, respectively, were determined at 450° C by interpolating
from the work of Welch and Iwanec for graphite electrodes at 400° and 500° C. The overpotential values that were used are shown in table 2.
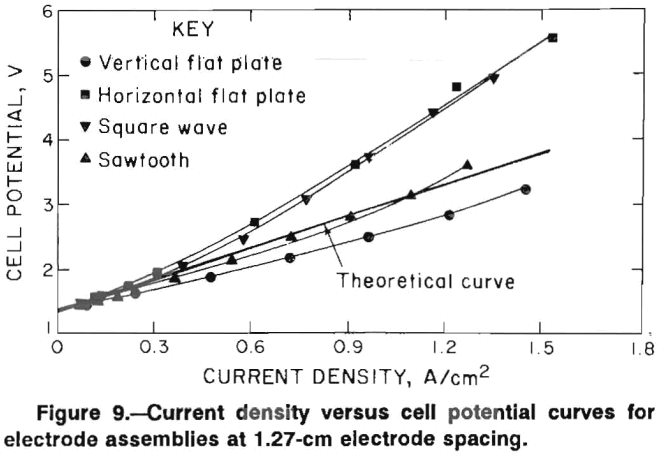
The lowest voltages, which were obtained with the vertical flat-plate electrodes, were less than the theoretical voltages. The inside faces of the cathode and anode were assumed to be the only active electrode surfaces, but the assumption was not valid. The actual current density was significantly less than the calculated current density for the vertical flat-plate electrodes because of conduction from surfaces other than the inside facing surfaces. The difference in current density was larger for the vertical electrodes because the vertical electrode assembly had more free space in the electrolyte container than the other assemblies.
The sawtooth assembly yielded the next lowest voltages followed by the square-wave and horizontal flat-plate assemblies. The higher voltages obtained with both the horizontal and square-wave assemblies can be explained by chlorine buildup on the anode. The deviations from the theoretical curve increase at higher current densities where a chlorine buildup would be more likely. Current density-cell potential curves were generated for the electrode assemblies with the ceramic coating. The electrode spacing was decreased to 0.8 cm for these experiments. The results are shown, along with the theoretical curve, in figure 10. Results for the vertical and sawtooth electrodes are similar and are in excellent agreement with the cell voltages, which were calculated using equation 1. Voltages recorded for the vertical electrodes were higher than those recorded for the uncoated electrodes (fig. 9 ) in spite of the decreased electrode spacing. This result indicates that the ceramic coating effectively limited the active surfaces of the electrodes to the inside faces.
Voltages recorded with the horizontal electrodes were extremely high, were not steady, and were difficult to measure, especially when the current density exceeded 0.5 A/cm². The cell voltages increased at constant current density as chlorine gas gathered on the anode. Eventually the gas would release from the anode and the cell voltage would decrease. The plot shown in figure 10 represents the voltage at its minimum point.
After completing the experiment with the horizontal electrodes, the furnace was tilted at a 15° angle from vertical, and the current density-cell potential curve was
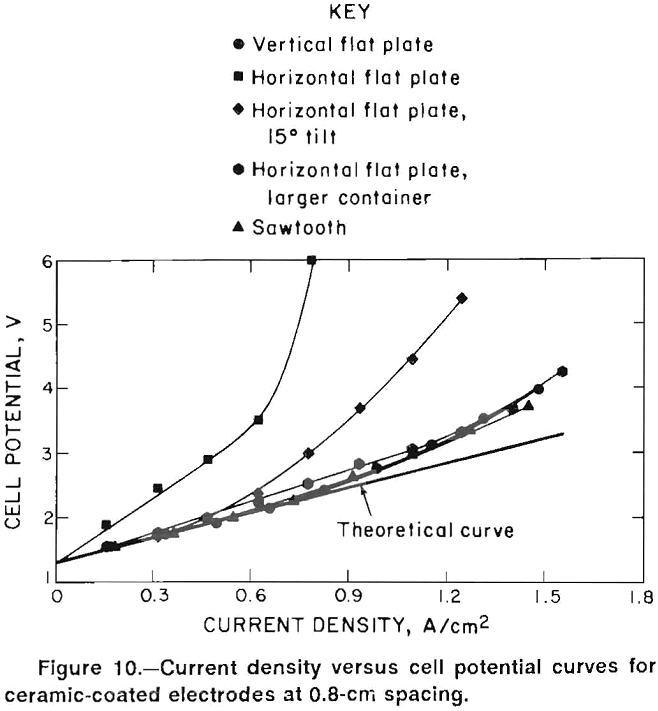
redetermined. Tilting the electrode assembly should facilitate chlorine removal from the anode surface. The results are also shown in figure 10. With a 15° tilt, the voltages were constant at a given current density, indicating that chlorine escaped from the anode at a constant rate. Voltages were significantly less than obtained with the furnace in the upright position. When the furnace was tilted 30° from vertical, the current density-cell potential curve was identical to that obtained with a 15° tilt.
Tilting the furnace at 15° and 30° from vertical did not affect cell voltage with the vertical electrodes. In this case, the furnace was tilted so that the anode was the upper electrode. Since chlorine buildup was not a significant problem with the vertical electrodes, it is reasonable that tilting the electrodes had no effect.
Another experiment was made with the ceramic-coated horizontal electrode assembly in which the diameter of the glass electrolyte container was increased in size. The annular space between the electrodes and the glass container was increased to 0.5 cm. With the larger container, the current density-cell potential plot was essentially the same as with the vertical and sawtooth electrodes.
Both horizontal and vertical electrode assemblies were operated at 0.78 A/cm² for 2 h and 0.8-cm electrode spacing to determine if current efficiency was adversely affected by close electrode spacing. With the horizontal electrodes, the larger diameter glass container was used so that cell potentials were similar. Under these conditions, the current efficiencies recorded for the horizontal and vertical electrodes were 99.5 and 99.3 pct, respectively.
Experiments were also performed with the vertical electrode assembly at 0.4-cm spacing. Current efficiency decreased to 90 pct, but more significantly, no decrease was obtained in voltage compared with that obtained at 0.8-cm spacing. At 0.4-cm electrode spacing, the flow of chlorine gas carried electrolyte from between the electrodes. As a result, less electrolyte, was available to carry the current, and the conductance of the cell decreased. The cell voltage remained constant because the decrease in conductance was offset by the decrease in electrolyte resistance at the closer electrode spacing. These results show that 0.4 cm is not a practical spacing for lead electrowinning at 450° C with the chosen electrolyte,
Operation of 3,000-A Cell with Sawtooth Electrodes
The sawtooth electrode design was chosen for scaleup because it performed as well as vertical electrodes in the small-scale tests and should remove chlorine effectively on a larger scale. The sawtooth electrodes could be easily fabricated from a rectangular block of graphite and placed in the existing cell housing with little modification.
With sawtooth electrodes, the relationship between groove angle, depth of groove, and electrode spacing must be considered to maximize the effective electrolyte area. A mathematical analysis, which is given in the appendix, was used to determine the ideal groove angle after the depth of groove and the electrode spacing were selected. A groove depth of 5.1 cm and an electrode spacing of 1.27 cm were selected for the large cell electrode assembly. The optimum groove angle was then calculated to 60°. Smaller angles would increase the total electrode surface area, but the effective bath area between electrodes would decrease unless electrode spacing was also decreased. The effective bath area was defined as the area which was covered by parallel faces of both the anode and cathode. It was assumed that the electrolysis that occurred between all other electrode surfaces was insignificant. While this assumption was not strictly true, it greatly simplified the mathematical analysis contained in the appendix.
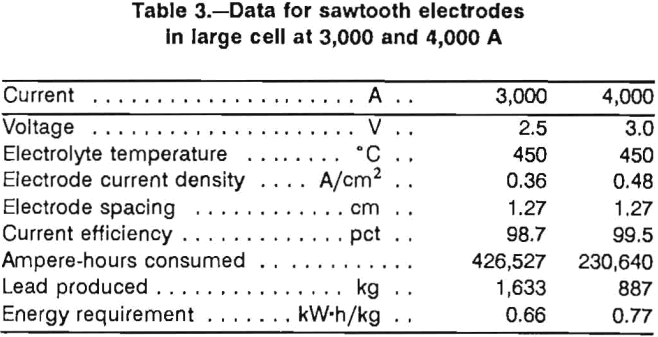
The sawtooth cell was operated continuously at 3,000 A for 6 days. The results are shown in table 3. Current efficiency was 98.7 pct, which was similar to the current efficiencies obtained in the bench-scale tests. The energy requirement of 0.66 kW-h/kg of lead metal produced was a significant improvement over the 1.32 kW-h/kg obtained in the earlier tests. The voltage of 2.5 V given in table 2 was measured, as in the previous cell, from the anode connecting rod to the cathode steel busbar. Measuring the voltage directly between the anode and cathode gave an average voltage of 1.9 V. Thus, the voltage drop in the electrode leads, which is the ReI term in equation 1, was 0.6 V in the 3,000-A cell.
Since the potential drop through the electrolyte was dramatically decreased by the sawtooth electrodes, much less heat was generated in electrolysis. As a result, 6 kW had to be furnished by the ac power supply during electrolysis to keep the electrolyte at 450° C.
Following cell operation at 3,000 A, the cell was operated at 4,000 A for 58 h. The operational data at 4,000 A are given in table 3. Current efficiency was excellent at 99.5 pct. Cell voltage increased to 3.0 V and resulted in an energy requirement of 0.77 kW-h/kg. Voltage losses in the leads at 4,000 A increased to 0.9 V. Cell potential from anode to cathode was 2.1 V and showed little influence of chlorine gas on the electrolyte conductivity. At 4,000 A, the ac power requirement to keep the electrolyte at 450° C was decreased to 4 kW.
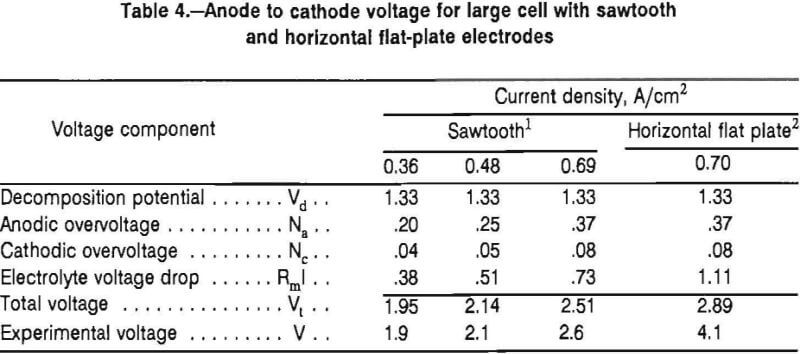
Table 4 shows a breakdown of the voltages obtained with the sawtooth electrodes and the horizontal flat-plate electrodes. The voltage losses in the electrodes, ReI, were subtracted from the calculated and measured total cell voltages, VT and V, respectively (table 4). Thus, Vt is Vcell – ReI table 4. As stated previously, the voltage losses in the electrode leads were 0.6 and 0.9 V at 3,000 and 4,000 A, respectively. The absolute electrolyte conductivity, K, and the electrode overvoltages, Na and Nc, were obtained from the same data sources that were used for the bench-scale results. The data for the sawtooth electrodes at a current density of 0.69 A/cm² were based on 10 min of cell operation at 5,730 A.
The measured total cell voltages, V, recorded for the sawtooth electrodes are in excellent agreement with the calculated values, VT. In addition, the measured cell voltages agree closely with the bench-scale cell voltages at 0.8-cm electrode spacing if the electrolyte resistance is increased as projected because of the increase in electrode spacing.
The agreement between the data obtained with the bench-scale and the large cells indicates that chlorine gas buildup was not a problem with the sawtooth electrodes. Even at 0.69 A/cm², the difference between the calculated and experimental voltages is 0.1 V, which according to equation 3 would correspond to a gas fraction of only 8 pct.
By contrast, with the horizontal flat-plate electrodes operating at 0.7 A/cm², the difference between the measured and the calculated voltage is 1.2 V, which means the gas fraction calculated from equation 3 was 39 pct. A gas fraction of this magnitude causes the electrolyte resistance to double.
Summary and Conclusions
Lead metal was electrowon from a LiCl-KCl-PbCl2 electrolyte at 450° C at 3,000 and 4,000 A with a sawtooth electrode assembly. At 3,000 A the energy required was 0.66 kW-h/kg of lead metal produced and was considerably less than the 1.32 kW-h/kg required with horizontal flat-plate electrodes. To achieve the energy decrease, chlorine gas removal from the anode was improved, electrode spacing was decreased from 1.9 to 1.27 cm, and the electrode surface area was doubled. Chlorine gas did not increase the electrolyte resistance with the sawtooth electrodes at either 3,000- or 4,000-A cell current, while chlorine doubled the electrolyte resistance with the flat-plate electrodes. The improvements in electrolysis efficiency will significantly decrease the cost of producing lead metal by the ferric chloride leaching-molten-salt electrolysis process.
