The design of slurry launders has usually been based on strictly empirical concepts. An examination of the most common procedures reveals that they do not account for many of the variables that are recognized as significant for slurry transport. These may include flow rate, volume concentration of solids, solids specific gravity, solids size distribution, particle shape, launder geometry, and roughness of the wetted surface.
Mathematics
The discussion which follows concerns the mathematical basis of the launder design procedure for pipe, rectangular, and U-shaped launders.
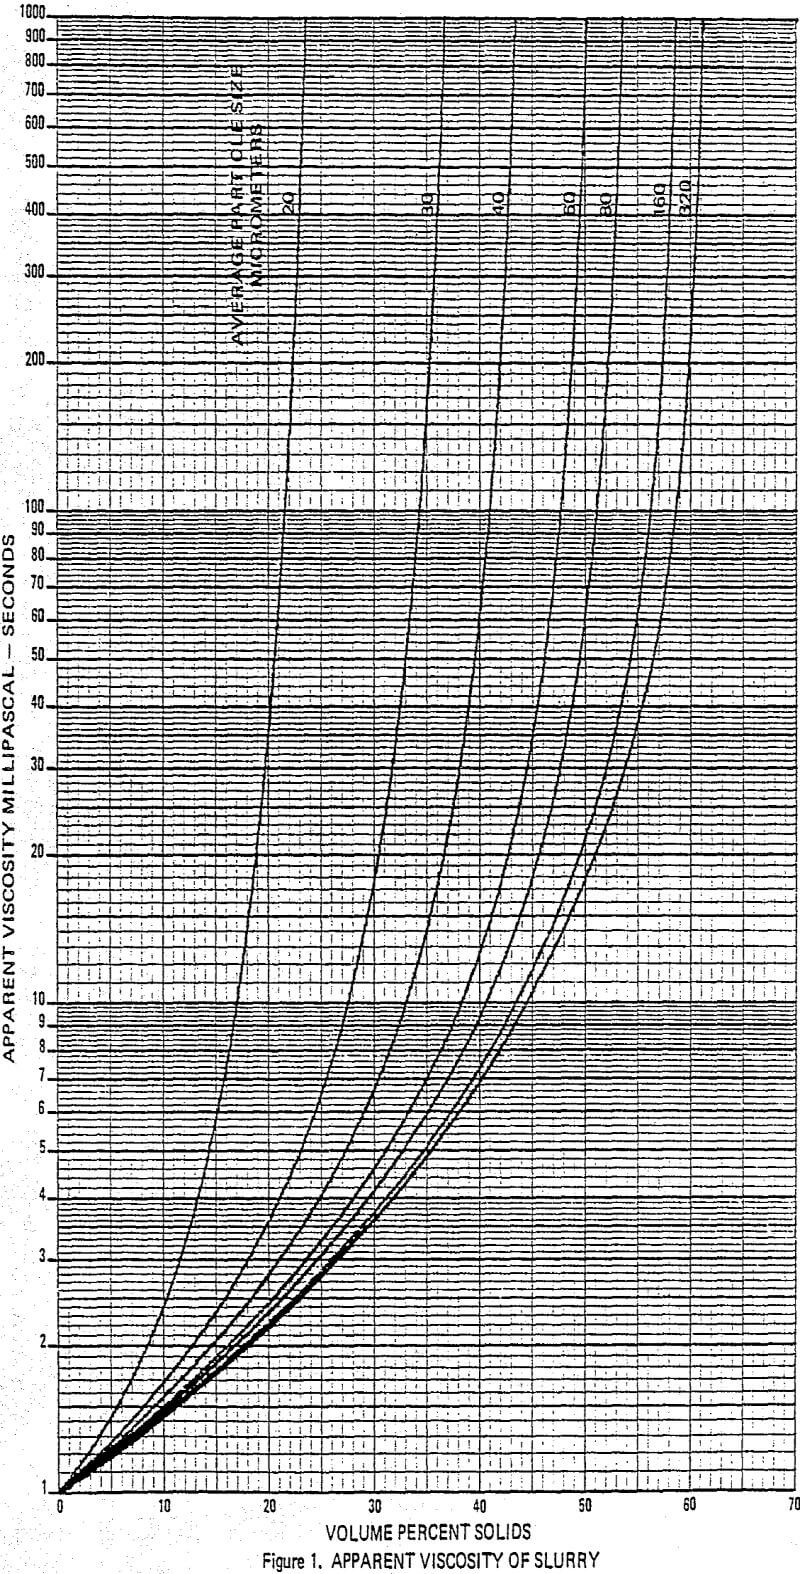
An apparent viscosity-volume concentration curve for suspensions of 20 micrometer particles was produced from unpublished data. The shape of this curve was similar to Thomas’s but exhibited a steeper slope as the concentration increased. Further data from a USBM paper by Schack, Dean, and Molloy produced curves for other particle sizes. These, also, had slopes steeper than the Thomas curve in the high concentration region.
On the basis of these data and from examination of several other curves for apparent viscosity of solid-liquid suspensions, the Thomas curve was adjusted to accelerate the slope increase as the solids concentration becomes greater. This adjusted curve was assumed to apply to suspensions having particles averaging 320 micrometers (50% wt. passing). A family of curves between the adjusted Thomas curve for 320 micrometer particles and the curve for 20 micrometer particles was then constructed. The intermediate curves were developed as a function of the ratio of increased particle surface area as the particles became smaller.

n = Manning roughness coefficient
R = Hydraulic radius, feet
k = Effective roughness, feet
The above equation was solved for “k” and a tabulation of “k” values for various “n” and “R” values.
For any particular hydraulic radius a correlation exists between the Manning “n” and the roughness value “k”. It is assumed an average hydraulic radius of 0.183 meters would apply to launder sizes most likely to be encountered. Errors introduced by this assumption are minimal. Published “n” values for various types of surfaces and the derived n-k correlation resulted in the approximate “k” values.

V = Velocity, ft/sec
g = Acceleration of gravity, ft/sec²
S = Specific gravity of particles
Dg = Particle diameter, feet
f = Darcy friction factor, dimensionless
B = Particle motion constant, dimensionless
Discussion
Having selected the mathematical basis for the flow calculations, it is appropriate to consider the limitations of such a basis. The formulae are stated in forms which apply to open-channel flow of liquids. It is assumed that the slurries behave essentially as true liquids. The calculation system does not apply to solid-liquid suspensions with solids concentration and particle size such that the slurry exhibits plastic or thixotropic characteristics. For pipe launders the flow-depth-to-diameter ratio must be less than one.
The variety of conditions encountered in open-channel flow is greater than in pipe flow both because of the existence of the free surface and the alternative stages of flow having equal energy. Because of this, it is reasonable to expect that the hydraulic transport of solids in launders would be subject to more uncertainties than in pipes flowing full under pressure.
Procedure
The initial launder size is calculated so that the continuity (design) velocity is 1.15 times the solids transport velocity. This 15% safety margin is estimated to cover input data inaccuracies and launder construction variation.
This design system permits the evaluation of the flow data associated with the individual variation of physical dimensions and flow rate. An initial set of flow and launder size data is calculated from usually available information concerning the launder performance requirements. This initial set of data is used as a reference or starting point for the eventual design.


