In a room-and-pillar system of mining in which no artificial support is used (linings, sets, props, etc.), the weight of the overlying cover is sustained in part on the abutment and in part by the pillars. The pillars are usually the most important structural support element in a room-and-pillar system and their stability is responsible for keeping a mine opening stable.
In the course of mining, unknown planes of weakness in the pillars which reduce the load-bearing capability of the pillar will frequently be encountered. The amount of reduction in load-bearing capacity can be predicted. Therefore, methods of increasing, by known amounts, the strength of pillars containing planes of weakness should be useful to the mining engineer and should result in safer mining operations.
The mining industry has used a number of artificial means of support. Devices such as patch plates, structural steel channels, rock bolts, and wire ropes have been used to strengthen the backs, roofs, and pillars in many mines. Wire rope was used on some pillars in the lead mines in the Tri-State area. However, there has been no experimental work performed to quantitatively predict or determine the strength increase resulting from the use of rock bolts or wire rope on pillars containing a plane of weakness,
The purpose of these investigations is to quantitatively determine the increase in strength resulting from the use of rock bolts and wire rope on model pillars containing a plane or parallel planes of weakness oriented at various angles from the vertical axis of the core. From these investigations, equations have been developed to predict this increase in strength based upon the Coulomb failure criterion.
Theory
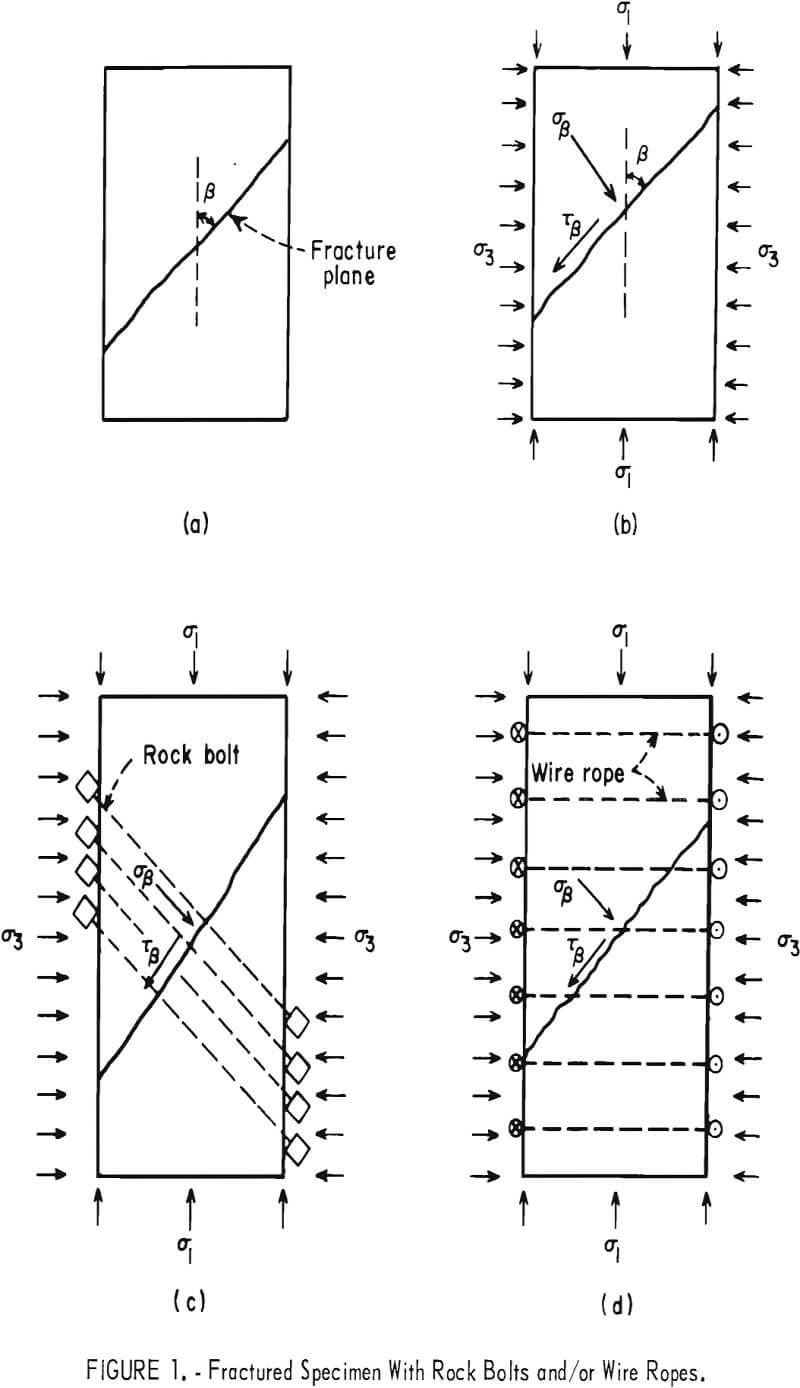
The Coulomb failure criterion for a cylindrical pillar containing a plane of weakness (fig. 1a) assumes that failure of the pillar along the weakness plane occurs when the magnitude of the shear stress along the plane of weakness becomes equal to the sum of the shear strength of the plane of weakness and the frictional resistance to sliding along the failure plane. For a model pillar subjected to a triaxial test, this criterion can be expressed as
Tβ = Sf + µf σβ……………………………………………………(1)
where Tβ is the shear stress in the pillar parallel to the plane of weakness oriented at an angle β from the axis of the maximum principal stress σ1 (fig. 1b), Sf is the shear strength of the plane of weakness, σβ is the normal compressive stress across the plane of weakness, and µf, is the sliding friction coefficient of the plane of weakness.
For the two dimensional case where σ1 and σ3 are the applied principal stresses, the normal and shear stresses on the plane of weakness are as follows:

Substitution of equations 2 and 3 into equation 1 and simplification gives

If σ3 = 0, then equation 4 reduces to
σ1 = Cf = 2Sf/sin²β – µf (1 – cos 2β)………………………………………………(5)
where Cf is the uniaxial compressive strength of the pillar with a plane of weakness.
Rock-Bolting Model
The effect of installing rock bolts normal to the plane of weakness in a cylindrical pillar (fig. 1c) is to increase the shear resistance along the plane of weakness by the shear strength of the bolts, provided that the bolt is tight in the hole. The effect of tensioning the rock bolts is to increase the normal load on the plane of weakness, and this in turn increases the friction effect. We therefore postulate that a determination of the average shear stress and normal stress along and across the plane of weakness, respectively, is sufficient for a first-order approximation to calculate the increase of shear resistance due to the rock bolts. Thus, to calculate the increase of shear resistance, we need to know only the number of bolts (N) , the tensile stress in the bolts (Tb), the shear strength of the bolts (Sb), and the ratio of the cross-sectional area of the bolts to the area of the weakness plane (Ab/Af). Equation 1 is rewritten in the form
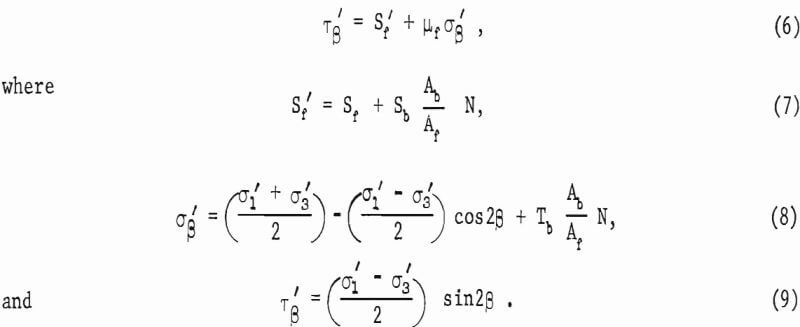
Substitution of equations 7, 8, and 9 into equation 6 gives
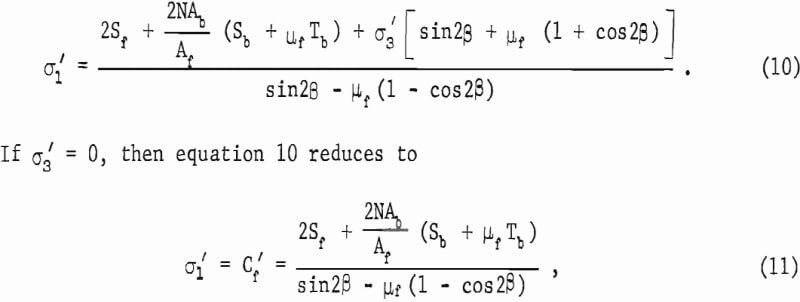
where Cf’ is the uniaxial compressive strength of the bolted pillar. The normalized strength ratio, Cf’/Cf, is from equations 11 and 5:

An example of the use of this equation is given in the appendix.
Wire-Roping Model
The effect of wrapping pretensioned wire ropes on the surface of a model rock pillar (fig. 1d) is analogous to applying an effective confining pressure over the pillar surface. This analogy is rigorously true when the number of ropes per unit length becomes very large.
For ease of calculation, the wire rope is approximated as a thick-walled cylinder having a square cross-sectional area and subject to an internal pressure of magnitude Pi. The tangential stress (σθ) at a fixed radial distance (r) in the thick-walled cylinder is determined as follows:

where a and b’ are the inner and outer radii of the wire cylinder, respectively, and a≤r≤b’. Note that a is also the radius of the model pillar. The total tangential force (T’) acting on a wire rope of thickness t is found from equation 13 to be

The total force generated by N wire ropes of thickness t is 2πNatPi, which must equal the total force (2π aLσ3) resulting from an average stress σ3 applied to the cylindrical surface, where L is the pillar length. Thus from equation 14 we find that
σ3 = T’N/aL…………………………………………………………………..(15)
To calculate the compressive strength of the wire roped pillar (Cf”), equation 15 is substituted into equation 4 to give

The normalized strength ratio, Cf”/Cf, from equations 5 and 16 is

where D is the diameter of the pillar. An example of the use of this equation is given in the appendix.
Experimental Procedures
Experiments were conducted on NX cores (2.125-in diameter) with an L/D (length/diameter) value of 2.47. Six different rock types were used for this study. Standard uniaxial compression-testing procedures were used on some wire-roped specimens with the plane of weakness at a noncritical β angle (>60°). For the majority of the samples with the plane of weakness at a critical β orientation, end platens had to be glued to the rock-bolted and wire-roped specimens to afford end constraint. This end-constraint technique was used previously and was necessary in order to test those specimens.
Sample Preparation
Model NX-size pillars with L/D values of approximately 2.50 were prepared from Longmont sandstone, Salida granite, oil shale, Texas limestone, Indiana limestone, and Carthage marble.
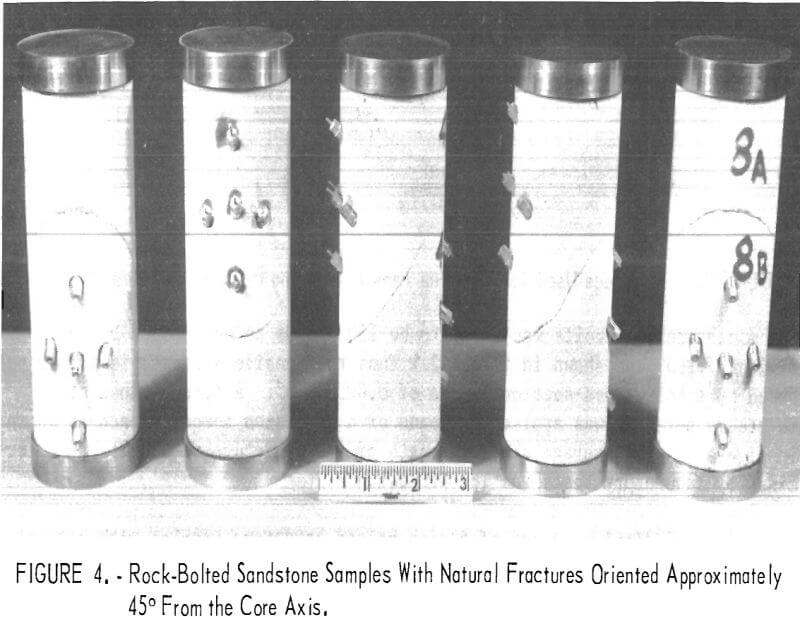
In the rock-bolt testing phase of this study, natural fractures oriented at an angle of approximately 45° to the long axis of the pillar were created for the sandstone, marble and Indiana limestone. Rock-bolt holes were drilled using a small diamond bit normally used in lapidary work. Diamond-saw-cut fracture planes were made for the oil shale, since natural fractures at any angle to the kerogen layers were difficult to generate for this rock.
For the wire-rope testing phase, the cut surfaces of Texas limestone, Longmont sandstone, and Salida granite were surface-finished with a grinder. The ground, saw-cut surfaces were used to simulate the weakness plane for the rock samples. Saw-cut surfaces were used for these rock types because considerable data were available from a previous study. Samples were also prepared containing wafers of various T/D (thickness to diameter) values as described in an earlier paper.
The final size of all specimens was 2.125 in by 5.250 in. A length tolerance of 0.002 in was allowed. The angle made by the end planes to the axis of the specimen was within 1° of perpendicular.
Calibration Procedures for Rock-Bolt Study
Steel drill rod with a 1/16-in diameter, threaded at both ends with a No. 0-80 machine screw, was used to simulate the rock bolt. Five rock bolts per specimen were used and secured at both ends by steel nuts and brass washers (1/16 in thick by 3/8 in diameter). The brass washers were used to minimize the friction between the nut and the bearing plate and to give a truer value of the torque applied. The average tensile breaking force of
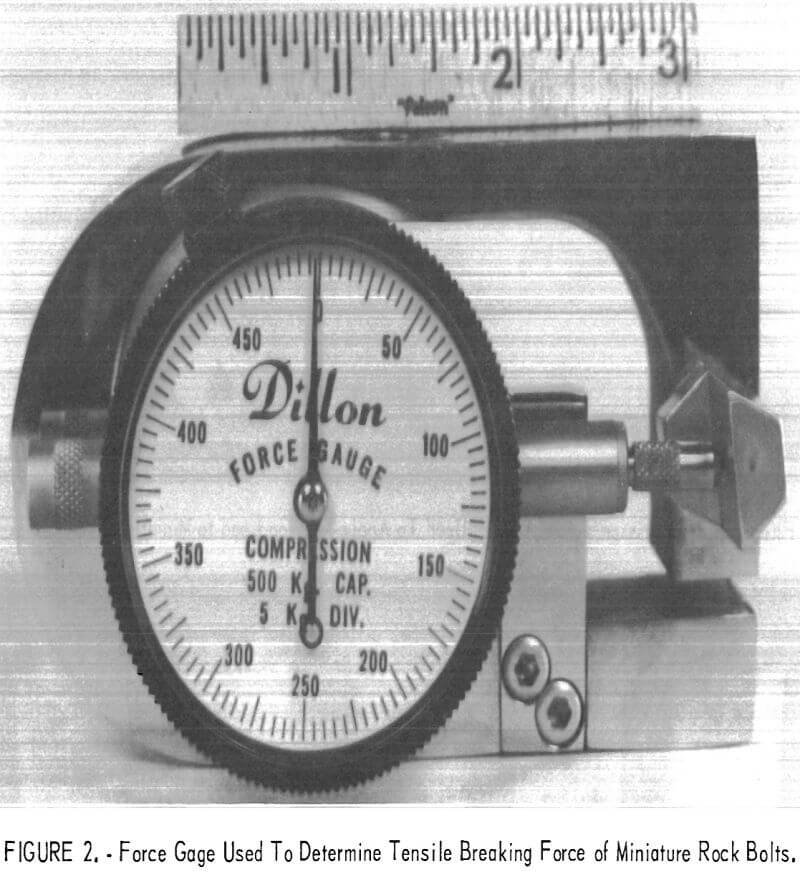
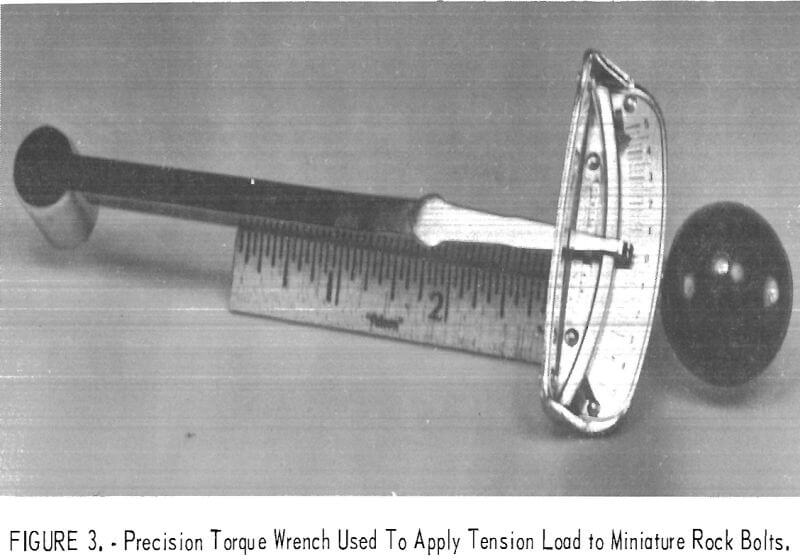
the miniature rock bolts was found to be 150 pounds as determined by the Dillon force gage shown in figure 2. Thus the tensile strength is 49,000 psi based on a bolt cross-sectional area of 0.00306 in². A tension load of 80 pounds per bolt was applied by means of a precision torque wrench as shown in figure 3. The average shear strength of the miniature rock bolts as determined by laboratory tests was 100,000 psi.
Figure 4 displays a set of 5 rock-bolted sandstone samples with natural fractures oriented at approximately 45° from the core axis.
Calibration Procedures for Wire-Rope Study
Piano wire with a 0.033-in diameter was used to simulate the wire rope. The average tensile breaking force of this simulated wire rope was 272 pounds.
Equation 17 shows that for wire roping to have a significant effect on the strength of pillars, the quantity T’N/DLSf [sin 2β + µf (1 + cos 2β)] should
be as large as practical, so that the normalized ratio Cf”/Cf will be large. The maximum value of the expression in the brackets occurs when cot 2β = µf. Thus wire roping is most effective for critically oriented planes of weakness. For T’N/DLSf to be large, the tensile force in the rope and the number of ropes should be as large as practical. Therefore for the model pillars it was decided to make T’ = 100 lb and N = 10. This force (T’ = 100 lb) was pretensioned in the wires by means of modifying the Dillon force gage. Thus for a pillar 5.25 in long, the spacing Δo of the ropes is ½ in.
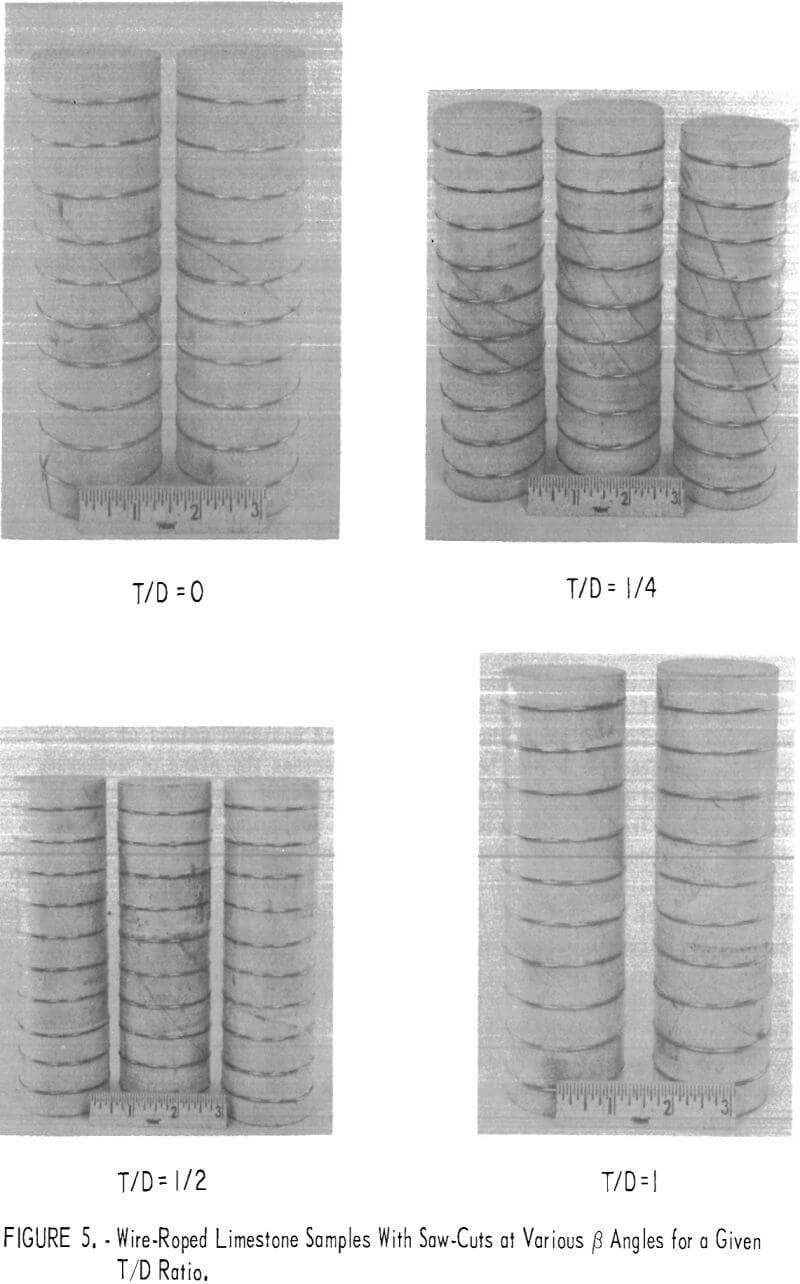
Figure 5 shows wire-roped limestone specimens with saw-cuts at (3 angle values ranging from 30° to 60° and T/D (thickness to diameter) values from 0 to 1.
Data and Analysis
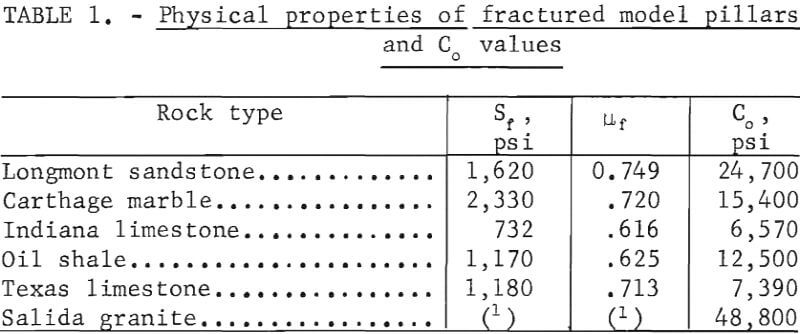
Some physical properties of the fractured model pillars are necessary in order to solve the equations given in the theory. Table 1 gives the values of Sf, µf , and Co of the rock types tested, where Co is the uniaxial compressive strength of the solid cores. Salida granite values of Sf and µf are not available because of the difficulty in testing these cores with a plane of weakness oriented at 45°.
Rock-Bolt Study
A total of approximately 81 bolted and unbolted samples of 4 rock types were tested. Table 2 shows the theoretical and measured values of the strength increase for 5 rock bolts tensioned across the plane of weakness. The theoretical strength increase was calculated from equation 12. This value differs from the measured values by the following amounts: 58 pct for the sandstone, 13 pct for the marble, 2 pct for the limestone, and 6 pct for the oil shale. The comparison of the theoretical and measured values is good in view of the fact that a natural variability of 10 to 15 pct is inherent for the strength determinations for the rock samples without rock bolts. What is more important than the comparison of the theoretical and measured values is the fact that a significant increase in strength can be effected by the use of rock bolts.
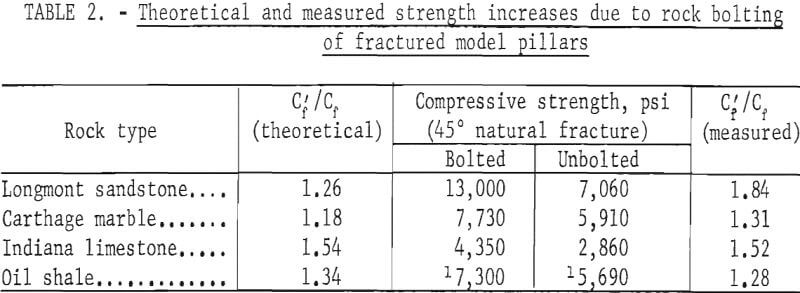
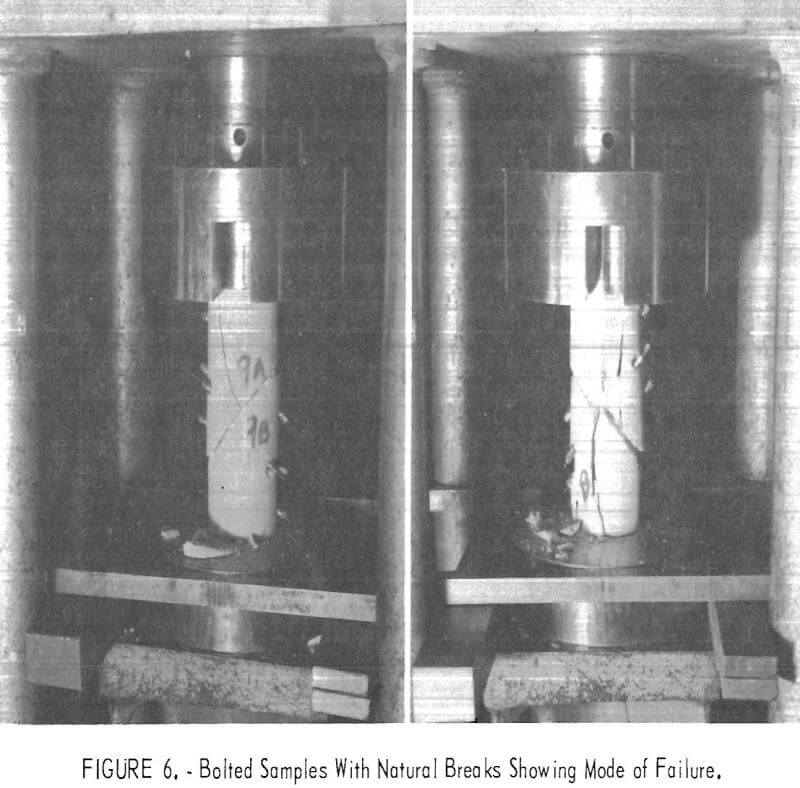
Figure 6 illustrates two examples of bolted specimens with natural breaks, with both specimens taken to failure. The mode of failure in each specimen indicates that major cracks form first along the weakness plane in a direction normal to that plane. As the cracks grow, their direction gradually approaches parallelism with the maximum principal applied stress. A rock-bolted oil shale specimen with a saw-cut at 45° to the applied stress axis taken to failure is shown in figure 7. Again, the predominant crack growth direction is parallel to the applied stress axis.
An additional series of tests was performed to assess the effectiveness of rock bolts attached at an angle other than normal to the fracture surface. These tests were performed on the marble and sandstone with some bolts oriented at angles as much as 20° from the normal to the plane of weakness. The results of these tests indicated that the orientation of the bolts from 0° to 20° from the normal to the plane of weakness had no significant effect upon the strength of the bolted pillar.
Wire-Rope Study
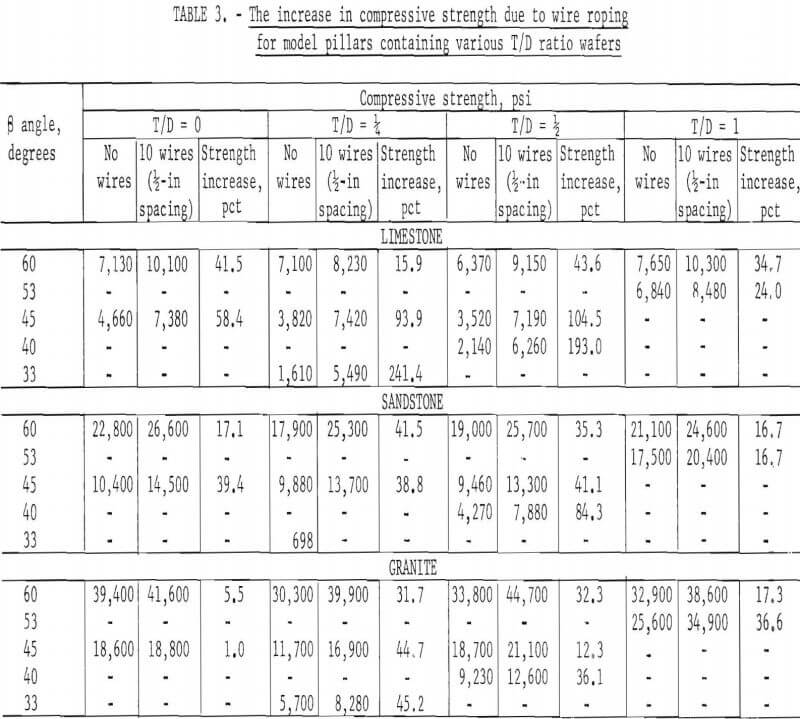
Approximately 200 wire-roped samples of Texas limestone, Longmont sandstone, and Salida granite were tested. Table 3 shows the results of the tests with each value in the table representing an average of at least 5 tests. These results show that in general the most benefit from wire roping

is obtained when the planes of weakness are nearly critically oriented (about 33°). The few exceptions in table 3 are within the limits of natural rock variability. Two other conclusions can be drawn from the results of table 3: (1) The weakest rock, limestone, exhibits the largest strength increase due to wire roping; and (2) in all instances, wire roping is effective in increasing the rock strength.
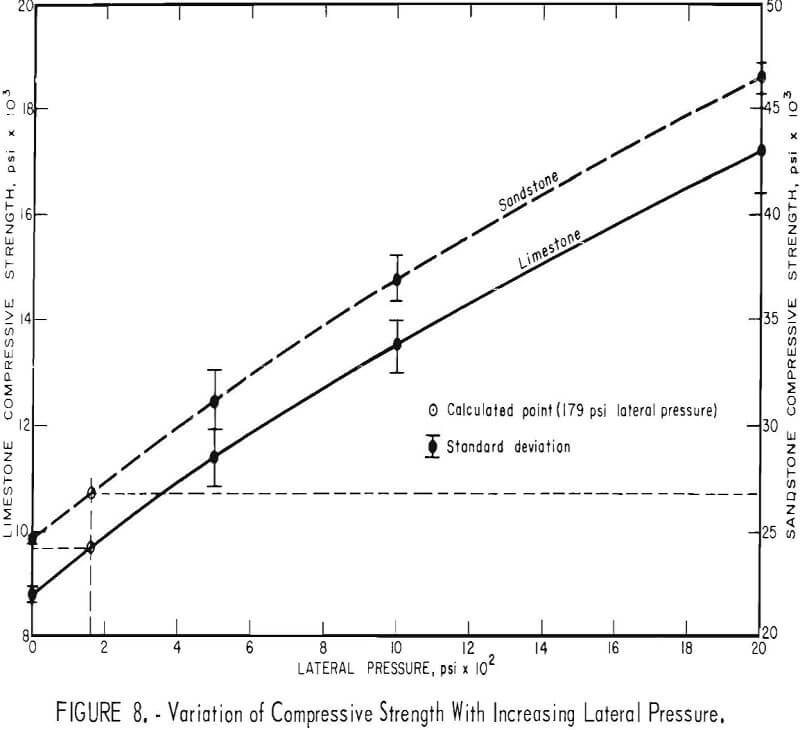
It is well documented that the compressive strength of rocks increases with confining pressure. Variation of the compressive strength with confining pressure of two of the rock types tested is plotted in figure 8 and the values are given in table 4 together with the standard deviation. If equation 15 is used with N = 10 and T’ = 100 pounds, the wires produce an effective confining pressure (σ3) of 179 psi. The lateral pressure of 179 psi, as shown on figure 8, produces strength values of 9,600 and 26,700 psi for the limestone and sandstone, respectively. These values are 9 and 8 pct greater than the Co values of limestone and sandstone, respectively. These increases were verified by experimental testing, but again fall into the 10- to 15-pct range of natural rock variability. However, as a first-order approximation, equation 15 would appear valid and correct.

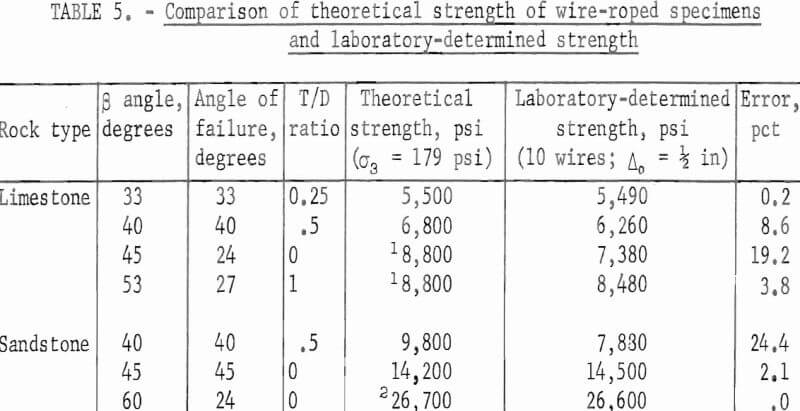
To check the validity of equation 16 to predict the strength due to wire roping of pillars of rock containing a plane of weakness, a few of the values of table 4 were compared to the theoretical strength as determined by equation 16 and are listed in table 5. T/D values as close to 0 as possible were chosen, since the theory was developed with a single plane of weakness, or T/D = 0. These results indicate a maximum error of 24.4 pct for the sandstone with a β angle of 40° and a 19.2-pct error for the limestone with a β angle of 45°. Therefore, as a first-order approximation of the strength, equation 16 would appear valid and correct. All other comparisons of the theoretical strength against the laboratory determined strength are excellent; error values range from 0.0 to 8.6 pct.
Finite Element Analysis of the Wire Rope Experiments
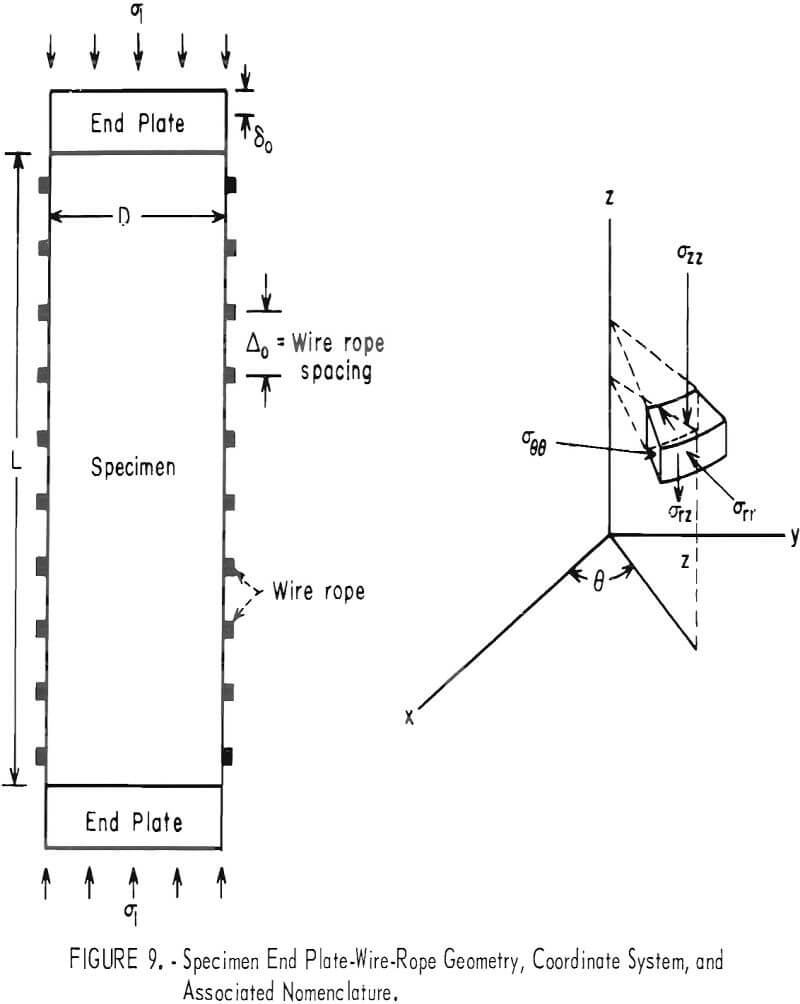
A finite element analysis of the wire-rope experiments was performed to check the validity of the value of the effective confining pressure approximation brought about by the wire roping. Figure 9 illustrates the specimen-wire rope-end plate geometry and the coordinate system nomenclature used in this analysis. The length and diameter of the specimen are denoted by L (L = 2b, b is the half-length of the specimen) and D (D = 2a, a is the specimen radius), respectively. The distance between successive wire ropes is denoted by Δo. A constant displacement of magnitude δo is applied to the end plates to approximate the conditions existing in laboratory studies of a specimen loaded between rough steel end plates.
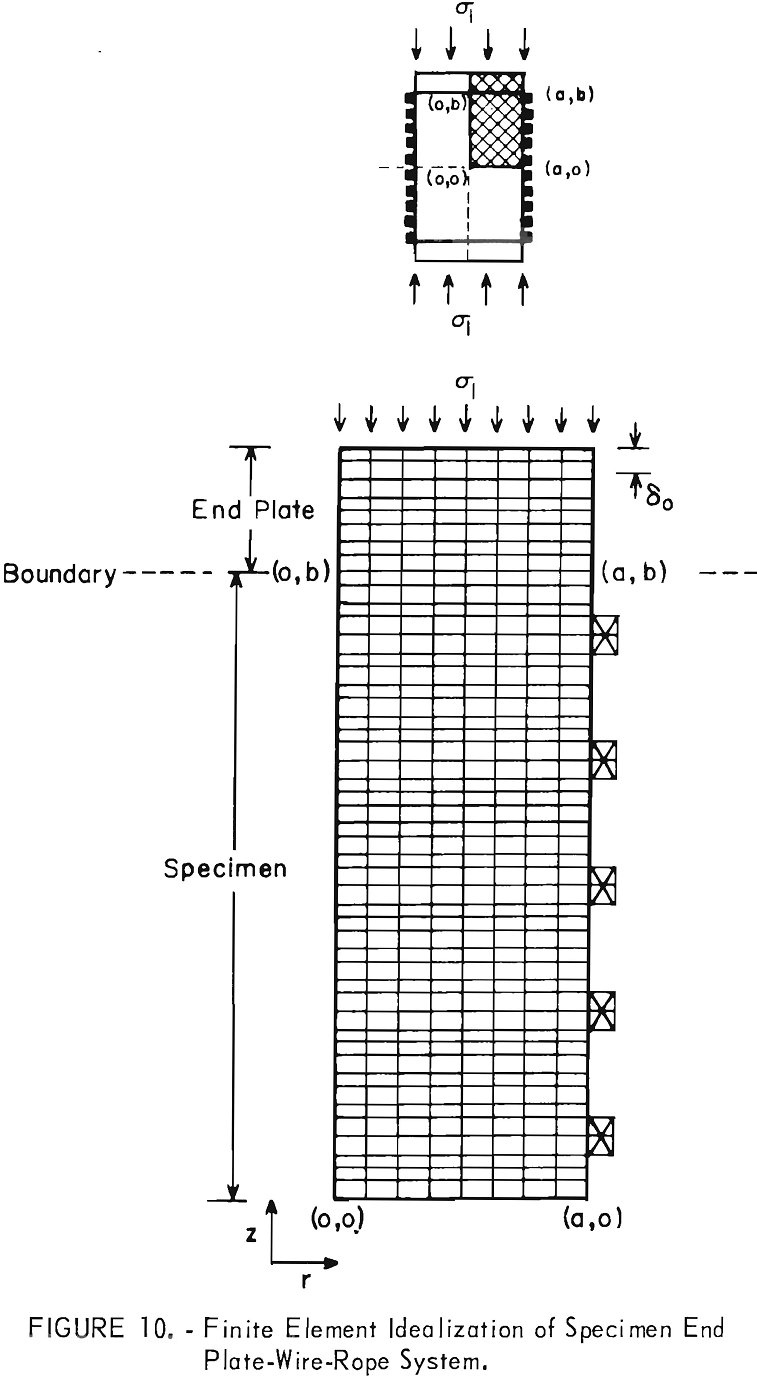
The three-dimensional, axisymmetric, finite element method of solution was used to determine the effective confining pressure in a cylindrical specimen with an L/D value of 2.50, wrapped with steel wire ropes pretensioned to a 100-lb force. The whole system was compressed uniaxially between rough steel end plates of L/D value equal to 0.25. Figure 10 shows the finite element idealization of the problem. The Young’s modulus and Poisson’s ratio for the specimen were chosen as 5 x 10 6 psi and 0.24, respectively; and for the end plate, 30 x 10 6 psi and 0.30. The material properties of the wire
are the same as the end plates. Four different spacing distances between the wire ropes were considered; namely, Δo = ¼ in, Δo = ½ in, Δo =1 in, and no wire ropes (Δo = L). For brevity, only the cases where Δo = ½ in and Δo = L are discussed in detail.
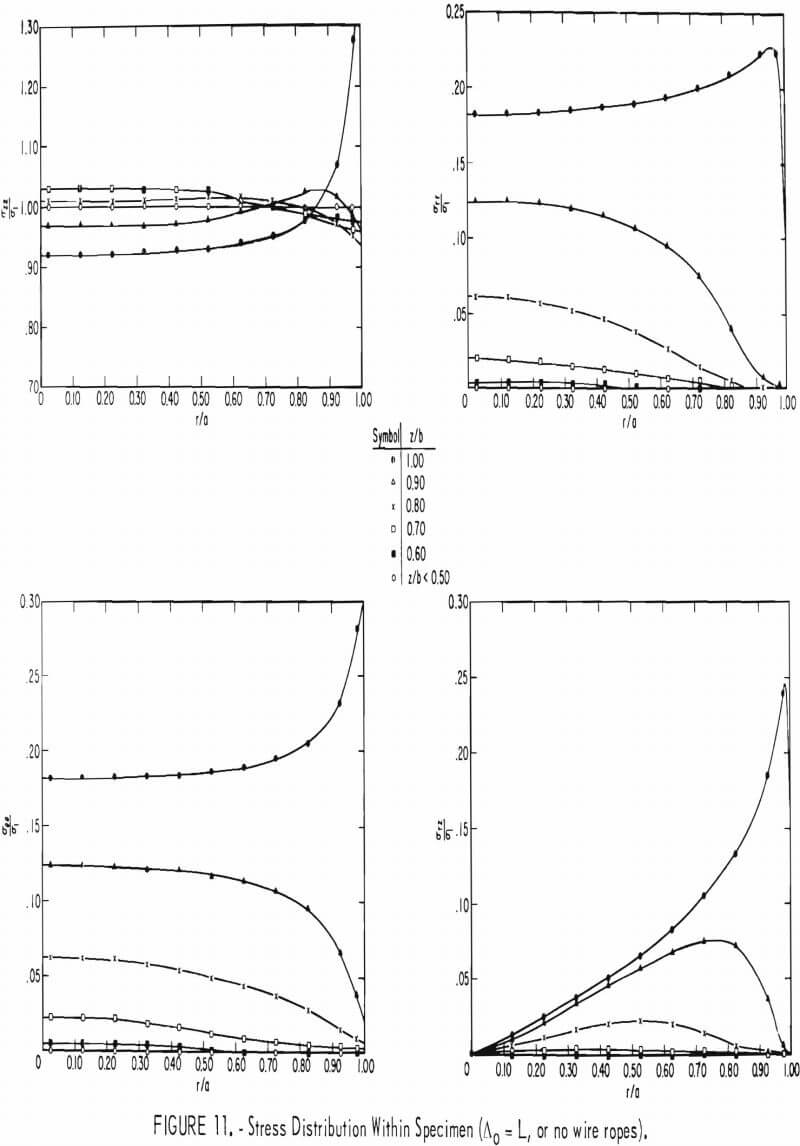
Figures 11 and 12 illustrate the variations of the axial stress (σzz), radial stress (σrr), tangential stress (σθθ), and shear stress (σrz ), with the radial (r/a) and axial (z/b) directions for spacing distances (Δo) between adjacent wires equal to L (no wire ropes on specimen) and ½ in, respectively. The symbol Δ figure 12 represents a distance within any two adjacent wires, that is, 0 ≤ A ≤ Δo.
A detailed discussion of the stress distribution in a test specimen compressed between rough steel end plates with no wire ropes (Δo = L) on the specimen has been published elsewhere. There are only two results of
importance to the present analysis: (1) Nearly 70 pct of the specimen can be considered to be under a uniform state of stress, and (2) the average confining pres-sure in the specimen due to end effects is negligible. The magnitude of this pressure is found by averaging the sum of the radial and tangential stress throughout the entire specimen and dividing the result by two. Figure 12 shows the stress distribution in the specimen in the region between two adjacent wire ropes near the central portions of the specimen (0 ≤ z ≤ 0.50 in). End effects due to the steel end plates are nonexistent at this position. The results of the finite element study showed that there was no increase in stress in the wire ropes due to deforming the test specimen. The location Δ/Δo equal to 0 or 1.00 corresponds to a wire-rope position. The effect of using wire ropes pre-tensioned to a 100-lb force can be seen to result in a somewhat uniform radial and tangential stress distribution within the interior portions of the specimen (0 ≤ r/a ≤ 0.50). The radial and
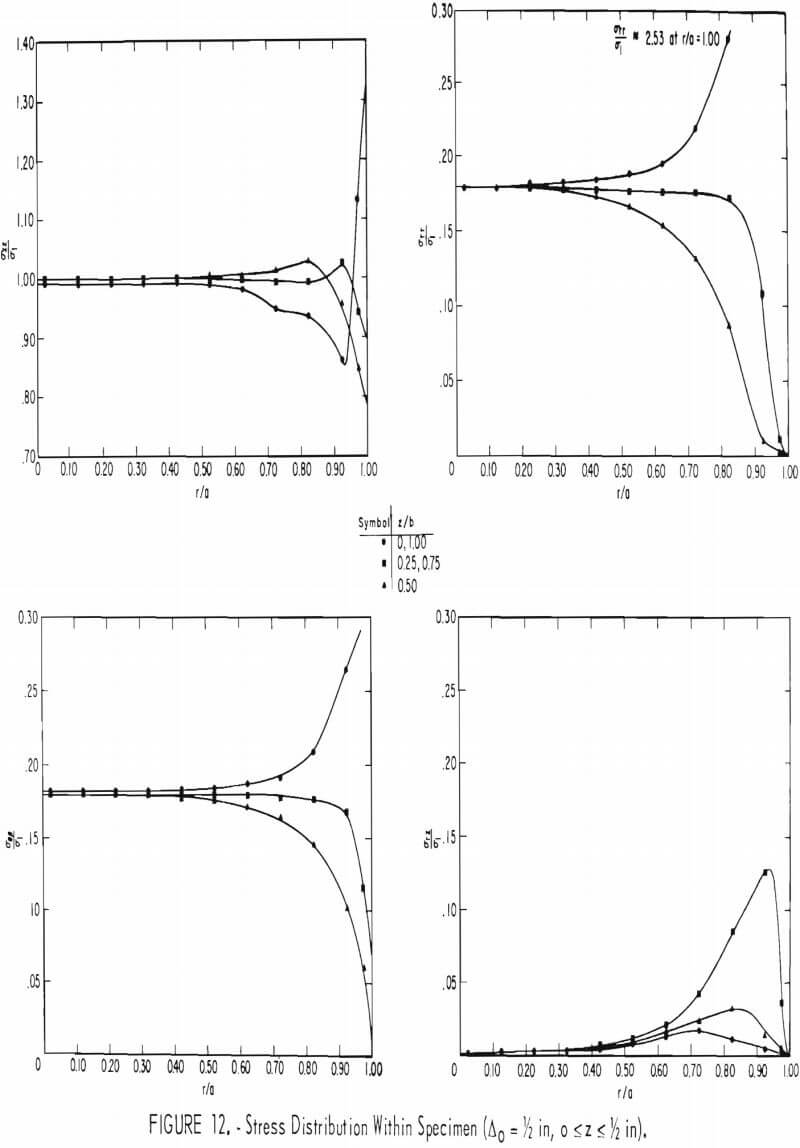
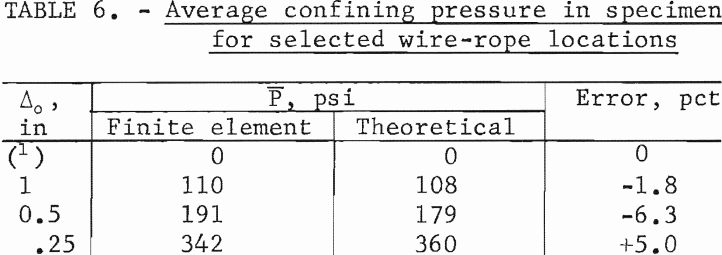
tangential stresses approach zero at the specimen boundary (r/a = 1.00), except at the wire-rope locations (Δ = 0, Δ = Δo. At the wire-rope locations, both the radial and tangential stresses appear to approach the value 2.53 σ1, where σ1, the stress existing in the specimen when no end effects are present, is equal to 1,120 psi. This value of σ1 is found by averaging the axial stress across the specimen. Table 6 shows the average confining pressure in the specimen for the wire-rope spacings considered in this study. The theoretical values obtained from equation 10 are shown for comparison. The maximum error between the theoretical and finite element average confining pressure value amounts to only 6 pct. This result shows that equation 15 can be used with confidence in estimating the mean confining pressure due to wrap¬ping pretensioned wire ropes around a cylindrical specimen.
Conclusions
The results of this research would indicate that the use of rock bolts and/or pretensioned wire rope can have a significant effect on the compressive strength of model pillars containing a plane of weakness. Equations for the strength increase of the fractured model pillars which were developed using the Coulomb failure condition for both the case of steel rock bolts and pretensioned steel wire ropes give magnitudes of the compressive strength increase in accord with experiment.
The effect of installing tensioned rock bolts normal to the plane of weakness of the model pillar is shown to be equivalent to increasing the shear resistance along the plane of weakness. The strength increase depends upon the shear strength of the rock bolt, the tensile stress in the rock bolt, the ratio of the cross-sectioned area of the bolt to the area of the weakness plane, and the number of bolts installed. Pillars with critically oriented planes of weakness and with the lowest shear strength values show the largest strength increase, for either rock bolting or wire roping. This strength increase is primarily due to the shear strength of the steel bolts which is at least an order of magnitude greater than the shear strength of the rock (Sf).
The effect of wire roping a model pillar is shown to be analogous to applying an effective confining pressure over the specimen surface. The value of the effective confining pressure is dependent upon the tensile force in each wire and the total number of wires.
The ability to obtain a first-order approximation of the increase in strength of pillars containing planes of weakness by the use of roof bolts and/or wire rope enables one to arrive at a more realistic strength value to be used in the stress analysis of a room-and-pillar mining system.
