Table of Contents
Heap leaching is a simple means of recovering copper from oxide and oxide-sulfide ores. Although this method requires relatively low capital investment, it suffers from low copper recoveries and relatively high acid consumption. The objectives of this study were (1) to determine what factors influence these shortcomings, and (2) to establish a basis of correlation between laboratory and field testing.
The principal methods of leaching copper ores at the present time are heap, dump, in-place, and vat. A number of references are presented in the bibliography on the theoretical and practical aspects of these methods.
In the heap-leaching method, crushed or uncrushed oxidized copper ore is placed on a prepared drainage pad. Acid leach solutions are distributed over the top of the heap, caused to percolate downward through the ore bed by gravity, and are drained from its base. The leach duration is generally a matter of a few months.
Dump leaching is used to recover copper from very low-grade oxide-sulfide pit-waste materials. Here again, leach solutions are percolated downward through a heap. However, in this method, little or no acid is added to the leach liquors prepared drainage pads are not used and the leaching cycle is generally measured in terms of several years. Leaching agents are usually autogenously generated by the breakdown of sulfide minerals within the dump.
In vat leaching, oxide or oxide – sulfide ores are crushed and then leached in large vats with prepared leach solutions. Following a rinsing cycle, the leached residue is discarded or further treated by flotation to recover the sulfide copper minerals.
Each of these methods has its advantages and disadvantages. Heap leaching is generally characterized by low copper recoveries and high reagent consumptions. Its main advantage is its simplicity and low capital investment requirements. Although the dump and in-situ leaching methods are generally wasteful in terms of the amount of copper recovered, they nevertheless serve as economical means of recovering copper from material that is below a grade that can be processed by any other known method. Vat leaching has the advantage of obtaining high copper recoveries at relatively low reagent consumptions and the disadvantage of comparatively high capital investment and operating costs.
Heap leaching is used in a few commercial applications. The most notable operations are those of Rancher’s Exploration and Development Company’s Bluebird mine operation near Miami, Arizona, McCallister Fuel Company’s Zonia mine near Prescott, Arizona, and Zontelli Western Mining Company’s operation at Page, Arizona. Sheffer and Evans have presented a good review of heap, in-situ, and dump leaching practices in the western United States.
A review of the literature (see bibliography) has shown that some experimental work has been done on the chemical and physical factors involved in heap leaching. Almost 40 years ago, Sullivan et al investigated several facets of heap leaching systems. Their work included studies on wet charging, agglomeration, factors governing the removal of soluble copper from leached ores, factors governing the entry of solutions into ores during leaching, the effect of acid strength in leaching, and the dissolution of various minerals in sulfuric acid or sulfuric acid ferric sulfate solutions. More recently, Seidel wrote concerning percolation leaching, and McKinney and Rampacek discussed laboratory and field heap-leaching tests.
In this study, several different types of copper oxide and oxide sulfide ores have been tested under laboratory conditions and two ores have been tested under field heap-leaching conditions. Areas of study include (1) what constitutes an ultimate economic recovery, (2) the effect of time of contact, particle size, solution strength and type, and ore and gangue mineral species type on the ultimate economic recovery, (3) the effect of large-scale field conditions on leaching results, and (4) the correlation between laboratory tests and large field tests.
Experimental
Leaching studies were conducted on coarse oxide and sulfide copper ores in small laboratory columns and in large concrete columns in the field. These studies were designed to determine the influence of various chemical and physical parameters on heap leaching and to establish a correlation between laboratory and field testing.
Ores used in this Study
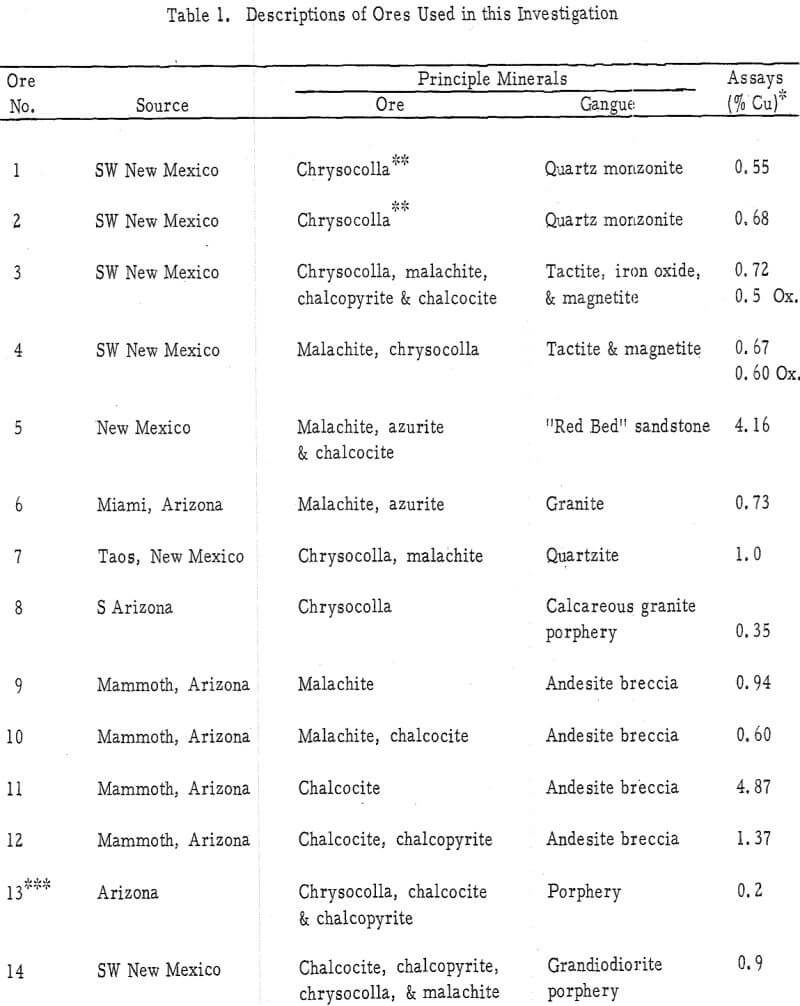
Several different types of oxide and sulfide copper ores were tested in this study. Table 1 gives a description of these samples.
Assaying of Samples
This study required that a large number of copper, ferrous and ferric iron, and free-acid analyses be made. Copper samples were analyzed by means of an atomic adsorption spectrophotometer, and ferrous and ferric iron samples were analyzed by the standard dichromate titration methods. Free-acid analyses, however, were not so simple. Almost all of the standard techniques that were tested were found to be very unreliable on these leach liquors. Reasonably good results, however, were generally obtained with the U. S. Bureau of Mines BaCl2 addition, NaOH titration method.
At a relatively late date in this study, an extremely simple, and yet accurate, method was developed for determining the free-acid content of liquors containing hydrolyzable ions. As this technique may have considerable application outside the scope of this study, it is presented separately in the appendix.
Laboratory Studies
The majority of the laboratory testing work was done on a chrysocolla ore from southwestern New Mexico to establish the effects of leaching time, particle size, and solvent strength on the rate of leaching and on the ultimate economic recovery. Additional testwork was then carried out on several other types of oxide and sulfide copper ores to see if these ores responded to leaching in a like manner.
Procedures Used in Laboratory Studies
Column leach tests were used as a laboratory means of studying heap leaching. In these tests, crushed or uncrushed ores were treated by either upward or downward percolation of leach solutions within 3-½-inch-diameter by 4-foot-high, vertically mounted, plastic columns. Figure 1 is a picture of two of these columns set up for upward (left) and downward (right) percolation tests. In the downward-percolation tests, solution was added at the top of the ore bed and allowed to drain through it and out of the bottom of the column. In upward-percolation tests, solution flowed by gravity into the bottom of the column, up through the ore bed, and out of the system via a port in the side of the column. Effluent solutions were measured and analyzed daily in each method. In the upward-percolation column tests, each ore bed was removed from its column, mixed, and replaced daily to prevent the surface occlusion of large particles by slimes.
Experimental Data
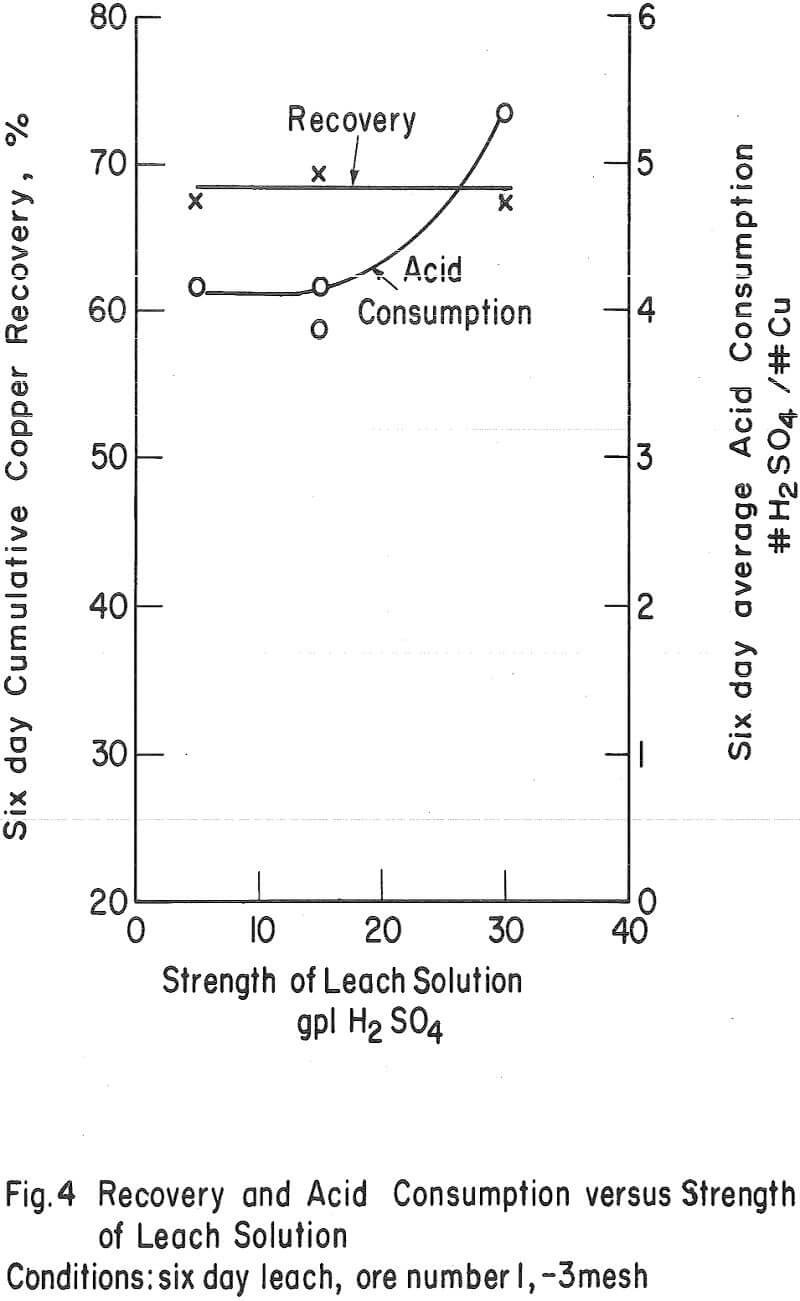
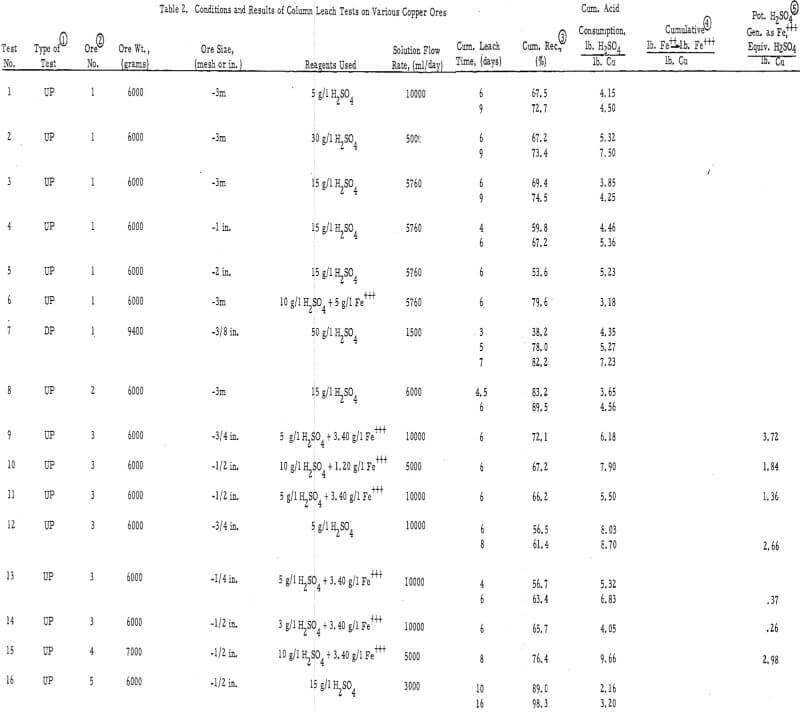
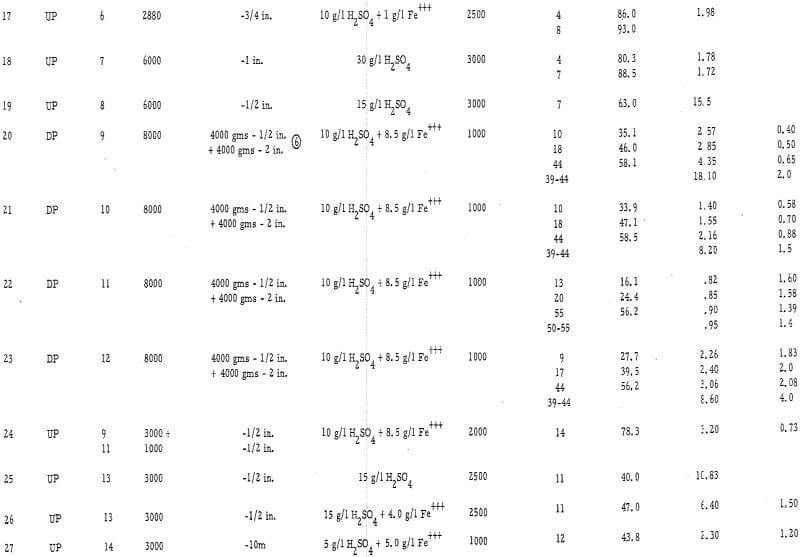
The experimental data are presented in table 2 and in figures 2, 3, and 4 (see appendix for all tables and figures).
Discussion of Experimental Results
An important concept in the acid leaching of coarse ores is that of the ultimate economic recovery, or that degree of leaching where the cost of reagent outweighs the net value of the metal recovered. Some of the factors that influence this recovery are: (1) the duration of the leach, (2) the average particle size, (3) the solvent strength, (4) the presence of ferric iron in the leaching solvent, (5) the ore mineral species, and (6) the gangue mineral species. Each of these parameters was studied in this laboratory investigation.
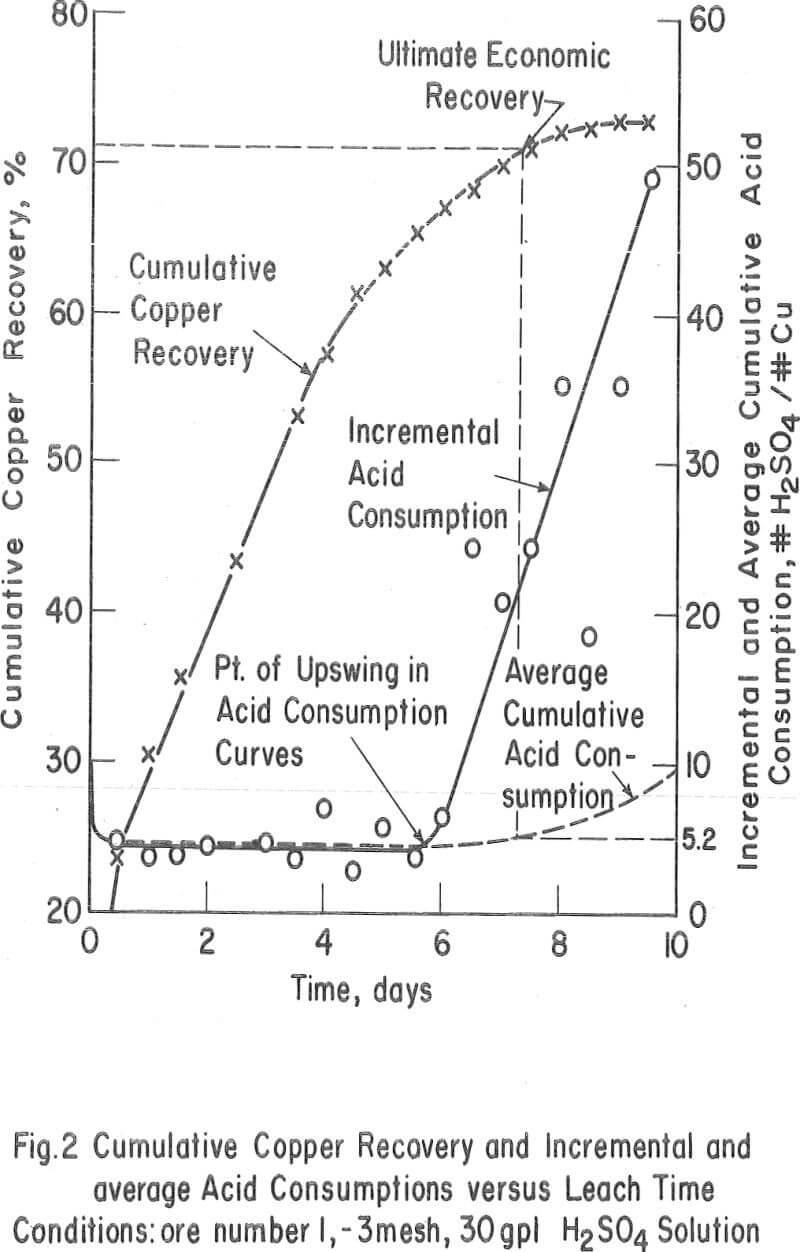
The Ultimate Economic Recovery – Figure 2 graphically shows how the ultimate economic recovery is determined. In this figure, the leach duration, or time of leach, is plotted versus the copper recovery, the daily, or incremental, acid consumption, and the average cumulative acid consumption. All acid consumption values are in terms of the pounds of acid required to dissolve one pound of copper. In this test, a minus-3-mesh oxide copper (chrysocolla) ore with a quartz monzonite gangue was leached with sulfuric acid under constant conditions for a period of 10 days. The recovery curve shows that the rate of copper dissolution was high during the first 4 or 5 days of leaching, decreasingly lower during the next 2 or 3 days, and almost zero thereafter. The incremental acid consumption was high during the first few hours of the leach, constant and low up to 6 days of leaching (about 60 percent recovery), and increasingly high beyond this point. The high incremental consumption of acid at the start of the test was probably due to the presence of a small amount of readily soluble carbonate minerals in the ore. The average cumulative acid-consumption curve remained fairly constant up till the 6-day point, and then curved upward at a rather gentle angle compared to that of the incremental acid- consumption curve. The ultimate economic recovery occurred at that point in time that corresponds to the intersection of the average cumulative acid consumption curve and a pre selected maximum acid consumption value. In this case, the ultimate economic recovery was 71 percent in 6-¾ days, at a preselected acid consumption of 5.2 pounds of acid per pound of popper.
The acid consumptions curves for the oxide copper ore (number 3) with a high iron oxide-tactile gangue were somewhat different than those of oxide copper-porphery gangue ore number 1. In tests 9 through 14 the incremental acid curves were generally low at the start, fairly high after 3 to 4 days of leaching, and very high thereafter. The point of upswing of the acid-consumption curves was not so well defined with this ore as it was with ore number 1 or with others (2, 6, 8, 9, 10, 11, 12, 13, and 14) containing igneous-type gangues.
The ultimate economic recovery is the optimum recovery that is obtainable under a given set of leaching conditions. Primarily, this value is dependent on the relative rates at which the copper minerals and the gangue minerals in the ore dissolve under a given set of leaching conditions and the minimum acid-consumption value that is selected as an economic cutoff.
From a practical standpoint, there are many chemical and physical reasons why an optimum recovery is seldom, if ever, attained throughout all parts of a heap. For instance, there may be an over- leaching or an under-leaching of an ore due to poor ore-solution contact or to an inadequate or excessive supply of acid to various segments of the leach heap during the leaching period. The ore may be too coarse, or the ore or gangue minerals may not be of a type that is conducive to good heap leaching. Losses of acid and copper from a heap-leaching system through seepage and poor rinsing may also lower the recovery.
Duration of Leach – The test data show that the time of upswing in the acid-consumption curves may vary according to the leaching conditions and the ore and gangue mineral species. In tests on crushed ores 1, 2, 3, 4, 6, 7, and 8, this point of upswing was within 5 to 8 days. These ores were primarily oxides. Tests 24, 25, 26, and 27, which were run on crushed (minus ½ inch or less) chalcocite or oxide-sulfide ores, required 8 to 16 days to reach this point of upswing in the acid-consumption curves.
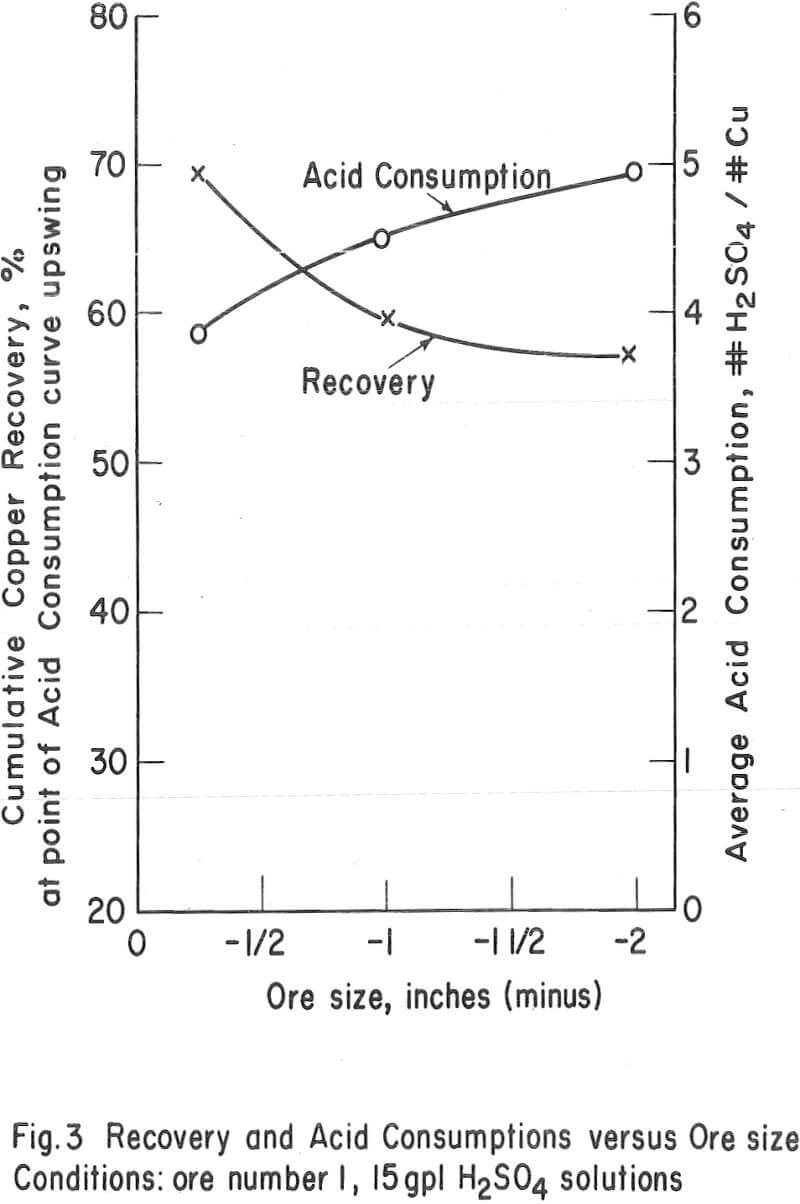
Particle Size – The average particle size appears to have a significant influence on the ultimate economic recovery of ores with igneous rock-type gangues. The curves of figure 3 (tests 3, 4, and 5 on the chrysocolla-quartz monzonite ore number 1) show that the average acid consumption increased and the recovery decreased, at the point of the acid-consumption curve upswing, as the average particle size of the ore increased. This relationship was also evident in the case of other ores with granitic or igneous gangues. For example, the recoveries at the acid-consumption upswing point were approximately 58 percent in tests 20 and 22 (minus-2-inch ores 9 and 11) and 78. 3 percent in test 24 (combination of minus-½-inch ores 9 and 11.)
The high-iron oxide gangue, oxide-copper ore number 3 appeared to respond to leaching in a manner that was the complete reverse of that of the above -mentioned tests. In this case (tests 13, 10, and 9), the recovery in 6 days of leaching increased and the net consumption of acid (cumulative acid consumption minus potential H2SO4 produced as Fe+++) in 6 days of leaching decreased as the particle size increased from minus ¼ inch to minus ¾ inch. Several factors, however, may have influenced this relationship, i. e. , the indefinite upswing point on the incremental acid-consumption curve; the production of ferric sulfate from acid; the relatively high content of copper sulfides in the ore; the porous, relatively soluble nature of the iron oxide gangue minerals; and the natural tendency of the ore to be reduced in grain size by the leaching solvent.
Strength of the Leaching Solvent – The strength of the leaching solvent appeared to have more effect on the ultimate acid consumption of an ore than on the recovery. Figure 4 shows the effect of varying the acid strength on a chrysocolla-monzonite-type ore. In this case, the recovery in 6 days of leaching remained essentially constant and the acid consumption increased as the acid strength of the leaching solvent increased above 15 gpl H2SO4. This was also the case when the ore with the high-iron oxide gangue (number 3) was leached (tests 10 and 14) with relatively strong and weak acid solutions.
Presence of Ferric Iron in the Leaching Solvent – Ferric sulfate was found to be essential for oxidizing sulfide minerals and, when used in conjunction with acid on the oxide minerals, was found to substitute for acid and thereby reduce the ultimate consumption of acid. A good example of the use of ferric sulfate as a substitute for acid is test number 6. An exceptionally high recovery was achieved in this test at a very low acid consumption (3.18 pounds H2SO4 per pound of Cu as compared with 4 to 7 pounds H2SO4 per pound of Cu in tests 1 through 5). Likewise, tests 12 and 9 on the ore with the high-iron oxide gangue showed a significant reduction in the acid consumption when ferric iron was present in the leaching solvent.
Ore and Gangue Mineral Types – The ore minerals chrysocolla and malachite responded to leaching in much the same manner. The rates of dissolution were such that it generally took 4 to 8 days to reach the ultimate economic recovery on a minus ½-inch ore, regard¬less of the type of oxide mineralization present.
Chalcocite was much slower in dissolving and required a large amount of Fe+++ for efficient dissolution. It required approximately 40 to 60 days of leaching to reach the ultimate economic recovery on minus-2-inch chalcocite ores in tests 20 through 23, whereas in test 5, a minus-2-inch chrysocolla ore dissolved in 6 to 8 days.
The gangue minerals had a profound effect on the rate and degree of acid consumption and hence on the ultimate economic recovery. The porphery-type gangue minerals dissolved at a relatively high rate as compared to the copper minerals. This resulted in a medium acid consumption, a well-defined upswing point in the incremental acid- consumption curve, and a lower recovery with the coarser ores. In the case of the ore with the iron oxide gangue, most of the acid was consumed at a high rate in the leaching of the porous iron oxide gangue mineral. An excess of fines in this ore or a high-strength leaching solvent, resulted in high acid consumptions and somewhat lower recoveries. The ore with the insoluble quartzite gangue (number 7) was leached with very little acid, and once the soluble ore minerals were leached, the consumption of acid ceased. Because of the lack of a soluble gangue, this ore did not have an ultimate economic recovery. The ore with a calcareous gangue (number 8 in test 19) showed a high acid consumption throughout the test duration and a marked upswing in the incremental acid-consumption curve when the easily dissolved copper had been depleted.
Field Studies
Two large-scale heap-leaching tests were conducted on minus 6-inch ores number 1 and 2 in 4-foot-diameter by 16-foot-high concrete columns. The purpose of these tests was to determine the amendability of these ores to heap leaching and to establish a correlation between laboratory and field heap-leach testing.
Description of Leach Column and Operations
The two pilot-plant leach circuits each included a 4-foot-diameter by 16-foot-high concrete pipe column, a collection sump at the base of each column for pregnant solutions, a pregnant solution pump, a pregnant solution storage tank, a precipitation launder, a barren-solution storage tank, and a float-controlled feeder for on-solution.
The operation of the two test columns was as follows:
- Large samples of each of the two ores were mined, blended, and sampled prior to charging to their respective columns.
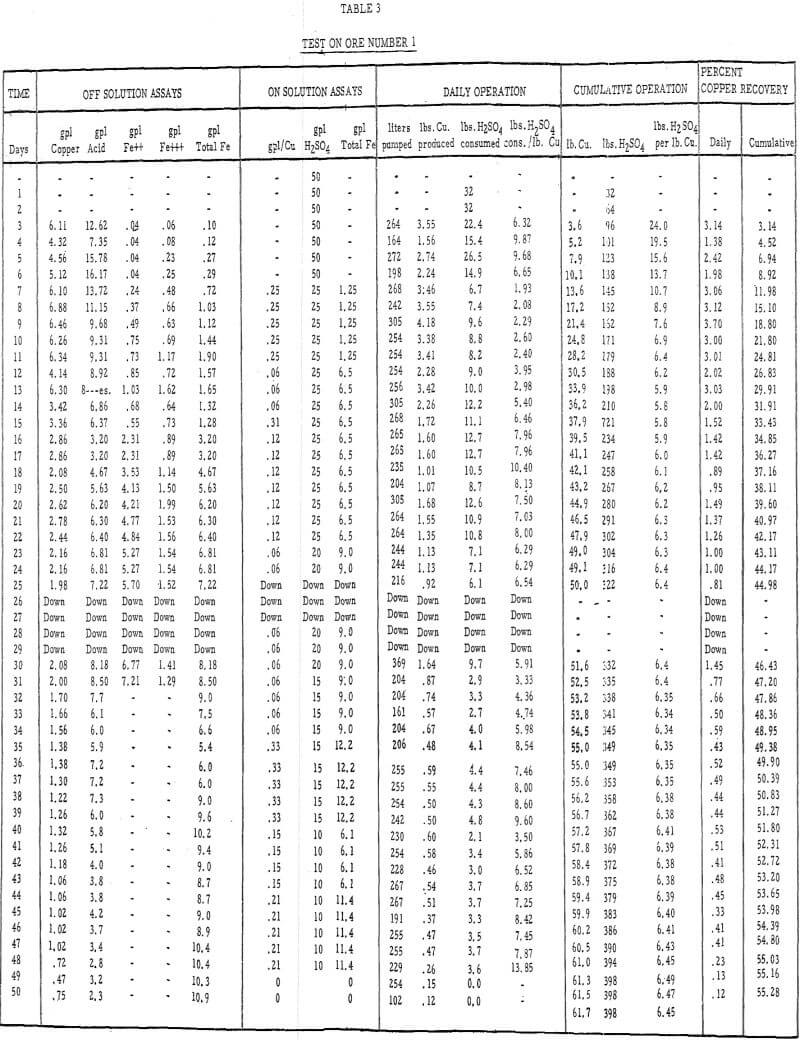
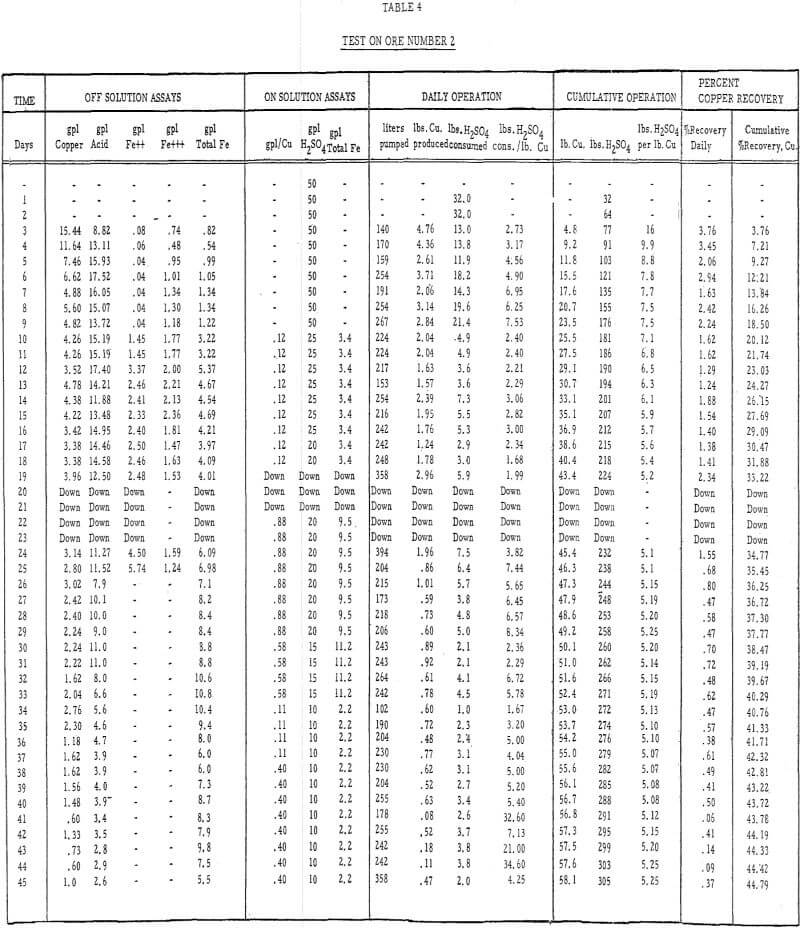
- Acid leach solution was distributed over the top of each column by a “weeping system” at the rate of 0.4 gallons per minute per 100 square feet of area., Tables 3 and 4 describe the strength of these solutions throughout the 50- and 45- day leach periods, respectively.
- Ores number 1 and 2 were leached for 50 days and 45 days, respectively. The test on ore number 2 was temporarily halted after 45 days of leaching, the charge was rested for 6 weeks, and solution was reapplied to determine the effect of a short rest period on the dissolution of copper and the incremental acid consumption.
- Pregnant leach liquors were periodically stripped of their copper content in the cementation launders and then, with more acid added, were recycled to the top of their respective columns as on-solutions.
- A balance was kept of the volume of solutions in the system and their copper, ferrous iron, ferric iron, and acid content.
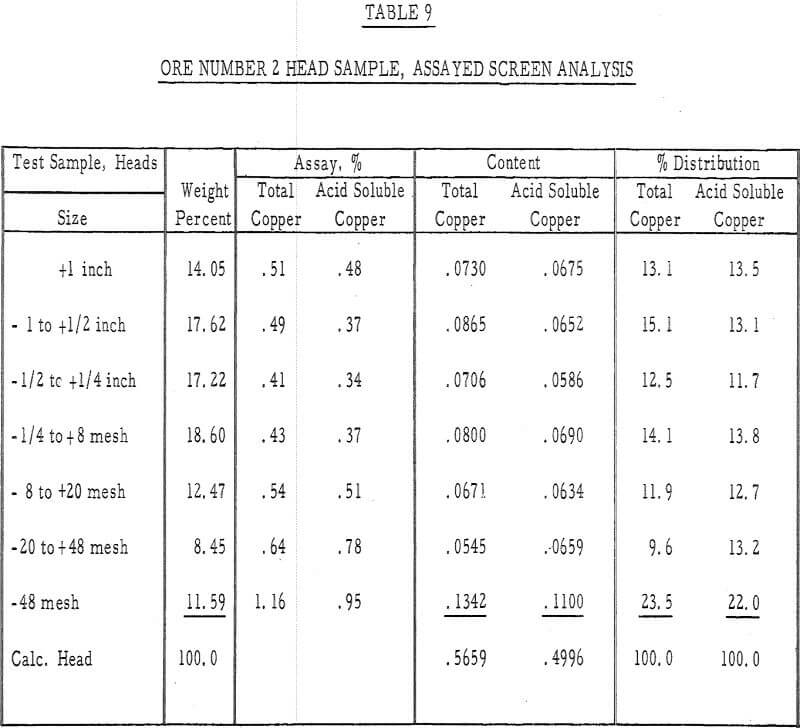
- The leached residues were removed from the columns and assayed for their copper content. Screen analyses were made on both residues and a column depth versus residue assay analysis was made on the residue of ore number 1.
Experimental Data
The test data are summarized in the following tables and figures:
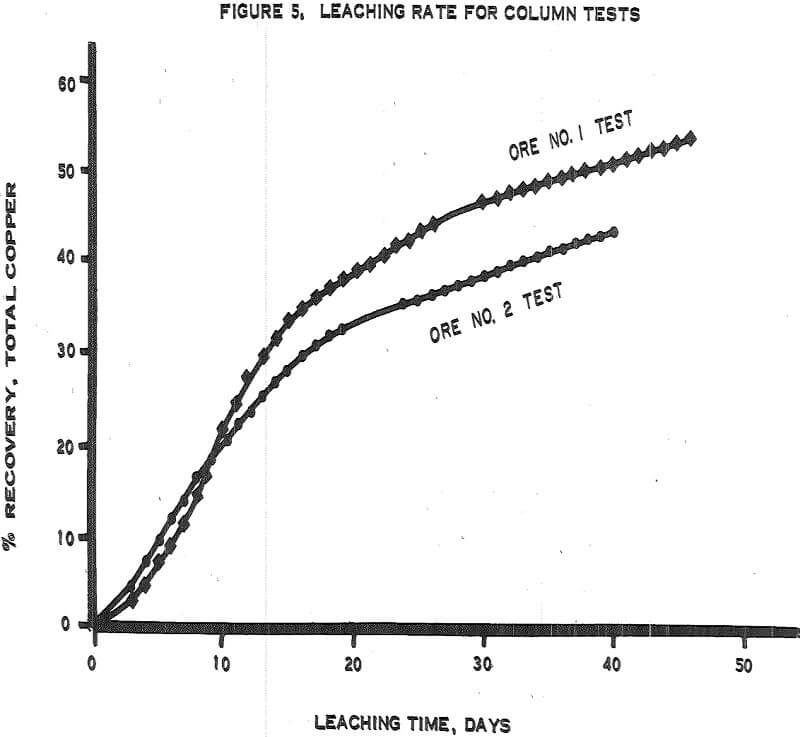
Figure 5 – Graph of leaching rates.
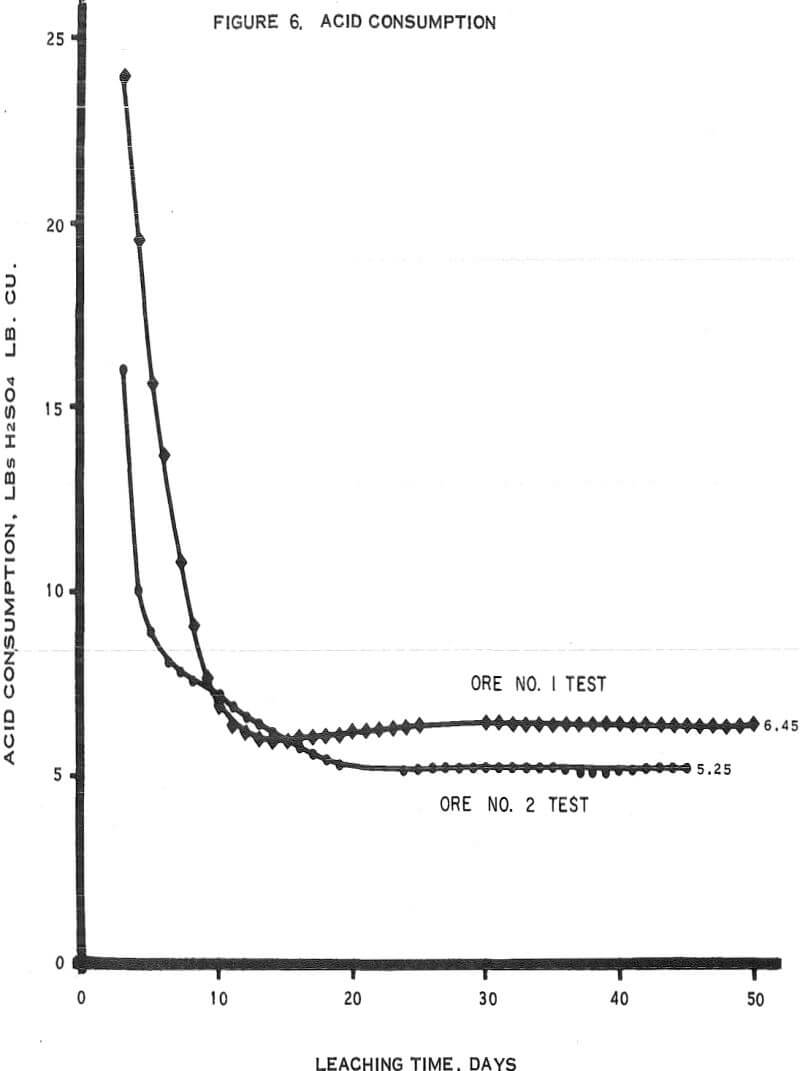
Figure 6 – Graph of acid consumptions.
Table 3 – Leaching data, ore number 1.
Table 4 – Leaching data, ore number 2.
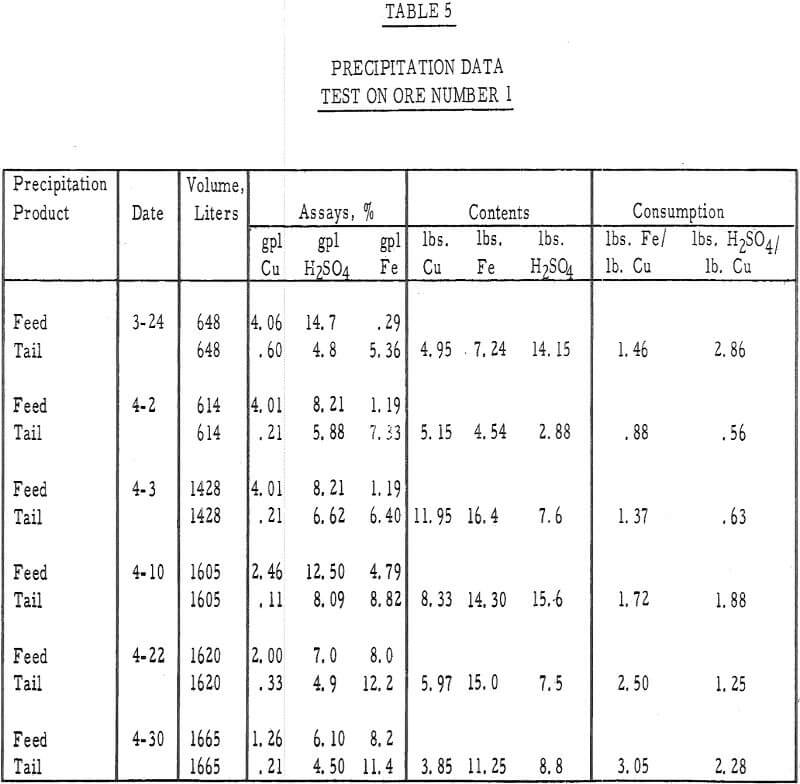
Table 5 – Precipitation data, ore number I.
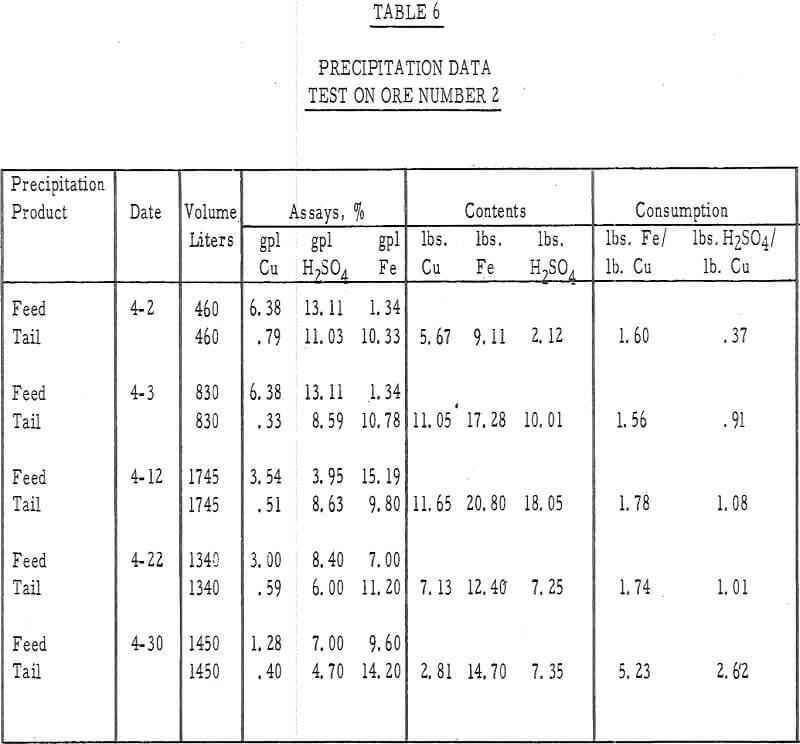
Table 6 – Precipitation data, ore number 2.
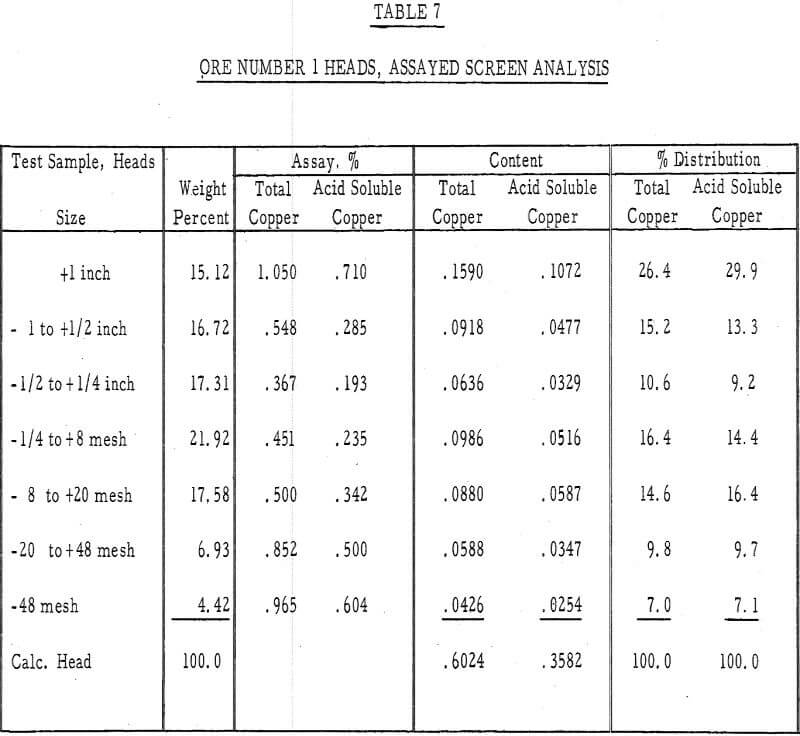
Table 7 – Assayed screen analysis, heads, ore number 1.
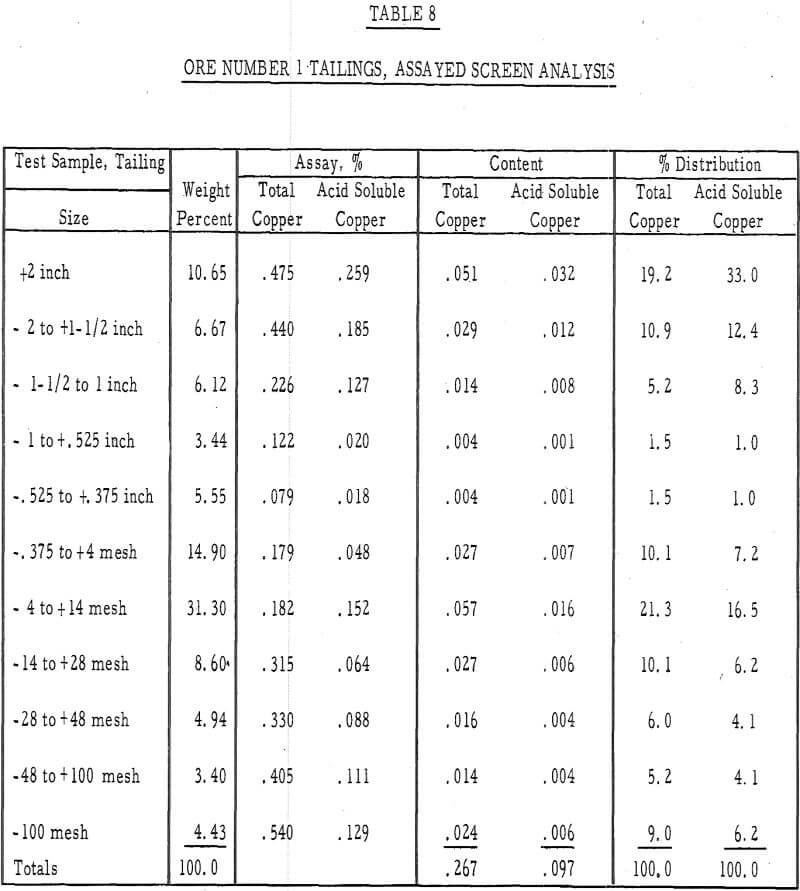
Table 8 – Assayed screen analysis, tails, ore number 1.
Table 9 – Assayed screen analysis, heads, ore number 2.
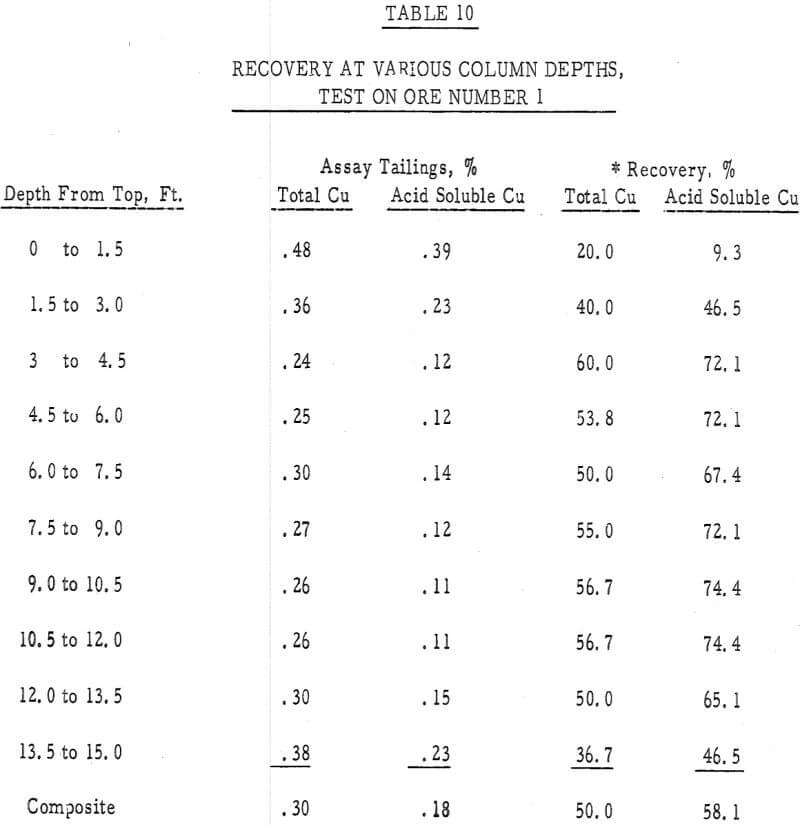
Table 10 – Tail assay with depth, ore number 1.
Experimental Results
The following observations have been made concerning the test data.
- The recoveries of copper from ores 1 and 2 (tables 3 and 4) were 55 percent in 50 days of leaching and 45 percent in 45 days of leaching, respectively.
- The initial leaching rates (figure 5) amounted to approximately 2 percent recovery per day for 14 or 15 days and then gradually dropped off to less than 0.5 percent per day.
- It was evident from the tailings assays (table 8) that most of the copper is leached from the fines. There was approximately twice as much acid-soluble copper left in the plus-1-½-inch fraction after 50 days of leaching as in the minus-48-mesh fraction.
- The recovery versus column depth data (table 10) indicated a less-than-average recovery had occurred in both the top and bottom 3 feet of this column. The low recovery in the top of the column was probably due to poor spreading of leach solution’s and that in the bottom of the column may have been a result of channeling, reprecipitation of copper values or an insufficient transport of acid to this depth. This over-leaching at the top of the column and a less-than-optimum amount of leaching at depth was also substantiated by a test run in the laboratory first. In this test a 4-inch column 16 feet high, was filled with minus 4-inch ore number 1 and leached for 30 days with a 30 gpl H2SO4 solution, added at the maximum rate that would percolate through the bed. A distinct decrease in recovery with column depth was also noted in this test.
- The average cumulative acid consumption (table 3 and 4) on ores 1 and 2 at the above-mentioned recoveries, were 6. 5 and 5. 3 pounds of acid per pound of copper dissolved, respectively. Approximately one pound of acid per pound of copper was also consumed in the cementation step.
- The incremental or daily consumption of acid per pound of copper dissolved (tables 2 and 3) was very high during the first 5 to 10 days of leaching, relatively low and constant for the next 30 to 35 days, and increasingly high during the last few days of each test. This upswing in the incremental acid consumption curves towards the end of each test indicates that the ultimate economic recoveries were either close to being attained or had been attained. Any additional copper that may have been leached from these ores would only have been possible at the expense of large amounts of acid per pound of copper recovered.
- The precipitation of copper on iron and the recycle of the spent solutions caused a buildup of iron to 10 grams per liter in the leach liquors. Essentially, all of the iron was converted to the ferrous state during precipitation and, after percolating through the 15-foot ore bed, was partially (about 20 percent) oxidized to the ferric state.
- The precipitation efficiency of the pilot plant cells was rather poor. Copper recoveries ranged from 75 to 95 percent, relatively large amounts of iron were required to precipitate the copper, large amounts of acid were consumed in the precipitation reaction, and the grade of the cement copper was only 60 percent. The high acid and ferric iron content of the pregnant leach liquors was probably responsible for much of this poor efficiency.
- As these tests were run in confined systems, there was no loss of pregnant solutions by ground seepage. Had there been a nominal loss (5 to 15 percent) of the pregnant solutions by seepage, as there often is in heap leaching, the ultimate economic recoveries would have been somewhat less than they were and the cumulative acid consumptions would have been considerably higher.
Estimation of Heap Leaching Results from Laboratory Studies on Crushed Ores
Some estimates can be made from a laboratory study conducted on crushed ore concerning the results of an actual full-scale heap leaching operation. The leach parameters on which projections can be made are (1) the time required to reach an ultimate economic recovery, (2) the ultimate economic recovery (before physical losses), and (3) the cumulative acid consumption at the ultimate economic recovery.
Time of Leach
The results of this study indicate that it takes about 8 times as long to heap leach a run-of-mine size oxide copper ore to its ultimate economic recovery as it does a crushed (minus ½, minus 1-inch, or minus 2-inch) sample leached by an upward percolation technique. Of course, this parameter depends to a considerable degree on the type of minerals being leached, the strength of the leaching solvent, the permeability of the heap, the degree of channeling present, and the depth of of the heap.
Ultimate Economic Recovery and Acid Consumption at the Ultimate Economic Recovery
A reasonable value for the ultimate economic recovery of a heap-leaching operation can be estimated from laboratory data. In this case, the ultimate economic recovery under laboratory conditions, on a minus-2-inch sample (test number 5) was approximately 65 percent at an acid consumption of 5.6 pounds of acid per pound of copper. The field test on the same ore gave an ultimate economic recovery of approximately 55 percent at an acid consumption of 6.5 pounds of acid per pound of copper recovered. The field values for the ultimate economic recovery and the acid consumption at this recovery were approximately 86 percent and 116 percent, respectively, of those that were obtained in the laboratory test on a minus-2-inch sample. These values do not, of course, take into consideration those losses that are attributable to the poor distribution of solutions over the top, on the sides, or within a heap; excessive channeling; seepage losses; etc.
Conclusions
This study examined some of the physical and chemical aspects of heap leaching copper ores with acid and acid-ferric sulfate solutions, and established a means for predicting field results. Some conclusions can be drawn from these observations concerning how heap leaching can be improved.
The incremental acid consumption per pound of copper dissolved was found to increase very rapidly once the readily available copper minerals were dissolved. This rapid increase in the relative consumption of acid places an upper limit on the economic recovery of copper from an ore of a given size and type. This recovery (herein referred to as the ultimate economic recovery) is highly dependent on the average particle size, the type of ore and gangue minerals present, and, to a lesser extent, on the strength and type of leaching solvent used and on various other physical factors such as the height of the leaching heap, the degree of contact achieved in leaching by downward percolation, and on the amount of solution that is lost from the system.
The ultimate economic recovery generally decreases and the acid consumption increases as the average particle size increases. The copper recoveries on minus-3-mesh ores 1 and 2 were 75 and 89. 5 percent, respectively, at acid consumptions of less than 4. 50 pounds of sulfuric acid per pound of copper dissolved. The ultimate economic recoveries, obtained in large-scale field tests on minus-6-inch size ores 1 and 2, were 55 and 45 percent at acid consumptions of 6.5 and 5.3 pounds of acid per pound of copper dissolved, respectively.
The type and exposed surface area of both the ore minerals and the gangue minerals are important factors that influence the ultimate economic recovery. In general, oxide ore minerals in acid solutions dissolve at about twice the rate of chalcocite in acid-ferric sulfate solutions. Porphery or igneous gangue minerals dissolve at a slow to medium rate, iron oxide gangues dissolve at a relatively high rate, and limestones dissolve at an extremely high rate. The quartzite gangue tested in this study did not dissolve to any appreciable extent.
The strength and type of leaching solvent likewise, have an important bearing on the acid consumption at the ultimate economic recovery. High reagent strengths may result in high acid consumptions, especially on ores with highly soluble gangues. Ferric sulfate can be used as a substitute for acid in the leaching of most ores.
Various losses may occur in a large heap that cannot be accounted for in a laboratory test. Solution losses by seepage may account for a relatively large increase in, the acid consumption and a decrease in the recovery in heap leaching. Channeling or poor transport and contact of solutions may likewise give poor heap-leaching results. Some evidence was presented in this study that suggests that the top of a heap may be over-leached by strong, more readily available, leach solutions and the lower part is under-leached by the weaker solutions that are available at depth.
This study has indicated that higher recoveries and lower acid consumptions can be obtained in heap leaching if the ores are crushed, a high degree of ore-solution contact is achieved, an optimum, controlled time of leach is used, and relatively large volumes of low-strength solutions are circulated through relatively thin heaps. A controlled form of heap leaching may consist of the following steps: (1) crushing the ore; (2) screening the ore; (3) treatment of the fines in a separate leaching system; and (4) heap leaching the coarse, crushed ore on a prepared pad under controlled conditions of leach, i.e., optimum size of particles, optimum time of leach, optimum strength, type, and volume of leach solvent, and in a heap of limited thickness.
Acknowledgements
The authors sincerely express their appreciation to the New Mexico Bureau of Mines and Mineral Resources, a division of the New Mexico Institute of Mining and Technology, for permission to present this report of investigation. Appreciation, is also extended to Mrs. Lynn Brandvold and a large number of undergraduate and graduate student assistants for their able help in analytical work, and metallurgical testings; to Mr. William Arnold for drafting; and to the secretarial staff of the Bureau for typing and reproducing the manuscript. Especially, the authors express their gratitude to those companies that contributed samples and data for this study.

Determination of Free Acid
Scope
This method appears to be a simple, yet accurate, means for determining the free-acid content of solutions containing hydrolyzable cations and a common anion. It should be of particular value in analyzing leach solutions. While testing has indicated that it works well on liquors containing H2SO4 it remains to be seen how well it will work on HCl and HNO3 solutions.
Principle
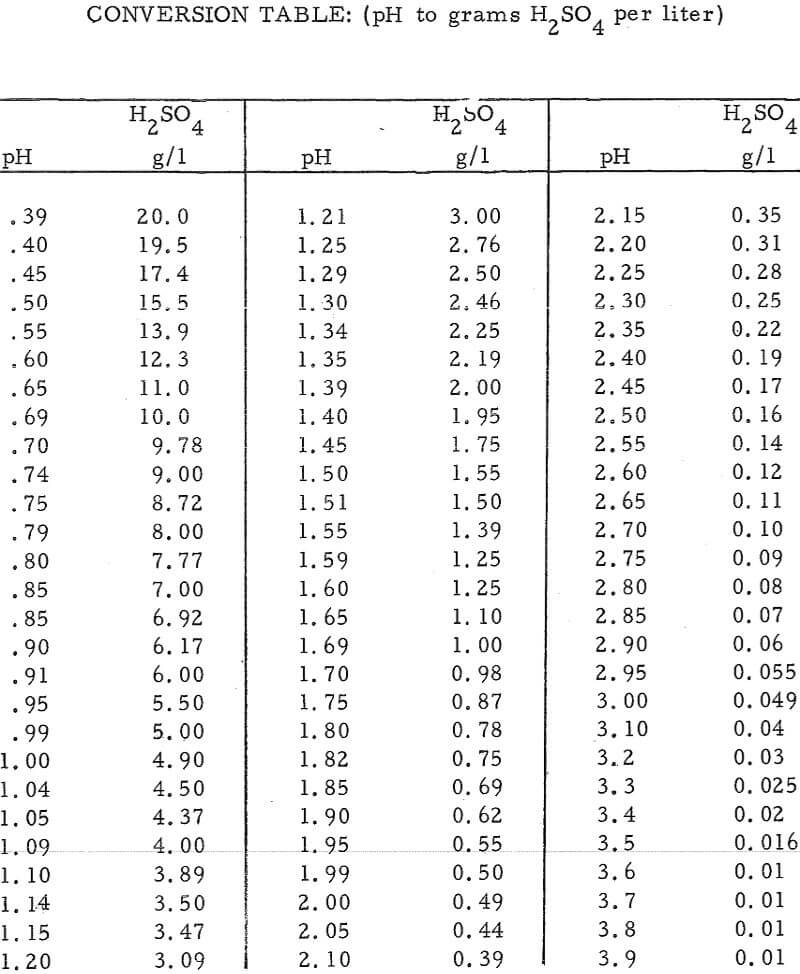
In this method, the acid content of an unknown sample is determined by comparing its pH with that of a known sample having a pH value close to that of the unknown. Conversion of pH values to grams of acid per liter of solution is accomplished by means of the equation pH = -log (H+) (see conversion table at end of report).
It has been determined empirically that (1) the pH of a sulfuric acid solution is not appreciably influenced by the presence of other hydrolyzable or nanhydrolyzable cations, providing that the solution contains a single anion specie, and (2) an accurate acid determination can be made of a solution based on its pH, if the pH meter is calibrated with an acid solution that has a pH near that of the unknown solution.
Equipment and Supplies
The main equipment used in this determination is a pH meter. While a pH meter with a digital readout or one with an expanded scale may be useful in obtaining a high degree of accuracy, a standard pH meter is sufficient in most applications. A single, combination-electrode is much easier to use than two standard electrodes.
A number of standard acid solutions are required, i.e., solutions in 0.25 – gpl-H2SO4 increments up to 3.00 gpl H2SO4 in 0. 50-gpl-H2SO4 increments between 3.00 gpl H2SO4 and 5.00 gpl H2SO4 and in 1.00-gpl-increments up to 10.00 gpl. Both the acid contents and the pH’s of these standard solutions should be noted on their respective bottles.
Procedure
- Make a rough check of the pH of the unknown. As an example, assume the pH reading was 1.70. From the conversion table this pH reading corresponds to an acid concentration of 0.98 gpl H2SO4.
- Now standardize the pH meter with a solution of slightly higher acid content than that of the rough reading, i. e. , a pH of 1. 59 or 1. 25 gpl H2SO4 in the above example.
- Reread the unknown sample, i.e., pH of 1. 58, or an acid concentration of 1. 28 gpl in the above example.
- Continue re standardizing the pH meter and rereading the unknown, as in (2) and (3) above until the same answer is obtained by use of standards that are both above and below the pH reading of the unknown. The acid concentration of the unknown can then be obtained from the conversion table. In this example, the final pH reading was 1. 55, or an acid concentration of 1. 39 gpl H2SO4.
- Solutions higher than about 10 gpl H2SO4 may require dilution
Approximately the same procedure should be used in reading the the pH meter each time. The manner that is found to be the most satisfactory is to (1) wipe the electrode(s) with an absorbent paper tissue, (2) immerse the electrode in the solution without stirring, and (3) allow it to stand until a constant reading is obtained. This period of time is generally only a matter of about 10 to 15 seconds in the case of the standard solutions, and up to 45 seconds when the solutions contain large amounts of hydrolyzable ions. A fixed period of about 30 seconds may result in a higher degree of accuracy if the solutions are high in hydrolyzable cations.
Both the unknown samples and the standard samples should be at the same temperature when the analyses are made.
Accuracy
Test work on solutions of known strengths has indicated that there may be a moderate degree of error when large amounts of ferric sulfate are present, and little or no error (less than ±5 percent), when the solutions contain acid alone, small or medium amounts of ferric sulfate, or relatively large amounts of ferrous sulfate, cupric sulfate or uranyl sulfate. The error amounted to +16 percent when the ferric sulfate (as Fe2(SO4)3 · nH2O) content was 20 gpl and the acid content was 2.00 gpl, +8 percent when the ferric sulfate content was 20 gpl and the acid content was 5.00 gpl, and +5 percent when the ferric sulfate was 20 gpl and the acid content was 10 gpl. The corresponding errors were somewhat less when lesser amounts of ferric sulfate were present in the solutions.
