The power required to drive a tumbling mill is of interest both to the designer and to the mill operator: to the former as a basis of design for the determination of the necessary size of the elements of the machine; and to the latter because all other factors being equal, the most economical machine is that which demands a minimum power for driving.
The power required to drive a mill depends, to some extent on every one of the physical dimensions defining the mill shell and ball charge and on many of those defining the properties of the powder charge. Thus the number of variables involved is very large. Since even a moderately complete theory for the internal dynamics of the ball mill, in which all these variables are given due importance, has not been propounded, the calculation of the power requirements of a mill, from theoretical considerations, cannot be made. Similarly, owing to the great number of variables, no complete experimental investigation of the power demands of ball, tube and rod mills has been made, the amount of work required for an analysis of all of the variables being prohibitive.
Grinding Mill Power Scale-Up
Probably one of the most comprehensive experimental investigations of the power demands of the ball or tube mill is that carried out by one of the present authors, with a worker, Rose and Evans by use of small-scale models; the test apparatus being that shown in Fig. 3.1. By use of small-scale models, a very large number of tests may be carried out in a reasonable time and, furthermore, variables which would be difficult to change on a large-scale test may easily be studied. No valid major objection to the use of small-scale models exists since by use of the method of dimensional analysis the results may be generalised to be applicable to mills of any size. The valid generalisation of the results of the model test demands that there should be a complete dynamical similarity between the systems, and, in the case of the ball mill, the pressures in the bed of material in the mill cannot be made strictly similar in a large and a small mill. Even so the satisfactory results obtained by use of model tests suggest that errors arising from this source are small. In the present chapter the question of the power to drive a mill will be approached from the point of view of these model tests and the results of previous workers studied by comparison with these data.
The power, P, to drive the mill would be expected to depend upon the length of the mill, L, the diameter, D, the diameter of ball, d, the density, e, of the ball, the volume occupied by the charge (including voids), expressed as a fraction of the total mill volume, J, the speed of rotation, N, the acceleration due to gravity, g, the coefficient of restitution of the material of the balls and mill, e. The power, P, would also be expected to depend upon the following characteristics of the powder; the representative diameter of the particles b, the energy necessary to bring about unit increase in the specific surface of the powder, E and the volume, V, occupied by the powder charge including voids), expressed as a fraction of the volume between the balls in the mill. Furthermore, the power, P, would be expected to depend upon the effective kinematic viscosity of the mixture of powder and fluid, v, the effective if density of the mixture, ó, and, in the case of wet milling, by the ratio of the volume of the solid material to the volume of the liquid in the pulp, U. Finally, when the interior of the mill is fitted with lifters it would be expected that the power, P, would depend on the number of lifters, n, and upon the height of the lifters, h.
Thus, the power can be expressed symbolically:
P = Ø(L, D, d, q, J, N, g, f, e, b, E, V, v, ó, U, h, n,)………………….. (3.1)
where Ø denotes some function of each of the quantities within the bracket.
Then from the well-known principles of dimensional analysis it is easy to derive the expression in terms of dimensionless groups,

where Ø denotes some function of each of the dimensionless groups upon the R.H.S. of the equation.
Theoretically, the dimensionless groups can be combined in any way and it is the function of experiment to determine these relationships. In the present work, however, it has been found that, in most cases, the functions of the dimensionless groups may be multiplied together and the results of the experimental analysis have been arranged in this way.
On this basis equation (3.2) can be written:

In the work of these investigators, attention has been confined to dry grinding and, in this case, the groups (v/D²N) and (U) are eliminated.
The first variable to be studied was the effect of the length of the mill on the power requirements: that is, the determination of Ø2(L/D). The experimental results of Rose and Evans fall on a series of straight lines passing through the origin and so it follows that Ø2(L/D) is a linear function. Thus,
(L/D) = K(L/D) …………………….. (3.4)
The critical speed of a mill has already been discussed and it has been shown there, by equation (2.5), that the critical speed is given by
ωc = √(2g/D) ……………………………(3.5)
which, by transposition, gives
g/D = K N c² …………………………(3.6)
If now N is the actual speed of rotation, it follows that
g/DN² = K(Nc/N²)………………..(3.7)
of that the group (g/DN²) is proportional to the square of the ratio of the critical speed to the actual speed of rotation. Thus the relationship may be written:
Ø1(g/DN²) = Ø1′(Nc/N)………..(3.8)
It also follows that in order that dynamical similarity, as regards this group, shall hold between a number of mills of different diameters, it is necessary that they shall all run at the same fraction of their respective critical speeds. This is in accordance with the findings of Gow, Campbell and Coghill and other workers.
The relationship between the power group (P/D6N²e) and the group (Nc/N), as determined by experiment, is shown in Fig. 3.2, and it is seen that for speeds less than 80% of the critical, the relationship Ø1′(Nc/N) can be replaced by
Ø1′(Nc/N’) = K2(Nc/N)² …………(3.9)
where K2 = 3.13 for lifter mills and 3.66 for mills without lifters. Within this range these relationships can be used directly in the equations for the determination of power required to drive a mill. The deviation from linearity shown by these curves is exactly what would be predicted from theoretical consideration since, ideally, when the whole ball charge is centrifuging, the centre of gravity of the charge would coincide with the axis of rotation and the power required to drive the mill would be zero.
In theory, the centrifuging of the charge takes place in layers and each layer forms at a definite speed. In practice however, the process is complicated by interaction between the balls, lifters, etc., and centrifuging occurs more or less gradually over a wide range of speeds, this leading to the deviation from linearity, shown in the figure. Since these curves are plotted on logarithmic scales, the curves should be asymptotic to the negative branch of the y axis, mid in fact the lines show this trend.
Effect of Lifter Height & Liner Thickness on Grinding Mill Power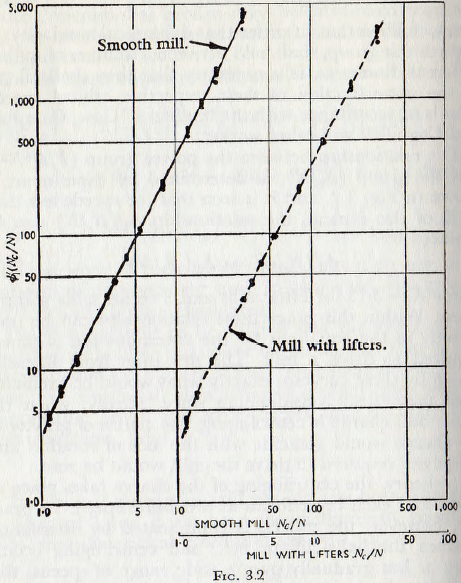
Since as has already been mentioned, the critical speed is a criterion for the occurrence of many phenomena in a mill, it is perhaps of interest to mention that during the course of tests at various speeds, the configuration of the balls within the shell was observed through a perspex end cap, and, in the case of the smooth mill, centrifuging of the outer layer of the balls was not observed at speeds up to 1.2Nc, the highest speed reached during the tests, but when effective lifters were fitted to the shell, the outer layers of balls commenced to centrifuge when the speed of rotation exceeded the critical value Nc, by a very small amount. 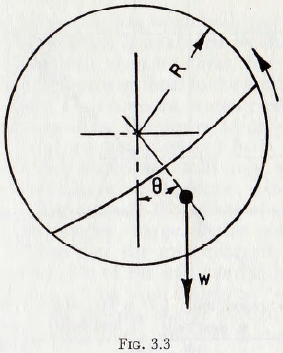 For a smooth mill, cataracting of the charge generally commenced at speeds of about 0.8Nc, while, when lifters were fitted to the shell, cataracting commenced at about 0.6Nc. This is roughly in accord with the results of Chapter 2, illustrated in Fig. 2.19, that if a mill with a 30 % to 40 % filling is taken as representative, the boundary between cataracting and cascading is when the speed of rotation is about 0-7Nc.
With a smooth mill surging of the entire charge was sometimes observed for speeds below about 0.4Nc.
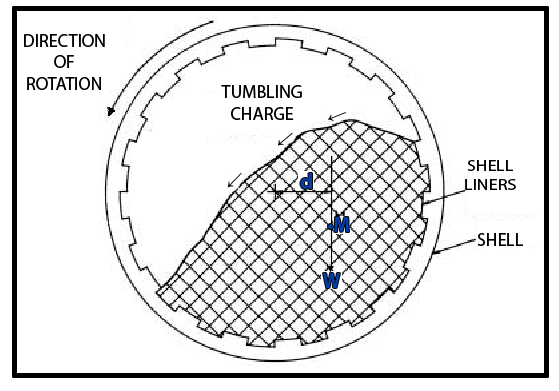
Coming now to a study of the effect of the density of the grinding media upon the power required to drive a mill it follows that since the mass of grinding bodies has a definite configuration, as suggested by Fig. 3.3, then the torque to drive the mill will be proportional to the weight of the charge; that is, without powder, proportional to the density of the material of the balls or rods. The correctness of this view is established by Fig. 3.4a, based on the work of Rose and Evans, in which the measured power is plotted against power calculated on the basis of this assumption for charges of glass, steel and lead balls; the relative densities of these materials being given in Table 3.1. It is at once seen that an extremely good linear relationship holds between these variables and so it must be concluded that the suggested relationship is valid.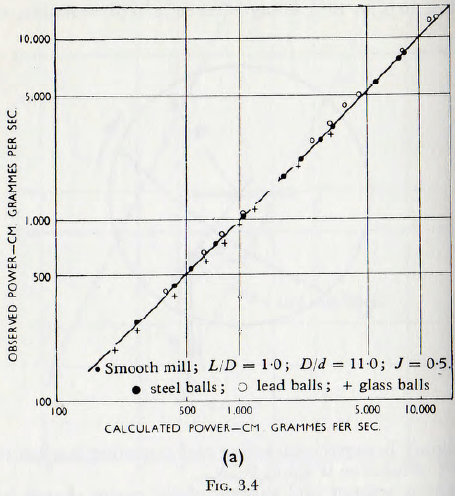
If now the material undergoing grinding occupies the spaces between the balls of the ball charge, it follows that the centre of gravity of the powder mass will coincide with that of the ball mass.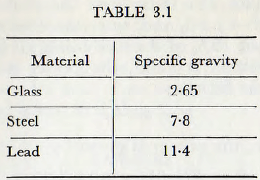 Thus, if the mill charge retains the same configuration as it has when balls only are present, that is, the configuration is unaltered by the inclusion of the powdered material, then it follows that the torque to drive the mill will be proportional to the total weight of the charge in the mill. Thus it would be expected that, at least as a first approximation, the power to drive a mill containing a powder can be calculated from the equation applicable to a mill containing balls only, provided that the density of the balls, in the latter case, is increased by an amount sufficient to include the effects of the additional mass due to the powder charge. If this point of view is adopted, it follows that the mill charged with powder become a special case of the mill containing only a ball charge, and effects arising from the particle size and other characteristics of the powder charge may be expressed by corrections to the equations applicable to the mill without powder. On this basis, for a mill containing a powder charge.
Power input
= (Torque due to ball space charge + Torque due to powder) x Speed x Proportionality factor
= K x (Wt. of ball charge + Wt. of powder charge)
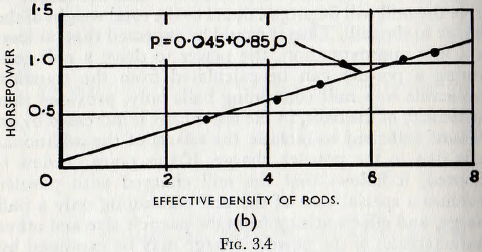
That these terms are simply additive is supported by the curves of Fig. 3.4b in which are plotted data given by Coghill and Devaney, for the power required to drive a rod mill, in which the rods are tubular and the effective density of the rods is varied by “filling” the tubes with various materials. For these tests the mill was grinding chert, for which ó≅3.0, and, since the void space between the rods is about 15% of the mill filling, it follows that, if the simple addition is valid, the power is given by the expression of the form
y = mx + c
Furthermore, the power is given by
P = K(0.015 x 3.0 + 0.85e)
and it is seen that the curve given coincides very closely to this expression.
If now ξ is the ratio of the power to drive the mill charged with balls and powder to the power to drive the same mill with a ball charge only, then:
ξ = Wt. of ball charge x Wt. of powder charge/Wt of ball charge
If also it is assumed that the porosity of the ball charge and of the powder is 0.4 in each case, then:
ξ = (1 – 0·4)q + 0·4(1-0·4)σ/(1 – 0·4)q
= (1 + 0·4σ/q) …………………..(3.10)
Thus the functional relationship Ø10(σ/q) is given by the multiplicative factor (1+0.4σ/q).
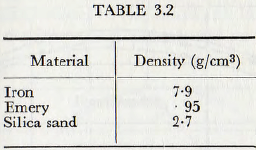
The validity of this relationship has been further examined by tests carried out using powders consisting of emery, iron powder and silica sand; the density of these materials being given in Table 3.2.
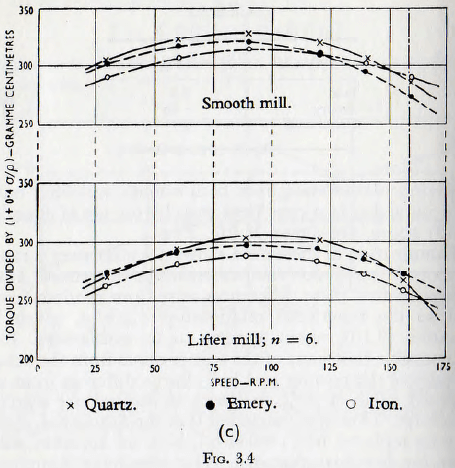
Representative data from both smooth and lifter mills, after reduction to a consistent basis by the use of equation (3.1.) above, are shown in Fig. 3.4c.
Examination of these data shows a scatter over a range of about 5% with no consistencies in the deviations. Thus, it appears that these differences arise from random errors mid so the functional relationship ∅10(σ/q), given by equation (3.10), again appears to be satisfactory. It is also possible that some of the scatter arises from the actual porosity of the powder and ball charge differing from the assumed value of 40%, but such deviations are scarcely calculable. Thus it is concluded that the function ∅10(σ/q) may be replaced by (1 + 0.4σ/q), with an accuracy sufficient for practical purposes. The remaining functional relationships cannot be represented by simple algebraic expressions and so are best presented by graphs.
In the first place it follows from Fig. 3.4a that, since materials having a wide range of values of coefficient of restitution are used and yet the points suffer no significant scatter, the effect of the coefficient of restitution on the power requirements of the mill is very small. Thus, at least for practical purposes, the function ∅8(e) may be neglected.
This result would be expected since, although the coefficient of restitution of the metals would affect the conditions of rebound when clean solid particles make contact, the effects of changes in the coefficient of restitution of the metals are, in the case of a ball in a mill, masked by the energy dissipating capacities of the loose bed of balls and powder upon which the ball falls and by powder between the contact surfaces.
Effect of Mill Lifter & Liner Wear & Shape on Tonnage
If, on referring to Fig. 3.3, it is assumed that the curve representing the free surface of the charge is a straight line and also that the angle θ is unaltered by variation of the quantity of the charge, then it is clear that the power to drive the mill is proportional to the product of the cross-sectional area of the charge and the radius of the couple arm; both of which depend on the mill filling J. On the basis of these assumptions it is a simple matter to calculate the torque in terms of the mill filling and, when this is done the “theoretical” line of Fig. 3.5 is obtained. This method of treatment is a gross over-simplification, however, since, as explained in Chapter 2, the curve representing the surface of the charge depends on the filling and frictional characteristics of the material. Furthermore, the balls are not mathematical points and so there is mutual
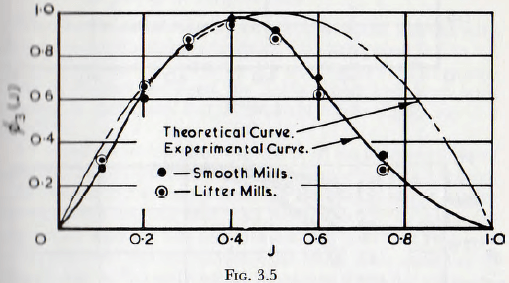
interference between the balls. There is also interference between the balls and lifters, etc., and, when the relationship is determined by experiment, a vastly different curve, as is also shown in Fig. 3.5, is obtained. The importance of this difference will become apparent later, when various simplified formulae, which have been proposed for the power requirements of a mill, are discussed.
It has already been explained in Chapter 2, in which the motion of a mill charge is discussed, that the coefficient of friction between the ball surfaces and the number of balls in the charge are, from the point of view of motion of charge, not independent variables. For this reason the functions ∅4(d/D) and ∅7(f) must be considered together In Fig. 3.6a are shown the results of tests on a smooth mill containing clean steel balls and in Fig. 3.6b of tests
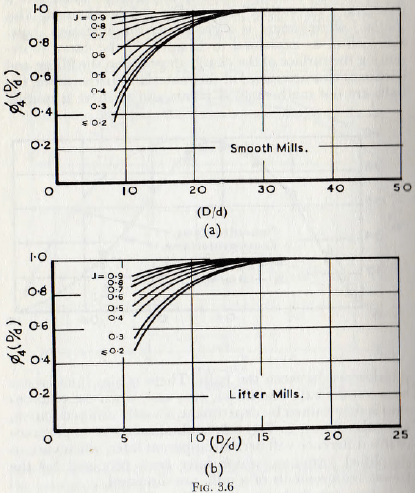
on a mill with lifters. Examination of these curves shows that, for the practical case of (D/d) greater than 20, the value of the function does not differ significantly from unity. For values of (D/d) appreciably less than 20, however, the value of the function is not independent of the filling of the mill.
In order to test the effects of variation of the coefficient of friction tests have been carried out in which:
- The balls and mill are cleaned and tested dry.
- The balls and mill are cleaned and slightly oiled.
- The balls and mill are cleaned and treated with molybdenum disulphide.
- The balls and mill are contaminated with a trace of powder.
- A full powder charge is used.
The coefficient of friction between surfaces treated with molybdenum disulphide is about 0.05 as against 0.1 to 0.2 for oiled surfaces and 0.3 for dry steel on steel. The coefficient of friction between the surface contaminated with powder is unknown but is probably very high, say 0.5 to 1.0.
In order to investigate the effect of small quantities of powder, quartz powder from the sample passing through a 200-mesh sieve was added to the ball charge under investigation and normal tests carried out. The quantity of powder used for this purpose was 5.0 % of that required to fill the void spaces between the balls. This quantity of charge was sufficiently small to ensure that, for all practical purposes, the change in torque, from the corresponding case of the mill charged with clean dry balls only, was due to the change in the coefficient of friction and not to the increased density of the charge. As a result of these tests, no significant difference was found between the results for the cases (1), (2) and (3) above, and the combined results for these tests can be presented by the full line of Fig. 3.7, this curve, of course, corresponding to that for (J) = 0.5 on Fig. 3.6. It is probable that this drooping characteristic arises from the comparative freedom of rotation of the balls when the coefficient of friction is low and when the number of contact points between the surfaces is small; as is bound to be the case when (D/d) is small.
The effect of adding a small quantity of powder is shown by the broken line on Fig. 3.7, this curve being adequate for all values of (J) and, furthermore, a study of Fig. 3.6 suggests that this curve is adequate for lifter mills. Thus, it may be concluded that for smooth mills grinding materials having a low coefficient of friction ∅4(D/d) should be read from Fig. 3.6a. For lifter mills, or mills grinding materials giving a high coefficient of friction, the functional relationships should be read from the dotted line of Fig. 3.7.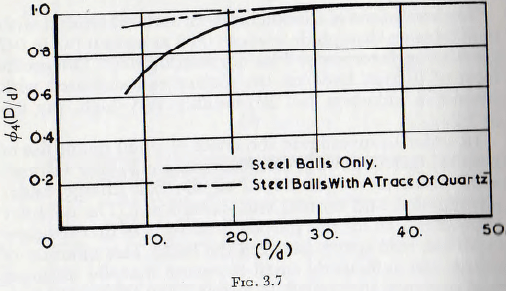
It has been suggested by Bond, that for values of the ratio (D/d) greater than about 80 the ball charge “slumps” and, thus, the curve of Fig. 3.7 falls for values of the ratio greater than this figure. It is also stated that this effect is particularly marked in wet milling, but, since it is rather unusual to use balls so small that the ratio of (D/d) exceeds 80, it is probable that this effect is not of great practical importance.
In view of this comment the present authors have, by use of the small-scale apparatus, subsequently extended the range of Fig. 3.7 to (D/d) ~200 and, in no case, with mills charged with iron shot or glass balls, has “slumping” of the charge been observed during dry milling.
Thus no explanation of this phenomenon can be offered but it is probable that it is in some way bound up with a variation in the frictional characteristics of the mill charge.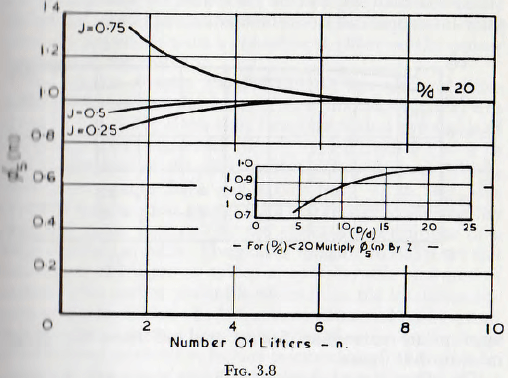
The results of tests carried out to determine the effect of the number of lifters, n, on the power requirements to drive a mill, that is to establish ∅5(n), are plotted in Fig. 3.8 The function ∅5(n) is influenced by a large number of variables to a small extent, and the curves presented in this figure are the lines best representing the whole of these data. This method of presentation is adopted since it is felt at the errors introduced by the use of a single line, to replace many, are not significant but that the simplification obtained is worthwhile.
From the figure it can be seen that, provided the number of lifters is greater than about 6 and the ratio of (D/d) exceeds about 20, the function has a constant value of unity. Thus it follows that, provided there are sufficient lifters to effectively key the charge to the mill shell, the number of lifters is unimportant. For a number of lifters less than 6, but with (D/d) less than 20, there is some dependence upon the value of mill filling as shown by the branching of the curve to the left of the figure. For practical purposes the value of the function, for values of (D/d) less than 20, can be calculated by multiplying the relevant value read from the main curve of Fig. 3.8 by the appropriate correction factor read off from the graph inset in that figure.
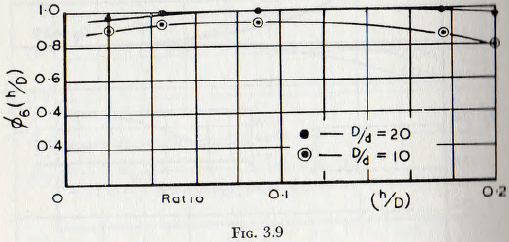 The effect of the height of the lifters is given by the function ∅6(h/D) and the results of tests to determine this function are given in Fig. 3.9, from which it is seen that for mills in which (D/d) is greater than about 20, the height of the lifter has little effect on power requirements. For the less usual case, in which (D/d) is less than 20, there is a considerable deviation for these limited cases, but a straight-line interpolation between the two curves of Fig. 3.9 is probably adequate. These conclusions are valid only for lifters of reasonable height, that is, for lifters in which h is not greater than, say, 0.2D and not less than about d/2. If h exceeds 0.2D the lifters unduly interfere with the motion of the ball charge, while if h is much less than d/2 the balls ride over the lifters and so locking to the shell does not occur. This at once suggests that “wave”, “ship-lap”, and other such liners cannot act as effective lifters.
The effect of the particle size on the power requirements of a mill would be expected to be small, provided that the particles were not so small that powerful aggregation takes place. If this were to occur, the charge could become “jelly-like” and the motion of the ball charge would be seriously impeded; with a consequent effect on the power demands of the mill.
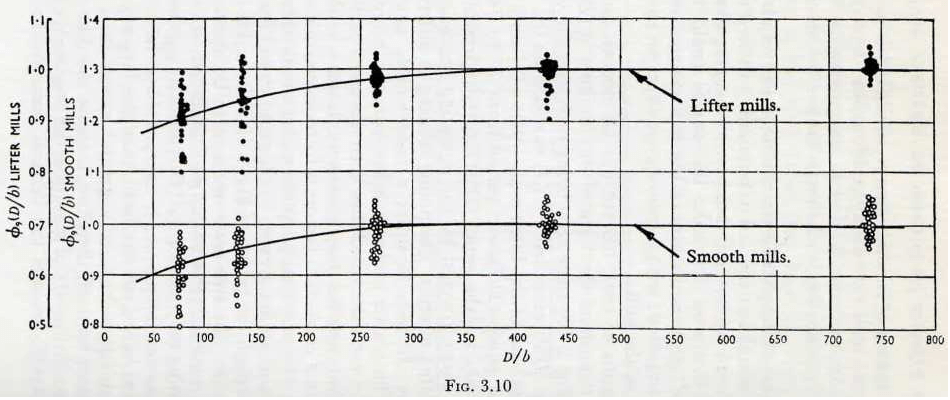
The results of tests, carried out on smooth and lifter mills, to determine the form of the function ∅9(D/b) are given in Fig. 3.10; these tests being such that the value of the group (D/d) exceeded 19, (J) varied from 0.1 to 0.75 mill in the case of the lifter mill, (h/D) = 0.1 and (n) = 6, whilst the group (D/b) was varied from 77 to 740; this range of values of the group (D/d) largely representing the practical range covered by the operating conditions of a large number of mills. The points relating to different test conditions are seen to suffer a considerable amount of scatter. This scatter probably arises from the interdependence of the variables which has been discussed earlier, and it is felt that, unless a very great complication in the form of additional correction factors is introduced, this must be accepted. For practical purposes such complication is not justified, and, in the present work, mean curves have been drawn through the points of Fig. 3.10. When this is done, the curves for the two cases are seen to be identical and give the functional relationship ∅9(D/b) shown in Fig. 3.11.
Decreasing the value of the (D/b) ratio in a given mill is seen to decrease the power necessary to drive the mill. This may be explained on the basis that the larger particles separate adjacent balls to a greater extent than do the smaller particles, and, therefore, increase the dilatation of the charge. The centre of gravity of the combined charge is thus displaced towards the vertical through the axis of
rotation and so the torque is decreased. In the small mills used for these tests, the presence of very fine powder, such that the ratio (D/b) greatly exceeded 800, resulted in separation of the powder from the balls, but this only occurred at speeds in excess of 0.8Nc. The powder formed a continuous layer around the cylindrical wall of the shell, and the power required to drive the mill decreased by a large amount when this occurred. This phenomena would probably not occur with large industrial mills, but data is not available on this point. The question is bound up with the, absolute size of the particle and a ratio of (D/b) of 800 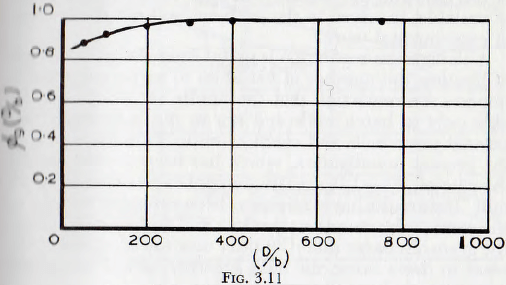 in mills used in the tests corresponds to a charge consisting of particles of 0.003-in. average diameter. Generally, however, it would be expected that, except in the case of very fine grinding, this effect is unimportant.
Throughout the series of tests, the value of the powder filling group (V) has mainly been held constant at unity; this being the condition that the powder charge is theoretically just sufficient to fill the void space between the balls. In fact, the powder increases the total volume of the charge and a layer of balls may occur at the surface of the charge, the void space between which is unfilled with powder. This restriction on the value of the parameter (V) has been made because, in practice, less powder than is necessary to fill the void space is rarely used since a part of the ball charge is then inoperative in the grinding process; even though the power necessary to maintain the centre of gravity of the inoperative portion of the ball charge in the displaced position must still be supplied. Conversely, if the powder is excessive, choking of the mill occurs, and a portion of the powder charge is remote from the ball charge at any instant and so cannot be effectively ground. Thus the decision to restrict the value of the parameter (V) to unity is based upon the practical importance of this case and the necessity, in view of the large number of variables involved in the problem, to limit the amount of experimental work.
Although this restriction is useful from the point of view of limiting the number of variables to be investigated, it imposes the restriction that the results are strictly applicable only to batch mills and not to the industrially important grate mills and overflow mills. Thus the results of the present investigation, which has been carried out for the case of (V) = 1.0, are strictly applicable only to a batch mill. The results have, however, been extended directly to the cases of the trunnion overflow mill and by inference to the grate discharge mill. Consider now the extension of the work to these cases; the mills together with a batch mill have already been illustrated in Fig. 1.4.
With a batch mill, as previously suggested, the centre of gravity of the ball charge and powder charge sensibly coincide and so the density correction (1 + 0.4σ/q) previously deduced is applicable.
In the grate mill the powder surface probably slopes from the inlet end of the mill to the discharge end in the manner indicated in Figs. 1.4b and 1.4d. In this case the moment of the powder charge about the axis of rotation of the mill is probably much the same as in the ball mill; the greater moment at one end of the mill being roughly balanced by a smaller moment at the other end. Thus, the method of the present work would be expected to be applicable to a grate mill with an accuracy sufficient for most purposes.
In the case of the overflow mill, in order that the product shall overflow through the hollow trunnion, it is necessary that the general level of the powder surface must correspond to about a 45-50% filling of the mill. Then when the ball filling is about 45-50% the overflow mill corresponds to a batch mill, and so the power input should be directly calculable from the present work. For small
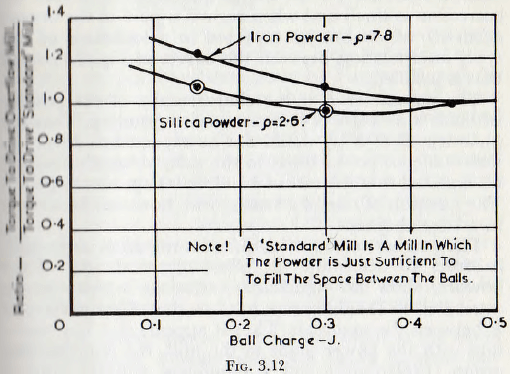
values of ball charge, however, a correction factor is necessary and this has been determined by experiment and is given in Fig. 3.12. In the use of this factor the power is calculated on the basis that the mill has a ball charge equal to that in the actual overflow mill and the normal correction for powder charge is introduced. This calculated power is then multiplied by a factor, corresponding to the value of the actual ball charge; the factor being read from Fig. 3.12. The shape of the curve of Fig. 3.12 would be expected, since for very small ball charges the powder standing above the ball charge level contributes a relatively large moment, and so increases the power required over that calculated on the basis of a batch mill. For intermediate fillings, however, the contribution to the moment by this additional powder is small, but there is, in addition, a loss of moment due to this additional powder displacing the centre of gravity of the relatively heavy ball charge towards the centre of rotation.
Strictly, there should be a correction curve for each value of the density of the charge material, but, in fact, the correction is small and when regard is paid to the overall accuracy which can be expected in calculations of this type, interpolation between the curves of Fig. 3.12 is all that is justified.
The parameter E is the characteristic of the powder which is a measure of its resistance to grinding. Thus the quantity (E/D³N²Q) would not be expected to affect the instantaneous power input to the mill, although it would be expected that the rate of grinding is dependent upon it. The question of rate of grinding will, however, be treated in a later chapter.
The tests carried out with different materials in the mill, in order to determine the effect of the density of the powder, show no significant variations which can be attributed to the difference in the value of the parameter E between the materials. Thus it appears that in connection with the power input to the mill, the dimensionless group (E/D³N²q) is not a significant variable, and so ∅12(E/D³N²q) is eliminated from the equation.
In order to compute the power required to drive a mill it is necessary to include the values of all the various relevant factors previously discussed and on the basis of this foregoing work, the equation for the power becomes

where ∅1′(Nc/N) is read from Fig. 3.2,
∅3(J) is read from Fig. 3.5,
∅4 ( d/D) is read from Fig. 3.6 or Fig. 3.7 as required by mill parameters,
∅5 ( n) is read from Fig. 3.8,
∅6 (h/D) is read from Fig. 3.9,
∅9 (b/D ) is read from Fig. 3.11,
and ∅11(V) is read from Fig. 3.12 for a trunnion overflow mill or is taken as unity for a batch mill or
grate discharge mill.
The equation (3.11) has been applied to the computation of the power requirements of large industrial mills, based on the published data given by Taggart, and the results of these calculations are shown in Fig. 3.13. From this curve it is seen that the points are scattered along good straight lines, even though the ratio of the horse-power to drive the largest mill to that required to drive the model is of the order of 30,000 to 1.0. Thus it appears that there in no systematic errors in the results of the model tests.
In connection with the scatter of the points, it is perhaps of interest to mention that the data quoted by Taggart, which have been apparently obtained by circulating a questionnaire to a large number of mill owners, are, for the following reasons, subject to some uncertainties.
- The power quoted is the power input at the motor terminals. Furthermore, this figure is often estimated; or even the nominal installed power is quoted.
- The overall efficiency from the motor terminals to the mill body is unknown and can vary from mill to mill. For purposes of calculations an overall efficiency of 85 % has been assumed for mills with concentric drives, and an overall efficiency of 75% for mills with girth ring drives.
- The figures for diameter and length are quoted on various bases; for example some are the nominal dimensions of the mill and others are inside new liners. Since the power input, P, is related to the diameter D by the expression P = KD2.5, the uncertainties in the diameter of the mill can produce considerable inaccuracy in the calculated value of the power input.
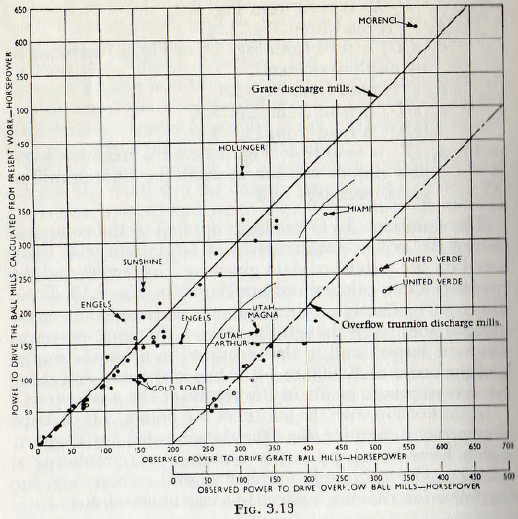
- The density of the material being ground is not known precisely.
In view of these uncertainties, it is believed that the agreement between the calculated and measured powers is as close as can reasonably be expected, and it may be concluded that the results of this work upon small-scale models may be applied with confidence to the calculation of the power input to industrial mills of even the largest size that is to machines absorbing even several thousand horse-power. The method of calculation developed in this work will be demonstrated by application to the data, relating to a large mill, published by Carey and Stairmand.
A lifter mill of 6 ft diameter, revolving at 18.7 r.p.m., is grinding coal. The body of the mill is divided into two sections: one section, 7.5 ft long, being charged with 5 tons of steel balls, of 2 in. average diameter, and the other section, 15 ft. long, being charged with 6 tons of “Cylpebs” of 5/8 in. average diameter.
For the section 7.5 ft long and assuming 40 % voids between the balls and in the coal, the above data lead to:
Volume of balls = 38 cu. ft and Volume of chamber = π/4 x 6² x 7·5 = 212 cu. ft
Thus (J) = 0·18
From equation (3 .5), the critical speed for both sections in 31 r.p.m.
Νow from the appropriate graphs,
∅1′(Νc/Ν) = 9·2, ∅3(J) = 0·65, ∅4 (D/d) = 1·0,
∅5 (n) = 1·0, and ∅6 (h/D) = 1·0
and since the particle diameter, b, is probably less than about 1/8 in., ∅9 (D/b) = 1·0.
Then from the equation
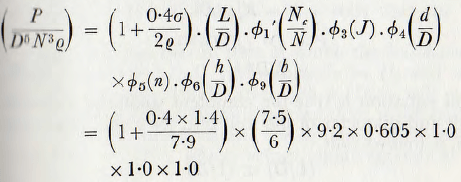
or P = 820,000 ft pdl/sec
= 49.5 h.p.
If, for the section 15 ft long, it is assumed that the “Cylpebs” pack with a voidage of 40%, then (J)=0.13
and, by similar calculations
P = 66 h.p.
Thus the power to drive the whole mill
= 49.5 + 66.0 = 115.5 h.p.
= 86 kW
From the published data, the measured power to the motor terminals is 103 kW, and so the power demand of 86 kW by the mill leads to a combined efficiency of motor and transmission of 83%, which is reasonable. Thus the agreement is as close as can be expected.
Consideration of equation (3.11) will show that for speeds less than 80 % of the critical,

the remaining groups of the equation being neglected for the time being.
Now, for a given mill filling and a given material being ground, ∅3(J) and (1 + 0.4σ/q) are invariant, and for a constant fraction of the critical speed ∅1(Nc/N) is constant.
Furthermore, since the mill runs at a given fraction of its critical speed, it follows from equation (3.6) that

This equation is true for complete similarity between length and diameter of the mill but, for a mill of constant length, it follows that
(L/D) ∝ (1/D)
and, so in this case
P = KD2.5 ………………………(3.14)
which is a widely accepted relationship for the power input to a mill.
In fact, it has been found by Gow, Guggenheim, Campbell and Coghill, Fahrenwald and Lee and others that, in practice, the power demand is given more nearly by the relationship
P = KD2.6 ………………………(3.15)
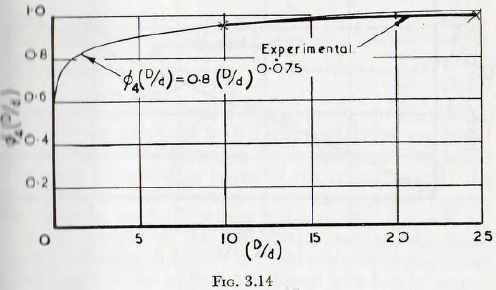
From Fig. 3.7, however, it would be expected that ∅4,(D/d) varies approximately as (D/d)0.1 and in Fig. 3.14 is shown the curve (D/d)0.075 plotted on the same axes as the dotted curve of Fig. 3.7. It is seen that the fit is reasonable.
Thus it follows that in tests in which the ball diameter is constant the ratio (D/d) varies directly as D, and so the power to the mill, which varies with ∅4(D/d), will vary as D0.1 approximately. Thus, it follows that, if the ball diameter is maintained constant, the equation (3.14) must be multiplied by D0.1, which brings about agreement with equation (3.15).
One of the earliest attempts to derive, from theoretical considerations, a formula for the power to drive a mill is that of Davis, who starting from the basis of the ball trajectories discussed in the previous chapter, calculated the striking velocity and so the kinetic energy of the elements of the charge in a given trajectory and, by integration, the kinetic energy to the whole charge; this kinetic energy clearly being supplied to the mill from the external source.
On this basis the following formula for the power input to the shell, when working under conditions of best theoretical efficiency, was obtained:

where the value of Κ is given by the following approximate equation:
Κ= -0·024+0·39(7 – 10J)½ ………………… (3.17)
The equation (3.16) is not directly comparable with equation (3.11), since for a given composition of charge, the weight of the charge, W, cannot be varied independently of the diameter of the mill and similarity maintained at the same time. Thus, the functional relationship ∅3(J) of the previous work is absorbed in the form of equation (3.17). Furthermore, the equation of Davis is derived for the conditions of maximum efficiency and so is not general.
An equation developed by Bond for mills dry-grinding is

where P is the power draft in kilowatts per ton of grinding balls. The equations of both Davis and Bond are based only on the mill diameter, the mill filling and the speed of rotation expressed in terms of the critical speed; the forms of the equations arising from the empirical expressions defining the relationships between several variables. Since the weight of the ball charge enters both these equations directly, it follows that the power is proportional to the length of the mill; a conclusion which is in accord with the equation of Rose and Evans.
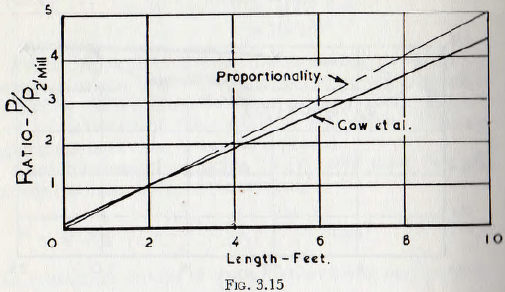
It has been suggested by Gow, Guggenheim, Campbell and Coghill however, that the power does not vary directly as the length of the mill, but these workers give an expression which reduces to
∅2(L/D) = (0.5L – 1)K + 1 ……………..(3.19)
where L is the length of the mill and K is a constant having the value of 0.9 for mills of length less than 5 ft and 0.85 for mills of length greater than 5 ft. This function is plotted in Fig. 3.15, and it is seen that for long mills the power is considerably smaller than is demanded by a linear function.
The higher power requirements of a short mill would, perhaps, be expected, since the end plates of the mill might cause a “piling-up” of the charge at the ends of the mill. Such an effect would, however, be expected to be negligible in a long mill. Thus, this deviation for a long mill is surprising and it is believed that this formula should be accepted with caution.
Hancock proposed the formula
P = 0.00078C³Lnε …………………….. (3.20)
where C is the length in feet of the chord defined by the surface of the mill charge, L is the length of the mill in feet, δ is the mean specific gravity of the charge and n is the speed of rotation in r.p.m. This formula approximates to the formula of Rose and Evans insofar that the term q(1 +0.4 σ/q) is proportional to the mean density of the pulp, and so to δ of equation (3.20), and in that the power is proportional to the length of the mill.
Furthermore, the quantity C³ may be written:
C³ = D³(C/D)³
but (C/D) is the sine of the semi-angle, subtended by the surface of the charge at the centre of the mill and so
C³ = D³ sin³
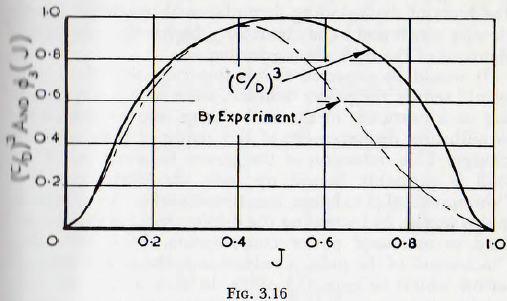
Examination of Fig. 3.16 shows, however, that for the practically useful range, of up to 50% filling, the curves of sin³ and ∅3(J) practically coincide. Thus
C³ = D³ x ∅3(J)
Also from equation (3.6) it follows that for constancy in the ratio of running speed to critical speed
n ∝ 1/√D
Then, on making these substitutions, equation (3.11)
![]()
becomes

Thus, the general form of the two equations is in close agreement but the value of the coefficient (0.00078) appears to be in error.
For values of mill filling greater than 50%, however, the agreement is not good but, in practice, high mill fillings are perhaps not so frequently used as the lower lines so it may be concluded that, provided that the correct value is assigned to the coefficient, the equation of Hancock, in spite of its simpler form, is, over a practical range of variables, in good agreement with those of other workers. Thus this formula includes, approximately, the dimensionless group ∅3(J) of the previous work.
Effect of Pulp Rheology on Grinding Mill Power
Power Required to Drive a Rod Mill
The power required to drive a rod mill does not appear in have been extensively studied. As a first approximation, it would be expected that the value of the function ∅10(σ/q) would be different to that for a ball mill but that the values of the remaining functions would not be seriously altered.
Since the “voidage” in a bed of circular rods, packed in the tightest array, is about 10% (0.095) and assuming the voidage of the powder to be 40 %, it follows that

Also, for a given value of mill filling (J) the load of rods in the mill will exceed that of balls in the ratio of the volume of rods to the volume of balls, that is,
1 – 1.01/1 – 0.4 = 1.5
Thus, the power to drive a rod mill, without a powder charge, will be given approximately by
PR = 1.5PB ……………..(3.24)
where PR is the power to drive the rod mill and PB is the power to drive the corresponding ball mill, as calculated from the foregoing formulae.
It is probable, however, that the action of the powder to dilate the charge, and so to reduce the horizontal displacement of the centre of gravity of the charge, would be more marked with rods than with balls. This would lead to a reduction in the actual power to below that which would be calculated by the use of the formulae of the ball mill, as modified by the use of equations (3.23) or (3.24). This effect would, however, probably be small and so could be neglected.
A further case which requires consideration is that in which the grinding media is of some form such as “Cylpebs”; off-cuts from scrap drill rods sometimes being used in the mining industry. Also in some cases, though rather rarely, large pieces of ore are used as a grinding medium. It appears, however, that only in the case of extremely high costs for the carriage of replacement balls can the use of such lumps of ore be justified on economic grounds; since the grinding efficiency is adversely affected thereby and the milling cost correspondingly increased.
The use of such non-circular or non-spherical materials would lead to a “locking” of the elements of the charge, and so to an increased displacement of the centre of gravity of the charge, with a relatively increased power demand. The power demand would, furthermore be modified by the tightness of packing of the grinding bodies, which is different to that for balls, and by the density of the material. The power to drive mills charged with such materials does not appear to have been studied, however, and with the present state of knowledge, little more than rough estimates of the power calculated on the basis of the previous equations modified on the lines suggested, can be made.
The foregoing work deals entirely with the power necessary to keep the charge within the mill shell in motion. Clearly, in order to determine the power to be supplied by the driving motor, it is necessary to add to this figure the power lost in the bearings supporting the mill shell in the bearings supporting the intermediate speed shafts and in the reduction gearing. The estimation of these losses, is, however, a matter of general engineering knowledge, and is not specific to the tumbling mill, and such matters are specifically excluded from the present work.
