The pilot mill used was 44 cm i.d. and 60 cm i.l. with a volume of 91,250 cm and was fitted with six one-half inch lifter bars. The ball charge was made up of 2,200 one-inch balls for a bulk volume of 36,500 cm³ (40% loading and a void volume of approximately 13,700 cm³ (38%).
All tests were run at 50 r.p.m. with a constant slurry loading of 14,000 cm . Variations in the percent solids were achieved by changing the water-to-solids ratio to give 14,000 cm total slurry volume. The weight of coal used was calculated on as-received coal, not dry coal and is the same coal designated and completely characterized as Coal B in Klimpel (1982). This coal is a medium volatile bituminous having 3.0% moisture as received and a specific gravity of 1.34. The proximate analysis on a dry basis is 21.6% volatile matter, 75.2% fixed carbon, and 3.2% ash.
To assist in analyzing the results it is valuable to use the concepts of first-order breakage rates and primary breakage distribution, Austin et. al. (1984). The rate of breakage of a given size range of particles (in this slurry, a √2 screen interval) is proportional to the amount of that size present when grinding is first-order. Thus:
Rate of breakage of size j = Sjwj(t)W
where Sj is the specific rate of breakage (fraction per unit time) of size j, W is the mill hold-up, and wj(t) is the weight fraction of size j material at grinding time t. Thus, if the starting feed contains wj(0) as the top size or as a specially traced sized in a mixture of sizes,
dwj(t)/dt = – Sjwj(t)
log wj(t) = log wj(0) – (Sjt/2.3)…………………………………………………………..(1)
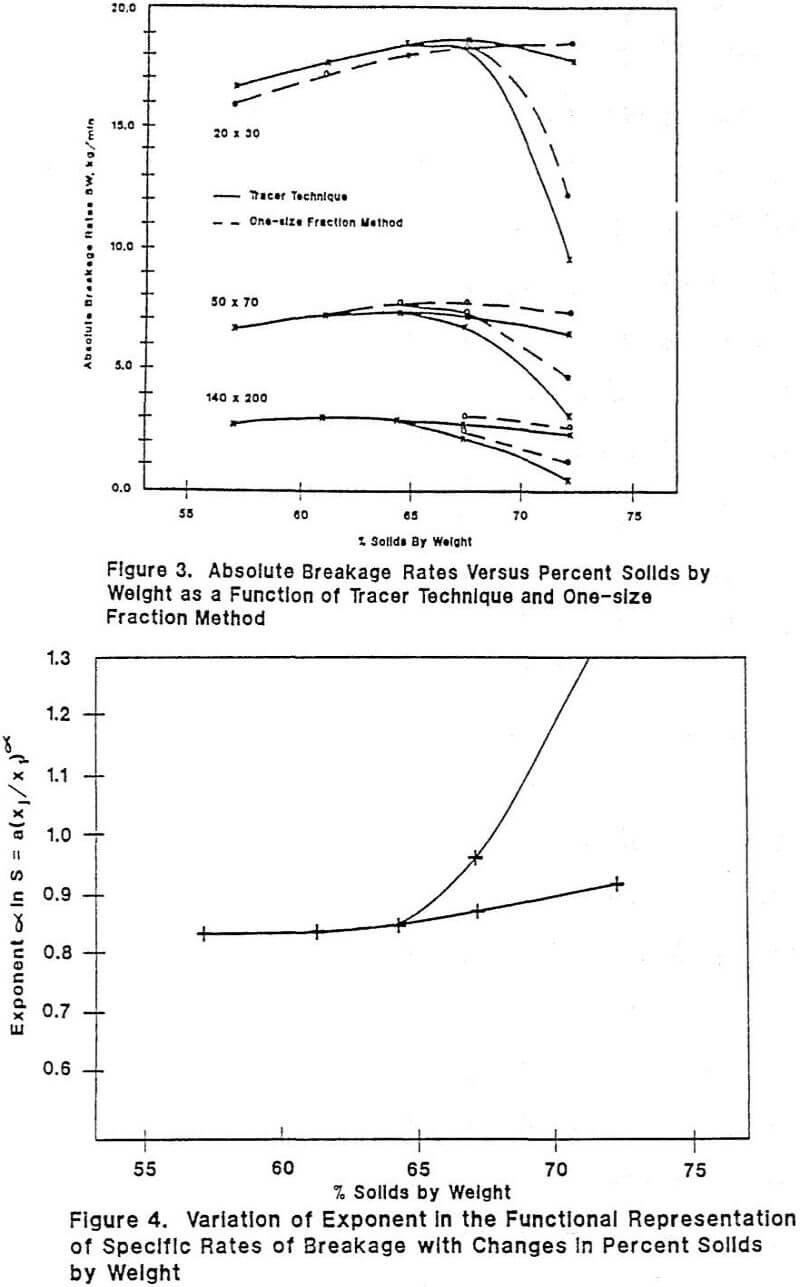
Measuring the disappearance of material from this size as a function of time, using log-linear plots, will directly indicate two important factors: (i) if the plot is linear, the size fraction j is breaking in a first-order manner; the negative slope gives the S. value; (ii) if the plot is not linear but flattens as grinding proceeds (e.g. as fines build up and viscosity increases) then a slowing-down of breakage is occurring. As the slurry volume is held constant, the weight in the mill W varies between tests. Thus, the measure of production rate to be used in comparisons is the absolute rate of breakage SW. A higher value of SW shows higher breakage rates.
The suite of fragments produced by breakage of a given size without further rebreakage of the fragments is termed the primary breakage distribution. Numbering size intervals from 1 for the largest size, 2 the next size interval, etc., the primary breakage distribution is represented by bij, that is, the fraction of just broken j material which falls into smaller size interval i. Combining specific rates of breakage with primary breakage distributions to allow for repeated breakage of all fragments gives the well-known batch grinding equation:

where the nth interval is the material less than the smallest sieve size used. Solution of this set of equations with the starting feed conditions, wj(0), gives predictions of the size distributions expected from first-order grinding for given values of Sj, bij.
The detailed experimental techniques involved in the one-size fraction testing or in the tracer method, including the calculation of Sj and bij parameters from experimental data, have been completely outlined elsewhere, e.g. Austin et. al. (1984) and will not be repeated here. In brief, a test consists of grinding identical feed charges of weight W for a range of grinding times. After each grind, the material in the mill is completely removed and sized. The bij values are calculated from data from a small time t of grinding; the weight remaining in the largest size fraction or in the specially traced size fraction is used to calculate S1; and a record is kept of all the weight fractions wi(t).


