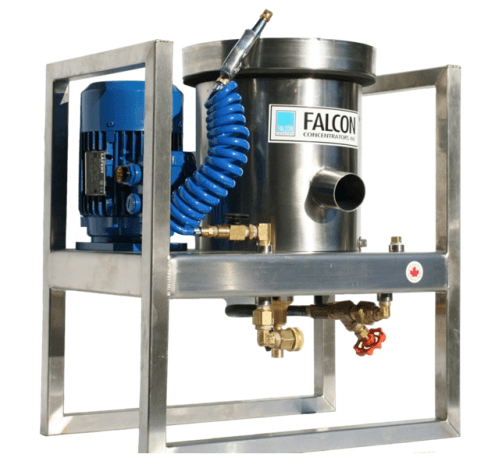
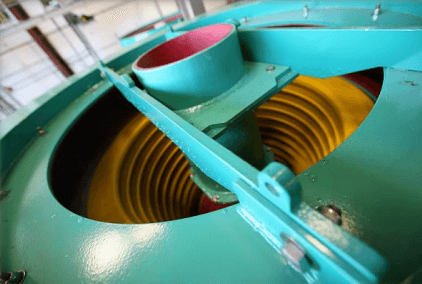
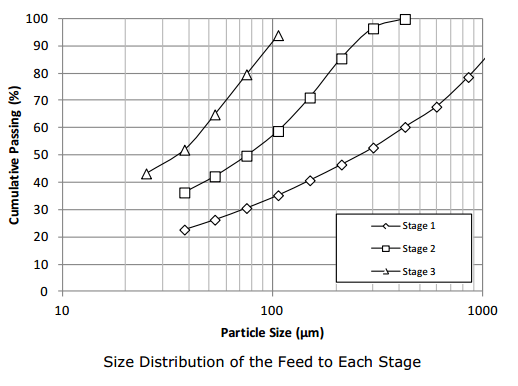
The GRG test is used to determine the theoretical maximum amount of gold that can be recovered from a sample. The testing scheme consists of three sequential liberation and recovery stages , the progressive size reduction allowing for the determination of the precious metal recovery as liberated without over-grinding and smearing coarse precious metal particles.
|
|
|
A Gravity Recoverable Gold Test (GRG) value of an ore sample provides an indication of the amenability of the ore sample to gravity concentration. The GRG testing scheme is based on progressive particle size reduction, which allows recovery of gold as liberated while minimizing over grinding. The GRG test consists of sequential liberation and recovery stages. The GRG test includes screen analysis on the concentrates and last-stage tailings with assays on each size fraction. The results are reported for overall gold recovery and GRG value as a function of particle size distribution.
GRG Test Procedure:
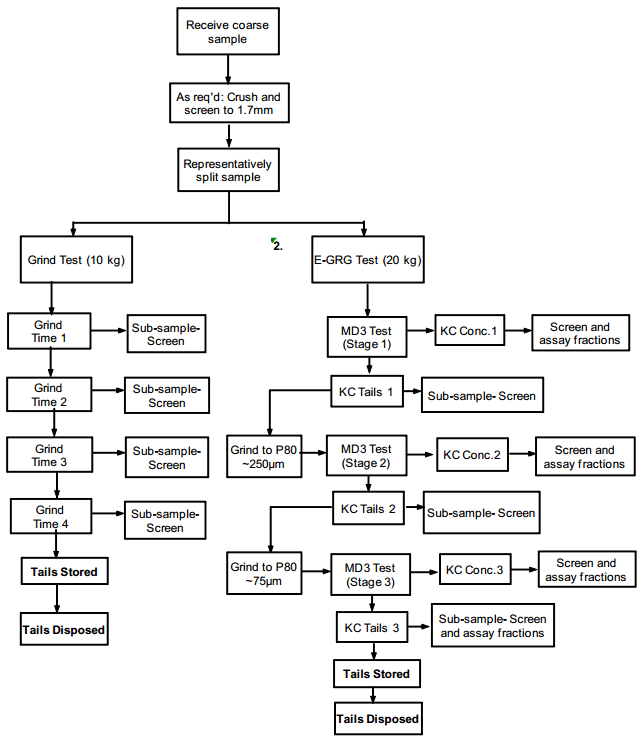
- Approximately 10kg was used for a grind test to determine the grind times required to reach the target particle sizes for the E-GRG test.
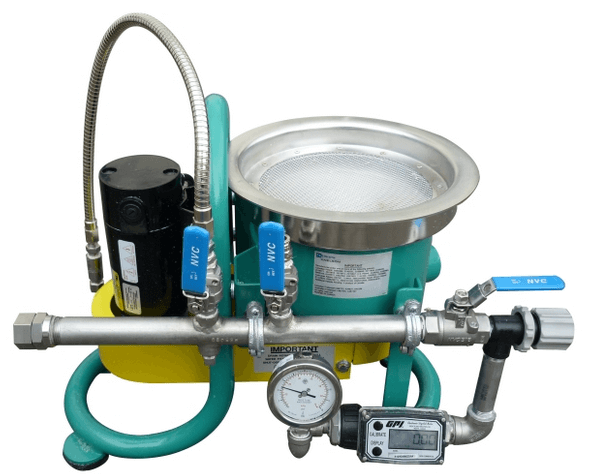
- The 3” Laboratory Knelson Concentrator (KC-MD3) operating parameters were set at a fluidization water flow rate of 3.5L/min and a G-force corresponding to 60G.
- Approximately 20 kg of sample was processed through the KC-MD3 at an approximate feed rate of 800g/min.
- During processing, sub-samples of the tailings stream were collected for screen analysis.
- The concentrate and tailings samples were screened, weighed and stored for subsequent assaying.
- The bulk tailings were ground in a rod mill and steps ii) to v) were repeated.
- The bulk tailings were then further re-ground and steps ii) to v) were again repeated for a total of three passes.
- All concentrates and last stage tails sub-sample fractions are sent for Au assays, with the final bulk tailings stored.
The results from a gravity test work are presented in two formats: overall gold recovery value as well as gold recovery by particle size.
In this example case, the GRG value after three stages was 44%. The calculated gold head grade of the sample was 1.1 g/tonne. First stage recovery attributed 10.6% of the GRG, while the second stage provided 22.8% and third stage recovery contributed 10.6% GRG at a final grind size of 76µm.
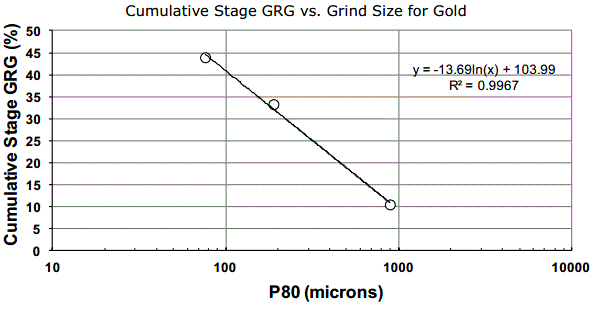

The sum of all the fractions shown in the bar graph above totals the overall gold recovery of 44%.


The P20, P50 and P80 values of the GRG are determined by normalizing the cumulative recovery vs. particle size curve of the third stage of grinding in a chart higher on here.
The P20, P50 and P80 values for this sample are 55, 122, and 218 microns respectively. Based on these values, the grain size of the GRG in the sample provided can be classified as coarse. The particle classification refers to the gold recovered from the GRG test and not the entire population of gold in the sample.
This sample has an overall GRG value of 44%. The gold head grade of the sample was calculated to be 1.1 g/tonne with a final gravity gold tailings grade of 0.6 g/tonne. The grind P80 of the final stage was 76µm. Based on project P420B by AMIRA, the concentrate gold grain sizes corresponding P20, P50 and P80 values for the sample are 55, 122, and 218, respectively thus classifying the gold recovered as coarse.
Classification of GRG in closed circuit grinding is affected mainly by the grind p80, assuming clean ores and providing the cyclones are operated under “normal” conditions, that is, typical densities and operating conditions.
To model gravity recovery, data on the GRG of the ore, the GRG classification, the GRG unit recovery of the Knelson Concentrator and/or flash flotation cell, and the GRG upgrading efficiency must be known or assumed. All modeling must be on a size by size basis to have any degree of accuracy. Where actual ore and plant data does not exist, data is taken from a database of operating plants, or assumed or calculated from other data.
Knelson has developed a size-by-size mathematical model to predict gravity recovery within a grinding circuit, called KC MOD*Pro. The model has been used numerous times for both Greenfield simulations, as well as in operating plants, which allow us to compare our predicted results with actual. The model is also a very powerful tool for determining the dominant factor(s) affecting gravity performance, and for optimizing a gravity circuit once it is commissioned. Within the error of the data we enter into the model, the results have been shown to be quite accurate. The model simply calculates a GRG population balance in a grinding circuit, as well as in the gold room if it exists.
Under any set of operating conditions, GRG is either ground into non-GRG within the grinding circuit, exits the grinding circuit via the cyclone overflow, or if a gravity or flash flotation circuit is present, is recovered to gravity or flash concentrate, and may or may not end up in the final shipped concentrate or dore bar, as determined by the upgrade circuit. Data from a database is used for preliminary modeling, and detailed audits may be carried out to “calibrate” the model to an operating circuit.
Gravity Concentration Testing
Beneficiation of ores by gravity concentration methods has been practiced longer than by flotation and doesn’t appear to be losing ground. In fact, the two techniques are frequently complementary when the advantages of both are utilized. In general, gravity beneficiation is most efficient on coarse materials while flotation is more suitable for fine sizes from 35 mesh (420 microns) but occasionally even from 8 mesh (2380 microns) in flotation down to 10 microns.
Nature frequently forms orebodies wherein the specific gravity of the desirable components is sufficiently different from the gangue or each other that gravity can be utilized to affect separation. Some indications of this difference may be obtained by physical examinations, by microscopy or even plain visual means but, more frequently, it may be necessary to test the ground ore in various heavy liquid media. The differences may be so pronounced (e.g. galena vs. silica) that recovery of coarse fractions may be simple or they may be so slight (e.g. salt vs. potash) that the separation may appear to be impossible. However, both types of ore mentioned above and many others are being beneficiated in gravity and heavy media circuits today. –
In the laboratory, differences in specific gravity which might be taken advantage of in mineral processing can be tested by superpanners, infrasizers, tables, spirals, elutriators, heavy media liquids, cyclosizers, classifiers, centrifuges, jigs, etc. Some of this equipment may not be too useful except in the laboratory or pilot plant but it is used to determine the gravity characteristics so that the proper process equipment may be selected.

