In the section that immediately follows, specific cost data for dredge operations considered representative in the industry have been updated and listed. Following this is a section on general cost data that correlates operating costs to annual production according to bucket size. These costs cover dredge operations in the Western States. Cost of dredging in subarctic areas, including that for stripping and thawing, can be two to three times higher. One of the most recent accountings of Yukon gold dredging costs is McFarland’s paper.
Specific Cost Data
Published gold dredging costs are pre-1939. While some of the costs that follow overlap this earlier period, most cover later periods through 1962. To illustrate what current dredging costs might be at various production rates, the specific examples of dredging costs that follow, which exemplify good dredging operations, were updated to 1967. Updating to a standard base year using yearly indexes of labor and commodities provides an approximate and practical means of comparing yearly costs. Except for one, all operations had standard-speed bucket lines. As explained throughout this report, dredging costs depend upon a great number of conditions, the most important being digging conditions. Another is whether a dredge is operating alone or is part of a fleet that can share service costs. The most difficult to assess is management. Over 50 years ago, Janin made a statement concerning dredging costs relative to digging conditions that is as true today as it was then, but which assumes more importance today as the allowable margins in operating costs lessen. “Dredging costs vary in different districts according to conditions encountered and methods of calculation employed, and even in the same district and under the same management dredges of similar size and design or the same dredge in different parts of the same property will show a wide difference in operating cost owing to the character of the ground dug.” While the use of “wide” does not reflect large monetary variations in unit costs, possibly only a few cents, percentage variations may be large.
The 1967 capital-cost estimates in the specific examples that follow are a 25-percent increase over those of 1960. The capital-cost estimates, f.o.b. San Francisco, include onsite erection but not applicable sales taxes. Unless otherwise noted, the dredges are standard steel-hull and superstructure design, electrically driven by power delivered from shore. Dredge housing, normally a wood-frame, sheet-steel structure, is included. Capital costs include jig treating systems on all size dredges. In the actual specific operating-cost tabulations that follow, however, only the 18-cubic-foot dredges were equipped with jigs; the others had standard gold saving tables with Hungarian-type riffles.
The operating costs include those for labor, materials, power, general, and miscellaneous. In all instances these were direct field operation costs only. To reflect the fluctuating value of the dollar in terms of what was then being purchased, whether labor, supplies, or power, the yearly unit costs were standardized by price indexes to their 1967 equivalents. While this became increasingly important as the updating period spanned longer intervals of time because of the general inflationary trend, it also became important even when updating costs for relatively short spans if they occurred at peaks and lows in the economy. The indexes listed in the appendix used to update were as follows:
Table A-1.–Index based on metal mining production workers’ average weekly earnings, for labor costs.
Table A-2.–Commodity wholesale price index of industrial commodities, for material costs.
Table A-3.–Commodity wholesale price index of fuels and related products and power, for power costs.
Table A-4.–Commodity wholesale price index of all commodities, for general and miscellaneous costs.
An index is a ratio, mean, or factor derived from a series of observations and used as an indicator or measure of a certain condition. The discrepancy of using most cost indexes is that they must necessarily be averages from various industries taken as a group so they lose some identity for the individuals within the group. The costs in an industry being updated, therefore, may not exactly be represented by the average, but for lack of more specific costs it is the best means possible.
It was evident in analyzing the original data that the labor rates in the dredging industry after World War II even after unionizing in 1947 somewhat lagged behind the national trend. While often peculiar to the more isolated locales where the dredges operated, this lag to some considerable part was because the unions recognized the need of continuing employment in an industry in which the margin of profit was narrowing. This situation was advantageous for an industry where the price of its product was controlled as was gold prior to March 1968. After workers of the dredging industry in California acquired union representation in 1947, wage rates increased annually from 5 to 10 cents per hour. The wage rates in October 1968 when the last dredge stopped were as follows:

Mechanic, electrician, and cleanup-crew rates are not shown.
The number of employees required is based on a 7-day-per-week operation with employees working 48 hours per week with time and one-half over 40 hours, Normal fringe benefits are in addition to these rates. The pension fund of $0.36 per hour paid by the dredge companies far exceeds that paid at metal mines.
The appended labor index was constructed primarily from the annual average gross weekly earnings in the industry considered most allied to dredging, metal mining, as contained in the Department of Commerce’s Business Statistics, 1967. This tabulation, however, began in 1939 so part of the index, 1930-38, had to be developed from rather meager sources of hourly wage rates paid in the dredging industry during that period. The index was built on the base of the 3-year average metal-mining gross weekly earnings during 1957-59, the base years used in the power and commodity indexes. With this 3-year average set equal to 100, the annual labor-index factors were the products of 100 times the quotients of the annual weekly average over the 3-year base average. The unit-labor cost, in cents per cubic yard, for any year can be updated to that for any other year by multiplying it by the ratio of the new to the older index factor. Weekly earnings from other industries, which varied during the depression, could not be used to develop the 1930-39 portion of the index. From both published and unpublished sources, the following hourly rates were paid through the 1930’s for the three general labor classifications of winchman, oiler, and shoreman-extra. To obtain an average hourly labor rate, the distribution of men across the three above scales for an average 14-man crew was 3, 6, 5.

Labor index factors based on 40-hour earnings at the above rates divided by the 1957-59 base average, progressed from 23.0 to 26.9 through the years 1930-38.
Some errors develop in updating from an index based on ratios of the average weekly earnings in the metal mining industry because the average weekly hours worked varied. The metal mining average in 1967 was 42.1 hours whereas the 1930-38 weekly earnings are based on 40 hours and the years after 1938, excluding war years of 1942-45 when most of the dredges were not working, ranged from the 1952 high of 43.8 hours to the 1958 low of 38.6 hours. The maximum error in the updated labor cost for the high hours of 43.8 is about 5 percent, or the labor costs in the 1952 updated unit-dredging costs are 5 percent too low. The maximum error in the updated labor cost for the low hours of 38.6 is about 10 percent, or the labor costs in the 1958 updated unit-dredging costs are 10 percent too high. In terms of a total unit-dredging cost of 14 cents per cubic yard of which the labor cost amounts to an average of 58 percent, the maximum minus error will amount to 3 percent of the total unit cost and the maximum plus error will amount to 6 percent. The straight time and overtime labor costs of dredging regardless of the rates paid or the hours worked are incremental in the unit-dredging costs and for purposes of updating do not have to be considered. The use of the index-factor ratios in updating is only a tool to standardize labor costs to a base year to free them of dollar fluctuations.
The cost data overall indicated a trend towards greater efficiency in the industry as a whole most noticeably after World War II. This probably resulted from the general updating of equipment on some of the older dredges, particularly the conversion to jigs that began in 1936-37 and continued after the war. An average 1967- equivalent decrease of about 0.12 cent per cubic yard per year was found to have developed in the operating costs of 11 dredges, which worked each in one area at about the same depth through continuous operating periods of 5 to 20 years. The operating spans for these dredges were staggered through the period 1934-64, irregularly overlapping each other. Going back, when the 1967 equivalent operating costs for each of the 11 dredges were first plotted against production, decreasing cost with increasing production was evident. To compare the costs through a span of years, they were therefore first corrected to a base production equal to the average for the span covered; or, the annual costs were weighted by the ratio of the production of the year in question over the span average. With the costs standardized as well as could be for dollar and production variations, costs against years were then plotted for each dredge, and the average change in cost per cubic yard per year was determined from the slope of the cost regressions. The supposition is that the average slope was a measure of the change in cost brought about primarily by increased efficiency in the design and use of equipment resulting in higher dredge productivity. Considerable variations were seen in the data used to compute the slopes, which individually varied from 0.05 to 0.40 cent per cubic yard per year.
The following specific cost records, other than that for one, are for dredges with standard-speed, 6- to 18-cubic-foot bucket lines. Operating conditions are provided as well as possible to explain the resulting differences in costs. Changing digging conditions have been the main cause in changing costs. Not included are depreciation, general overhead, interest, royalty, and a return on invested capital. While dredge depreciation for tax purposes can be set up for a 10-year straight-line period, recovery of capital investment from dredging returns is often set up for longer periods depending on the size of the deposit or deposits to be mined and the long-range plans of the company. Again, the updated costs are approximate and because they are isolated examples for specific years they could not be adjusted to reflect the general change in productivity that took place in the industry.
Table 1 contains data of one 6-cubic-foot portable dredge. This was the first of many of this type and capacity built by Yuba Manufacturing Co. The dredge worked in six different locations in Montana, California, and South Korea. The first operation, in Montana, covered 448 days. It was then moved to the example 2 site in California, losing only 83 days moving time, where it worked 1,398 days. Again it was moved to another site in California 150 miles away where it worked intermittently (examples 3 and 4) over a 12-year period (delay due to World War II) for 1,532 days. It was moved again to another property (example 5) where the formations and conditions were tough, which resulted in increased costs. Its maximum monthly production was in July 1942 when it dug 205,527 cubic yards for a daily average of 6,630. After the last operation it was moved to South Korea and worked two known properties. This 6-cubic-foot dredge proved popular for its capacity fitted many properties, its capital cost was comparatively low, and its size and construction permitted moving with limited cost.
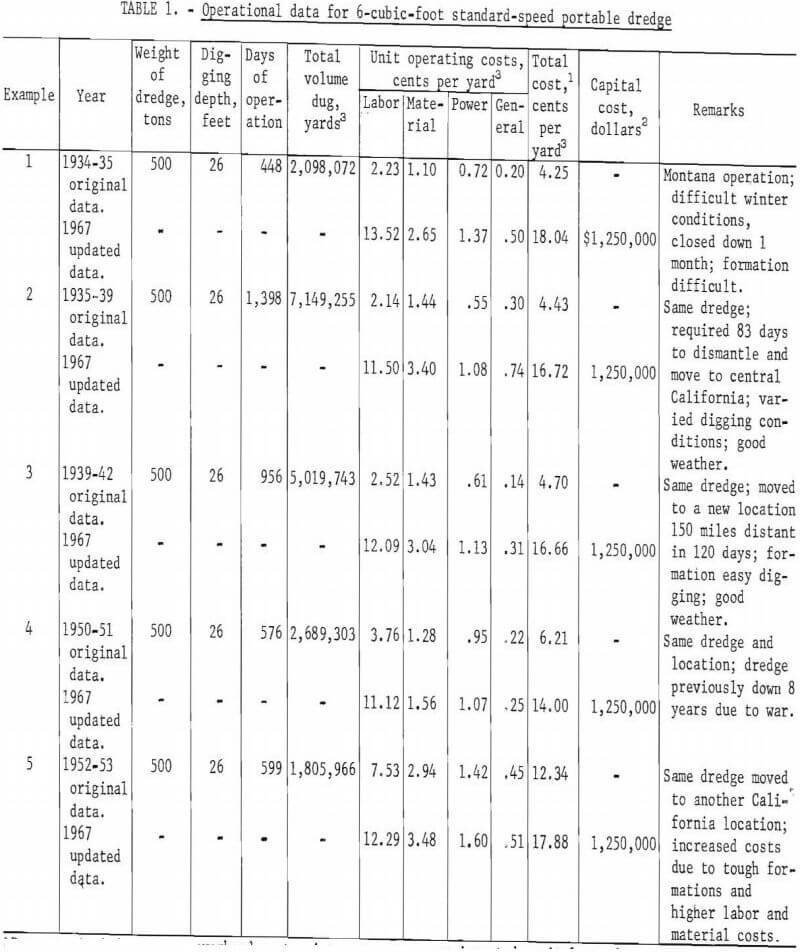
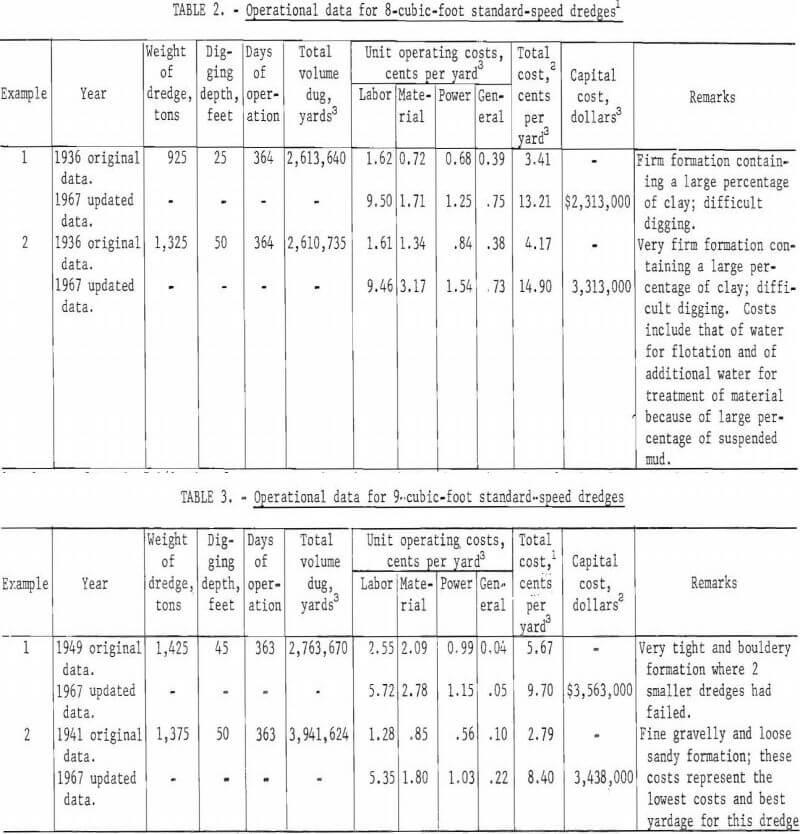
Table 2 contains cost data for 8-cubic-foot dredging operations. It provides a comparison between dredges operating in similar difficult digging formations but at different digging depths. In easier digging ground, costs would have been lower. These were sturdily built early-day dredges that had their 7- and 7½-cubic-foot buckets replaced with 8- and 8½-cubic-foot buckets when the dredges were modernized. The Goodnews Bay Mining Co. dredge, which was recovering platinum-group metals and byproduct gold in 1968, was a standard nonportable 8-cubic-foot dredge. Another dredge of this size, but a portable type, was especially designed to operate under extreme bouldery conditions in a gold placer in Colombia, South America. It had a sectionalized pontoon hull fastened with bolts that stood up well under tough digging conditions.
Cost data pertaining to 9-cubic-foot-size dredges are in table 3. The dredge in example 1 was operating in a very tight and bouldery formation while the dredge in example 2 was operating in a fine gravel and loose sandy formation and at a slightly deeper digging depth.
The 9-cubic-foot-bucket capacity dredge has made outstanding records which have proven it to be the most economical size to use between digging depths of approximately 30 and 80 feet. Under certain conditions, mainly favorable digging formations, bucket capacity was often increased to 10 cubic feet to increase yardage and decrease operating cost.
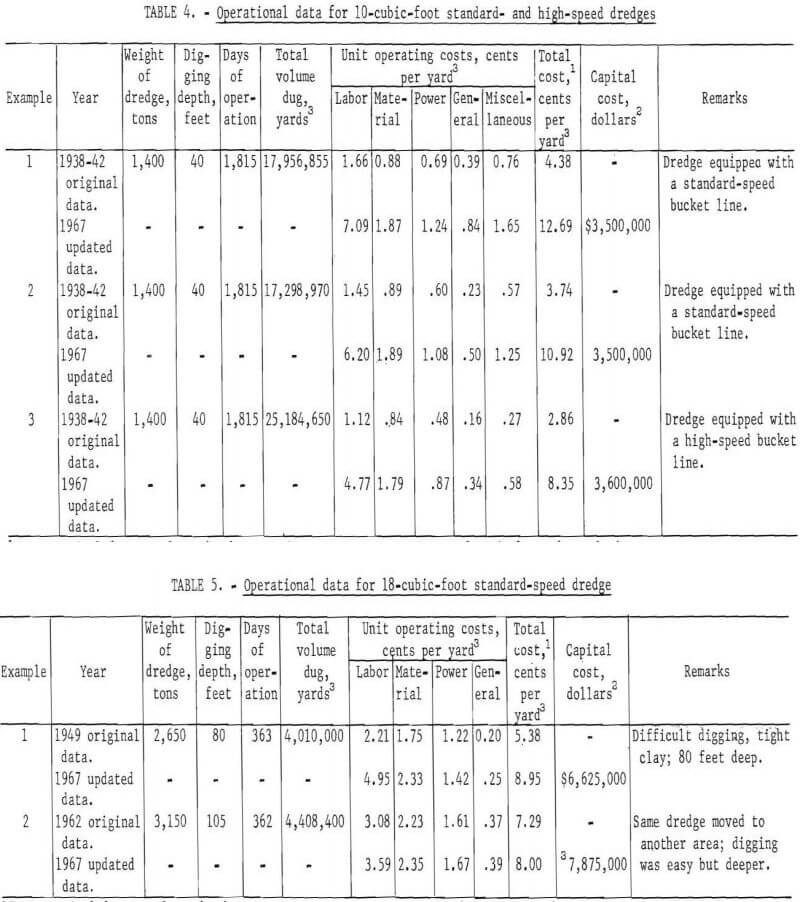
Table 4 shows operating costs on three 10-cubic-foot dredges. These made up a three-dredge project in which two dredges worked in adjacent areas while the other operated about 15 miles distant. The formations were similar and classed as easy digging and washing. Location was in the upper San Joaquin Valley, California. Dredges in examples 1 and 2 were equipped with normal-speed ac-powered bucket lines while the third dredge was equipped with a high-speed dc-powered bucket line using Ward Leonard controls for digging and swinging and ac motors for other powered equipment.
The general expenses and miscellaneous costs were not evenly divided as the dredge described in example 1 bore about half of these charges; the remainder of the charges was equally divided between the other two dredges. However, this does not seem to be reflected as much in the costs as would be supposed. This operation had good, experienced management and more than one dredge in an organization to carry the overhead costs.
Table 5 contains operating data of an 18-cubic-foot dredge in 1949 and 1962. Example 1 presents cost data of a dredge operating in tight clayey formation, which was difficult to dig. Digging depth was approximately 80 feet below water level. The clay in the formation required that the pond water be changed frequently for better treatment. The digging rate had been reduced from about 5½ million cubic yards in prior years to increase recovery. Example 2 presents data again of the same dredge, but it had been moved to a new location where it was digging 105 feet below water level in an easily dug formation.
With only one exception in the United States–in California, the largest bucket capacity dredge used in gold placer mining operations was 18 cubic feet. For digging depths of over 75 feet, this capacity dredge has proved to be most economical. The maximum depth this size dredge has dug in California gold placers was 124 feet below water level. Reports have been made over the last several years that such a dredge will be digging to 162 feet in the U.S.S.R.
Generalized Relations between Direct Costs and Production
In figure 6 is plotted a family of curved envelopes that generalize the relationship between direct dredging costs for standard-speed bucket lines and the annual cubic yards produced according to bucket size. The data consist of 151 dredge years grouped in five bucket-size ranges of 2½ to 3½; 6; 7 to 7½; 8 to 10; and 15 to 18 cubic feet. The choice of ranges, while in part a matter of the data available, was to simplify their presentation by classes of similar potential. Their years of operation are scattered through the
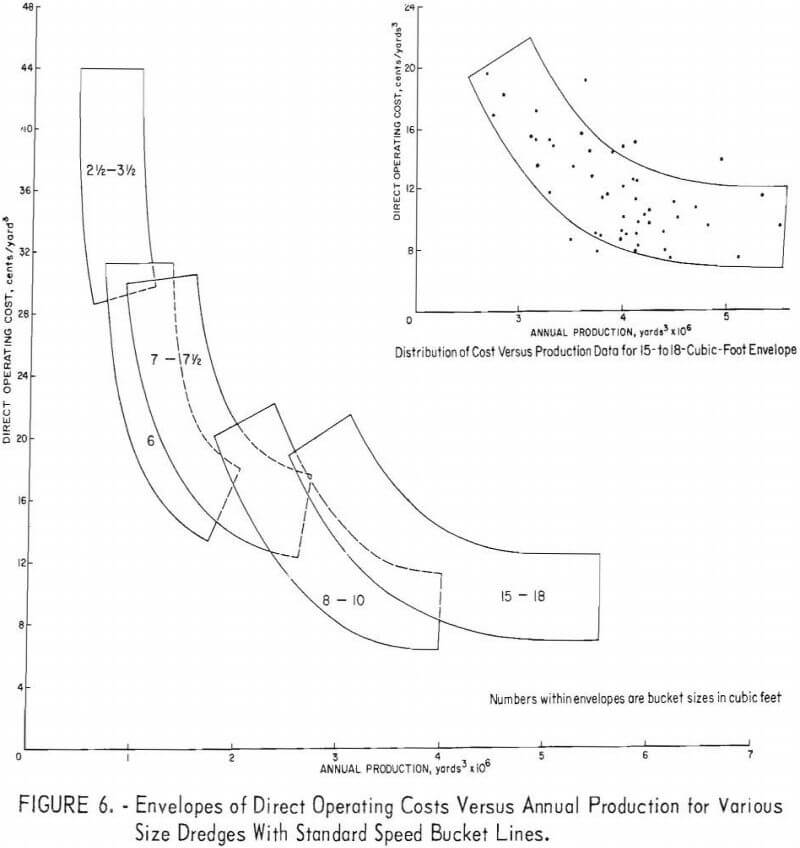
period of 1930-66, all operating costs updated to 1967 by the same index systems covered previously. The costs do not include overhead and administration, equipment depreciation, royalty, or taxes. While improvements in dredge capacity had some improving effects on the mean costs of individual or group operations, these were probably minor with respect to the larger cost fluctuations brought about by wide variations of good to difficult digging conditions, of efficient to less efficient equipment design and utilization, and of good to less than good management. The dredges were not all up-to-date equipment; many were as much as 30 years old and most through the 1930’s and 1940’s incorporated various stages of dredge improvements.
The size of each envelope is a measure of the span of its data, which reflects the range of operating conditions under which the dredges worked in general, the more data the larger the envelope. This does not hold for the 8- to 10-cubic-foot size, which contains 60 data points as compared to 50 for the larger 15- to 18-cubic-foot size. Not all of the data lie within their respective envelopes either although a maximum limit of 10 percent outside each envelope was a pre-established aim. The distribution of points in and around the 15- to 18-cubic-foot envelope, the envelope with the widest outside dispersion, is shown in the upper right-hand corner of figure 4. Of its 50 points, six or 12 percent lie outside reflecting still wider variations in cost. Lying outside their respective envelopes are 12 percent, seven of 60, in the 8- to 10-cubic-foot size; 5 percent, one of 19, in the 6-cubic-foot size; and none in either the 7- to 7½- or the 2½- to 3½-cubic-foot sizes. Altogether, 9 percent, or 14 of the 151 points, lie outside envelopes.
Each envelope takes on the general trend of its data and lays sickle-shaped in echelon with those on each side. Some liberty was taken to make the sides of each envelope symmetrical, but where an extreme point was included, the envelope was laid out so that it would not indicate a more extreme possibility. As might be suspected, some portions in the higher cost, lower production areas of each are overlapped by the lower cost, higher production areas of the next smaller size. Overlapping is irregular, again indicative of the great variety of conditions that affected costs.
The trends through the envelopes, whether taken together or individually, show that production costs become less dispersed as production increases. Within each envelope the trend is toward steeper cost gradients as production decreases and flatter gradients as production increases. Going from left to right a general pattern develops where the envelopes trend from a cost-oriented direction to more of a production-oriented direction. The envelope of the smallest size dredges indicates a relatively wide possible variation in cost through a limited range in production while that of the largest indicates a more limited variation in cost relative to a wider range of production.
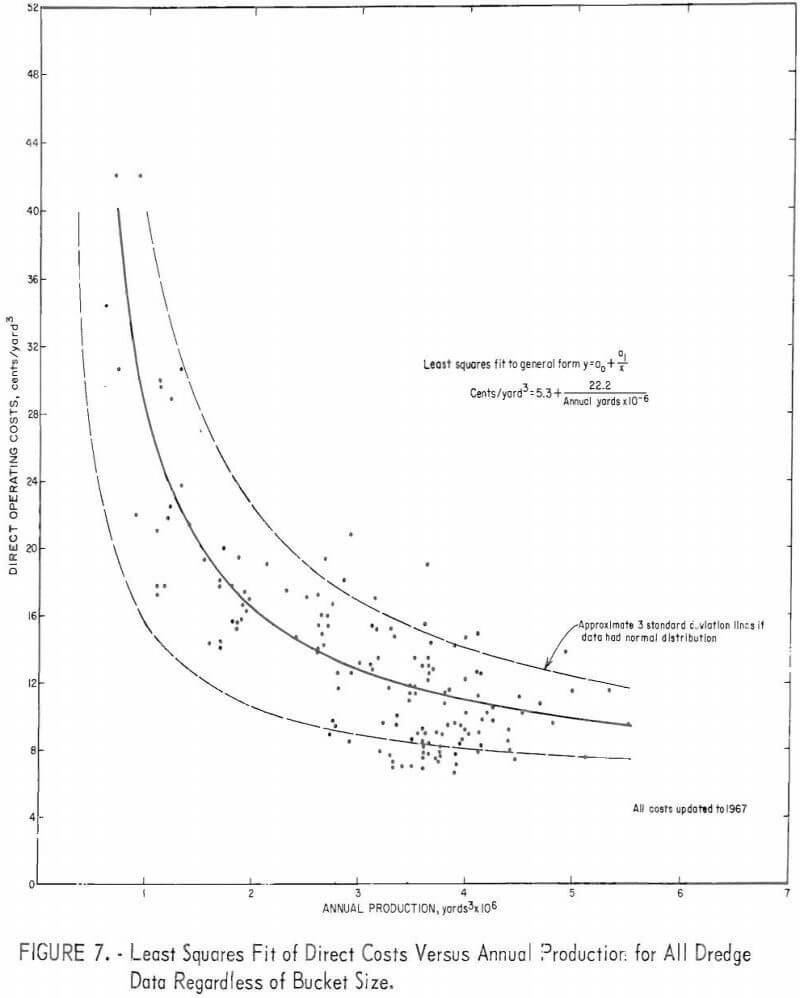
There appears an inconsistency inhere the low-cost end of the 8- to 10-cubic-foot envelope dips lower than the 15- to 18-cubic-foot envelope, even at its low-cost end. The points that affect this low can be seen clustered below the minus-3-standard-deviation line (lower dashed line) on figure 7. The difference in the minimum costs for these two size ranges is not a factor of a slightly larger sample for the smaller size range but reflects the cost
increment of digging deeper with the larger sizes. As previously noted, when working in gravel no deeper than 80 feet, the 9- to 10-cubic-foot dredge has a history of being the most economical size to use. The effect of depth–124 versus 80 feet at Hammonton, Calif. on dredging costs were first reported in 1940 by Romanowitz, ” The unit operating costs of these deep-digging dredges are higher than those of shallower dredges, due to the smaller yardage and higher cost of replacements.” In 1941 it was generalized that the unit costs for deep-digging dredges averaged about 1 cent more per cubic yard than that for shallower dredges in the same field operating under similar conditions, and in 1948 the difference in operating cost between 124- and 80-foot-deep dredges was estimated to range from 15 to 20 percent. The latter 15- to 20-percent difference between 80 and 124 feet, however, contained the factor of tougher digging beginning at 90 feet where the dredges were operating. The axes through the high production ends of both the 8- to 10- and the 15- to 18-cubic-foot envelopes in figure 6 show that the average for the smaller size is about 1 cent per cubic yard less than the average for the larger. There is no doubt that the envelope data cover a wider range in operating conditions than that earlier reported, but the data points that shaped the high-production end of the largest envelope represented an average of 95 feet as against the above-cited 124 feet.
To develop some overall trend that might better picture operating costs as an effect of annual production regardless of how or what controlled the amount of production as bucket size, digging conditions, management, etc., a number of curves were fitted to all of the data taken together. The best fit (fig. 7) was the least involved, a first-degree polynomial with the general form of y = ao + a1/x, where y equals costs in cents per cubic yard and x equals production in cubic yards. As expected from the shapes of the individual envelopes, the distribution of the data was not normal about the general curve. Clusters of points, about one-fifth of the total, lie outside the approximate 3-standard-deviation lines. These outside points are valid and in part account for the end shapes of the envelopes. The 3-standard-deviation lines were calculated from an approximate formula based on normally distributed data. The cost-production equation as noted in figure 7, therefore, has limited meaning for cost estimation. If the plus-3-standard-deviation is thought of as an upper limit of costs, it would contain all but 6 percent of the data and would seem to be a safe estimator. Going back to the earlier statements in this report that deposit-evaluation and dredge-feasibility appraisals should be left to those competent, the relations in figures 6 and 7 should take on more meaning.
