Table of Contents
Until several years ago the fluorescent X-ray spectrographer was limited to the K series for elements of atomic numbers 22-60 and to the L series for higher atomic number elements. Upon commercial development of the flow-proportional counter used in conjunction with a pulse-height analyzer and a helium path, the author investigated the longer wavelength radiation of the K, L, and M series of elements, of atomic numbers 13-22, 42-60, and higher atomic number elements, respectively, for possible use as analytical lines.
Theoretical calculations and experimental studies were made on the line intensities and line-to-background ratios for three classes of samples: (1) Infinitely thick (for example, powders, solutions, and metals), (2) intermediate thickness (for example, ion-exchange membranes), and (3) very thin (for example, oxidized layers, such as antimony oxide on molten lead).
Theoretical Calculations
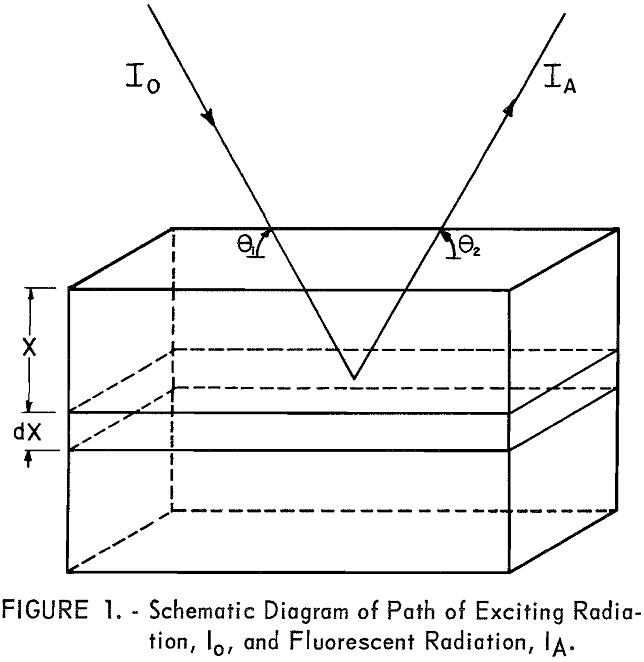
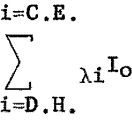
The fluorescent X-ray intensity from element A in the volume S dx can be derived as follows: Let Io (see fig. 1) be the intensity of the incident radiation of wavelength λi at the surface of the sample. All radiation between λD.H. and λC.E. is effective in exciting element A,
where
λD.H. = hc/Ve Duane-Hunts law
λC.E. = critical absorption wavelength for A (can be K, L, or M edge, depending on atomic number of A).
The intensity of the incident radiation is reduced by the factor eλi-µ · x/sin θ when passing from the surface of the sample to the layer S dx,
where
λiµ = linear absorption coefficients of matrix for incident radiation,
θ‚ = angle between incident radiation and surface of the sample; beam divergence is neglected,
S = effective excited sample area, limited to approximately 0.75 by 1.0 inch by parallel plate collimator,
X = perpendicular distance from surface of sample to excited atom.
If WA is the weight fraction of A then there are WA · ρ · S dx · N/Atimic weight A atoms of A in the layer S dx,
where
ρ = density of sample,
N = Avogadro’s number.
The probability of atom A emitting a particular line is related to λiγ the photoelectric absorption coefficient; r, the fraction of the exciting radiation which results in raising the atom to the required energy state; F, the fluorescence yield; and P, the probability that a given electronic transition, that is, L, , , → K emitting Kα radiation, will occur. With all these factors considered, the fluorescent intensity of a characteristic line of A can be expressed as follows:

The intensity of the fluorescent radiation F is also reduced by the absorption term eλA-µ · x/sin θ2, where is the linear absorption coefficient of the matrix for radiation λA. Also the measured intensity is reduced by blocking of the collimator B, diffraction efficiency D, percent transmission T of X-radiation through air or helium, and detector efficiency E. For a given kilovoltage and millampere setting the intensity dIA can be expressed as follows:

Equation 2 is difficult to evaluate because of the interdependence of X and λ; however, where the samples are thin layers or microgram deposits, e -x terms are approximately unity as

The T term can be considered as independent of the element being determined, since the transmission coefficients for longer wavelength radiation, 1-5A through helium are approximately unity (see table 1). Also, the B term is constant if the same collimator is used for all measurements. With these considerations, equation 2 is reduced to the following expression:

where A is the number of grams of atom A and λiγ is now the mass absorption coefficient. If λiγ is the atomic absorption coefficient then A is the number of A atoms present.
Evaluation of Terms
The wavelength distribution of the contiguous radiation from a thick target X-ray tube, operated with a full-wave rectified power supply, can be expressed by the following relationship:

where
λo = 12.35/Vt (kilovolts)
Vt = Vpeal sin 2πft. f = frequency t = time,
T, = transmission coefficient, calculated for 1-mm. beryllium window.
A series of intensity values for various wavelengths was calculated for nine values of Vt where 2πft. were varied in 10° increments up to 90°. The average intensity for each wavelength is given in column 2 of table 2.
These values correspond to the relative intensity distribution of the continuous radiation inside the X-ray tube. The longer wavelength X-rays are absorbed preferentially in the X-ray tube window, as shown by the transmission coefficients listed in column 3. Column 4 then gives the relative intensity distribution reaching the surface of the excited sample.
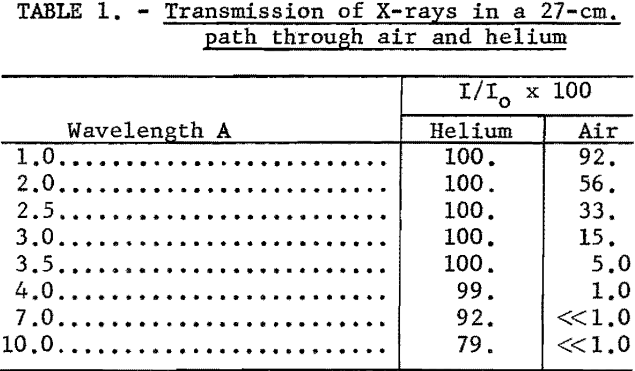
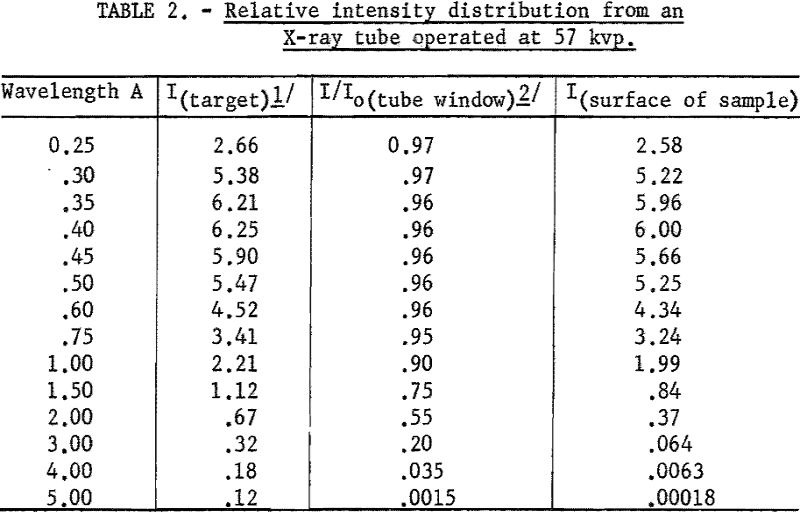
From examination of column 4 it is apparent that very little long-wavelength radiation is incident on the surface of the sample. Therefore, all of the scattered radiation observed in the long-wavelength region must be higher order wavelength radiation, which can be discriminated against by pulse-height analysis.
λiγ Photoelectric absorption coefficients are related to the atomic number of the atom and the wavelength of the incident radiation by the following expressions
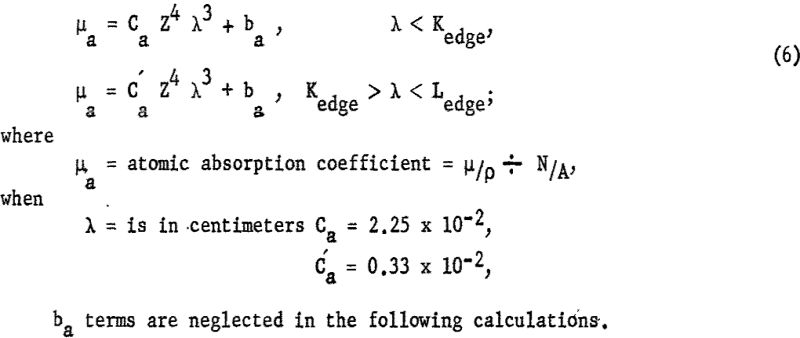
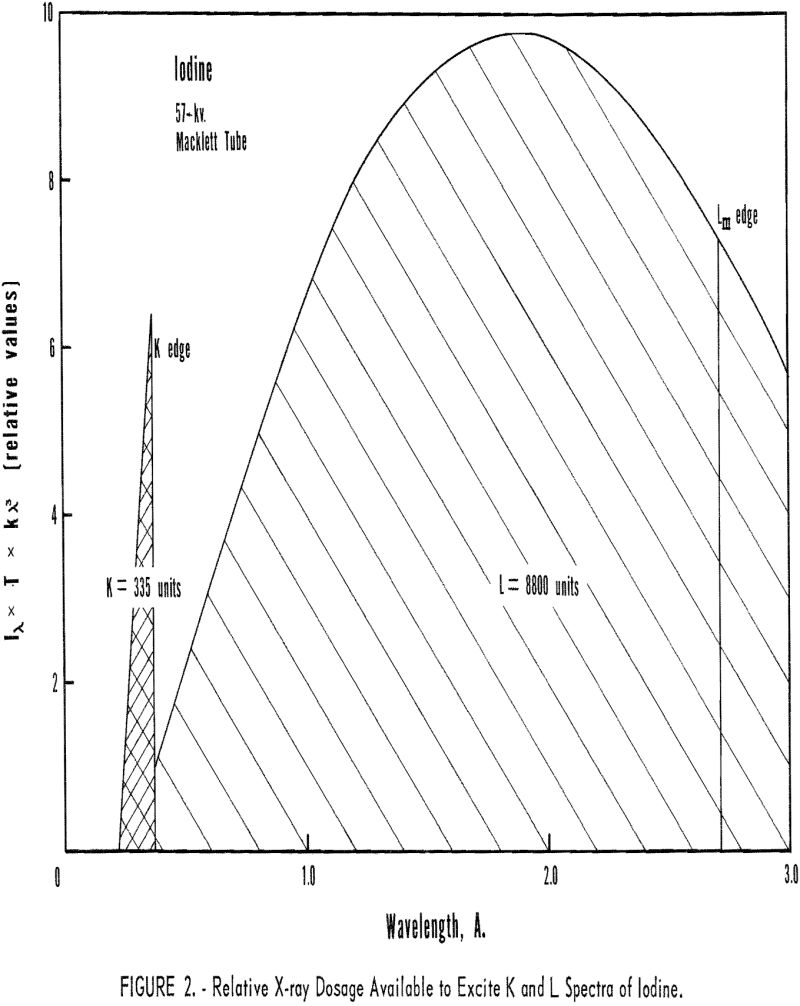
For a given element the relative dosage rate can be calculated by multiplying the intensity of the incident radiation by the appropriate value of µa. A plot of these terms is shown in figure 2 for the K and L excitation of iodine, atomic number 53. In all the theoretical calculations and experimental studies 57 kvp. was used, as that value approximates the highest operating voltage obtainable in this laboratory.
The characteristic radiation, WL series, of the X-ray tube was neglected in the calculations. However, the characteristic tungsten radiation will only excite those elements that can be ionized in the K, L, or M shell by radiation longer than 1.2A.
Two important observations to be made from figure 2 are essential to this discussion: (1) A much greater X-ray dosage is available for exciting elements emitting long wavelength (approximately 22/1 for IodineL/IodineK) (2) Most of radiation that raises the atom to the L or M ionized state is of shorter wavelength and can be effectively discriminated against by pulse-height analysis.
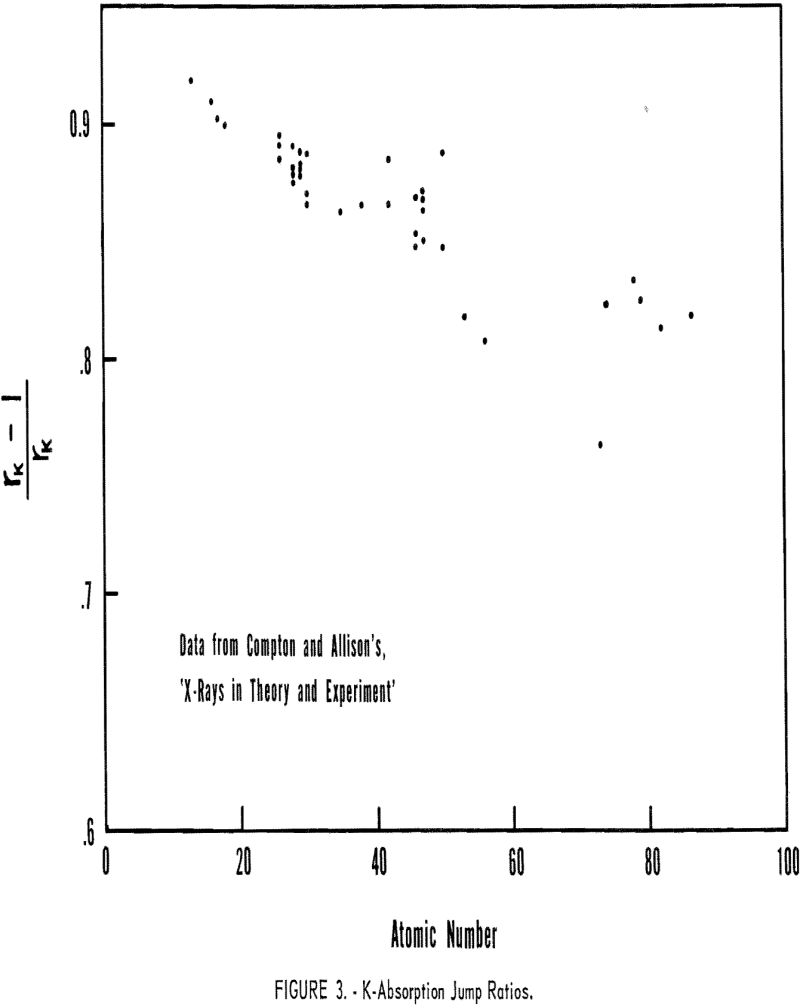
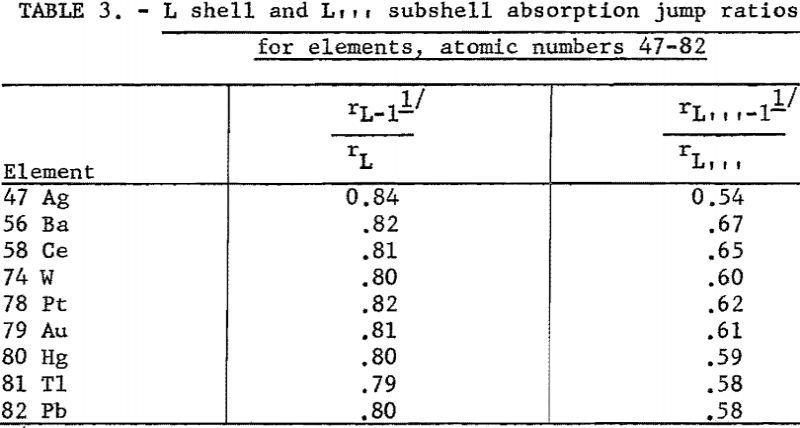
The r terms represent that fraction of the radiation absorbed which raises the atom to the K- or L-ionized state. These values are computed by measuring the ratio of the absorption coefficients across the critical absorption edge; for example, if the absorption coefficients across the K absorption edge were 100 and 20, respectively, then 80 percent(100-20/100 x 100) of the radiation absorbed resulted in a K-ionized atom. Figure 3 shows the rK values for selected elements between atomic numbers 13 to 90, while the rL values for certain elements, atomic numbers between 47 and 82, are listed in table 3.
F; the fluorescence yield factor, which varies systematically with atomic number, is defined by Stephenson as the ratio of the number of fluorescence K quanta emitted to the number of atoms ionized in the K shell per unit of time. The definition for the L and M ionized atoms would be similar.
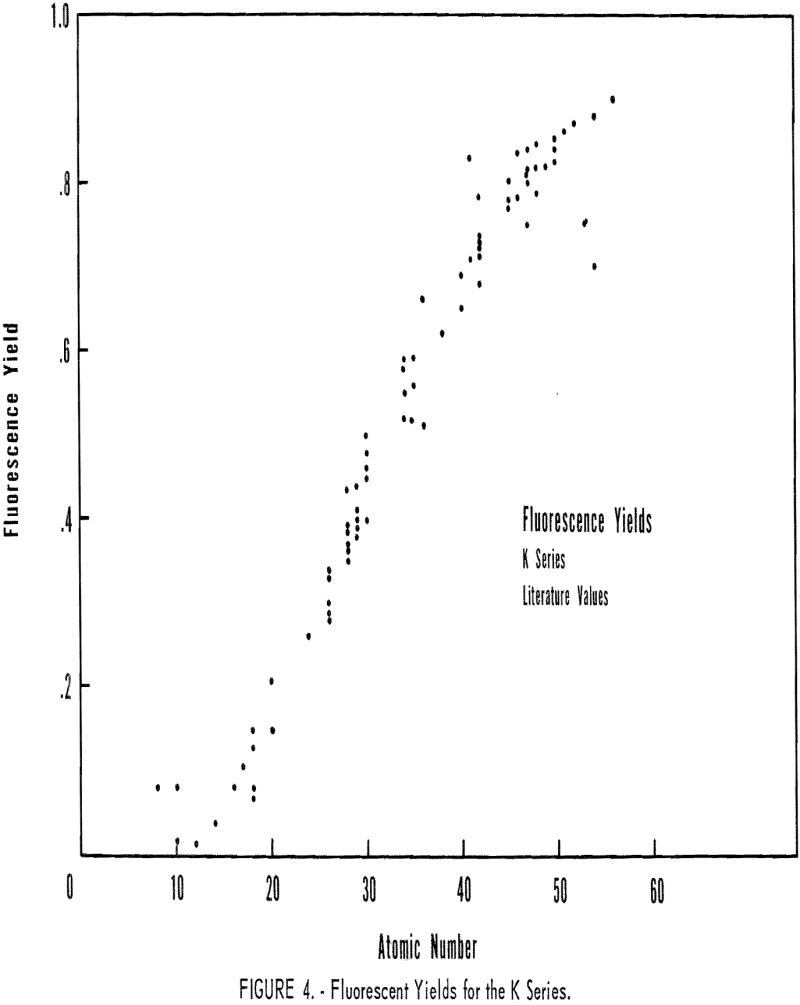
Fluorescence-yield data for the K series are presented in figure 4. The author made no attempt to evaluate the different values reported by various investigators for the same element. A theoretical relationship between F and atomic number was given by Stephenson:
F = b Z4/1 + b Z4, where b = 1.127 x 10 -6……………………………………..(7)
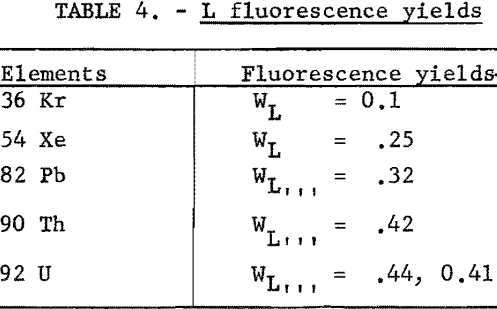
Fluorescence yields for the L series were difficult to locate; however, the few values found are given in table 4. No attempt was made to find fluorescence yields for the M series.
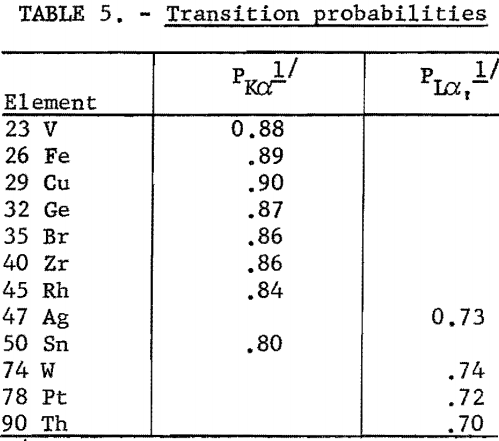
P; transition probabilities for the Kα doublet and the Lα line are summarized in table 5. These values were determined by dividing the intensity of the spectral lines (Kα or Lα) by the sum of the intensities for all lines originating from the same energy level, for example,

The transition probability for the Lα, line was calculated for the lines originating from the L,,, ionized atom.
D; the diffraction efficiency is proportional to the coefficient of reflection RC. This coefficient is the fraction of a monochromatic beam that is effectively diffracted at the Bragg angle. In this paper the prime interest is how RC varies with wavelength, since lithium fluoride is used for the wavelength range 0.3 to 3.0 A. Compton and Allison reported calculated RC values of 1.98 and 4.00 x 10 -5 for wavelength 0.71 and 2.94 A, respectively, for single crystals of calcite. The corresponding values measured experimentally were 2.31 and 4.70 x 10 -5. Theoretically, RC is related to the square of the wavelength for mosaic crystals; therefore, a much higher diffraction efficiency would be expected for longer wavelength radiation. The RC values on page 404 of Compton and Allison’s book were used for all calculations.
As the analyzing crystal may not accept the entire flux from the collimator at small theta angles, a second term must be included where:
Percent E.F. = 1 sin θ/0.75 x 100…………………………………………(9)
where
Percent E.F. = percent radiation from collimator viewed by the analyzing crystal,
l = length of crystal in inches,
0.75 = width of collimator in inches.
Since nλ = 2 d, sin θ, equation 9, can be expressed more usefully as:
Percent E.F. = l n λ/1.5 d x 100…………………………………………………(10)
E; the scintillation counter (Philips Electronics No. 52245) is rated to have a quantum counting efficiency in excess of 95 percent for the wavelength range 0.3-1.0 A. In addition, the phosphor in this counter views the total flux of the diffracted spectral line.
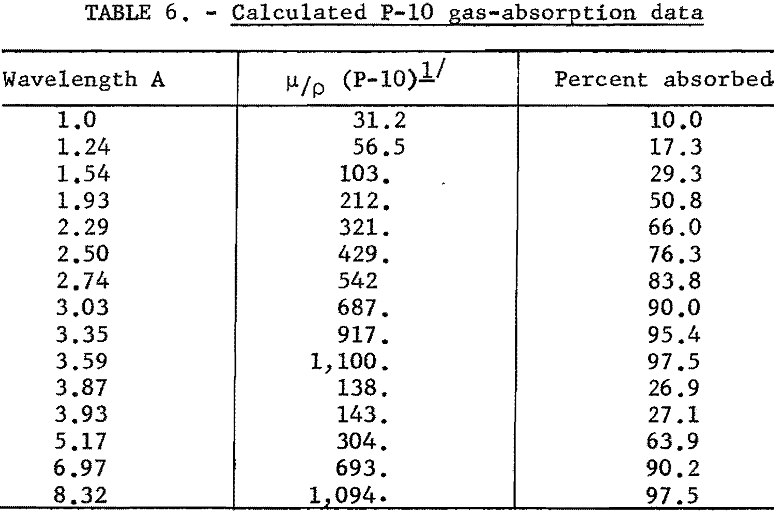
The counting efficiency of the gas flow-proportional counter (Philips Electronics No. 62033) varies with wavelength, as indicated by the gas-absorption data in table 6. Since this counter has an opening of approximately 3/8 by 5/8 inch, only half of the total flux from the collimator enters the counting chamber.
Sample Calculation
One method of checking the agreement between theoretical calculations and experimental results is to compare two lines; for example, CaKα and ILα, of approximately equal wavelength. Using these spectral lines the diffraction efficiency D and detector efficiency E terms cancel out, giving the following expression for the intensities from equal weights of calcium and iodine:
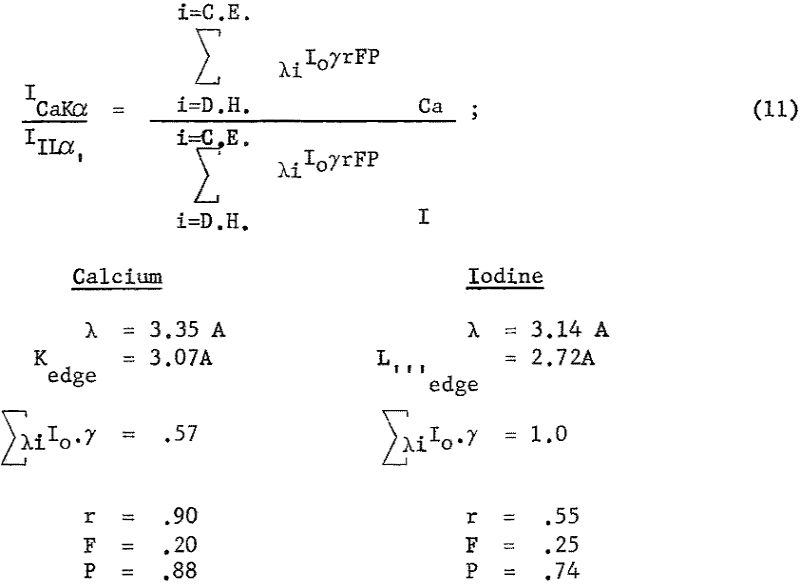
Placing these values into equation 11 the ratio of ICKα/IILα approximately unity is calculated, whereas the experimental value is closer to 2/1. The author considers this to be a satisfactory agreement, considering the uncertainty in many of the terms. For example, refer to equation 6, where Ca’ value is given as 0.33 x 10-², when λ is expressed in centimeters. Using published mass-absorption coefficients, Ca’ value of 0.0028, 0.0024, and 0.0018 were calculated for wavelengths of 0.88, 1.43, and 2.29 A, respectively. When determining the optimum choice of spectral line for analysis, factors of 10 or more will be common if comparing line intensities and line-to-background ratios of the K and L series, so that factors of two are not significant.
Experimental Investigations
K Spectral Lines for Lower Atomic Number Elements
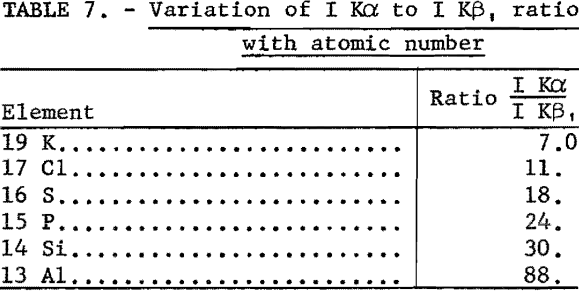
Because of the low fluorescence yield of the elements below titanium and the small depth of penetration of their characteristic K lines, these elements were considered insensitive; however, these studies indicate that these elements are not necessarily insensitive, since (1) the K lines of adjacent elements are widely dispersed, (2) their Kβ lines are quite weak as shown in table 7, and (3) the backgrounds are very low for reasons discussed in the theoretical section. The wide dispersion of spectral lines in conjunction with weak beta lines permits the use of a minimum of collimation with the resulting increase in line intensity. Therefore parts per million of these elements in infinitely thick samples can be detected under favorable conditions, such as shown in table 8.

In microgram deposits or thin layers the K lines of elements such as calcium are one-fourth the intensity of the most sensitive elements; for example, nickel and copper, and the line-to-background ratio of calcium is higher. Therefore, limits of detectability do not decrease as rapidly as suggested early in the field of X-ray spectroscopy.
K and L Intensities From the Same Element
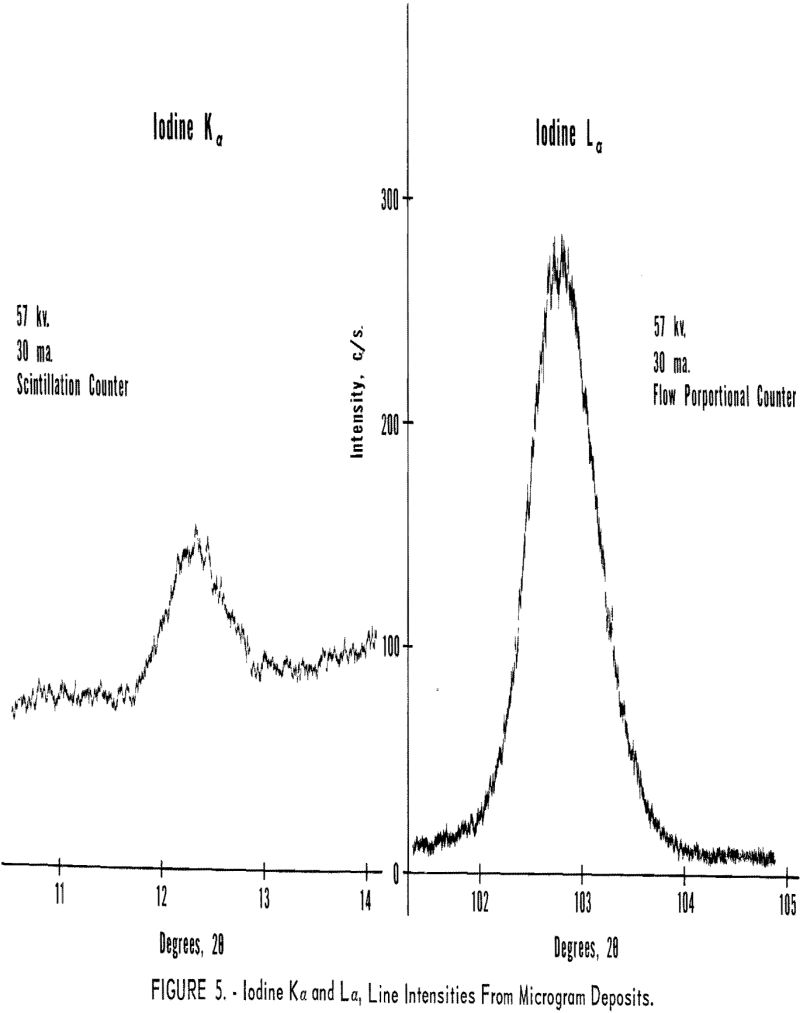
The initial tests were designed to compare the Kα and Hα line intensities and line-to-background ratios for elements around atomic number 50. The first sample consisted of a 0.25-mil Mylar film supporting approximately 100 µg. of iodine. This sample was prepared by lightly brushing a square inch of the Mylar with an iodine swab. Figure 5 illustrates the excellent intensity and line-to-background ratio obtained with the long wavelength iodine Lα radiation as compared to the high-energy iodine Kα line.
The calculated ratio of IIKα to IILα was obtained as follows:
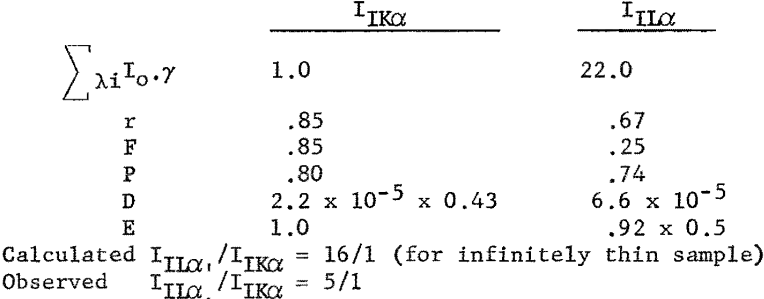
As expected from the theoretical expressions derived earlier, the longer wavelength lines are stronger than the shorter wavelength radiation when extremely thin samples are used, tinder these conditions only a small fraction of the higher energy radiation is absorbed in the thin sample, while a high percentage of the longer wavelength radiation is absorbed, which raises the atom to the L ionized state. Also the transmission coefficient (escape probability for long wavelength radiation) through the thin layer is high, resulting in effective excitation of the L lines.
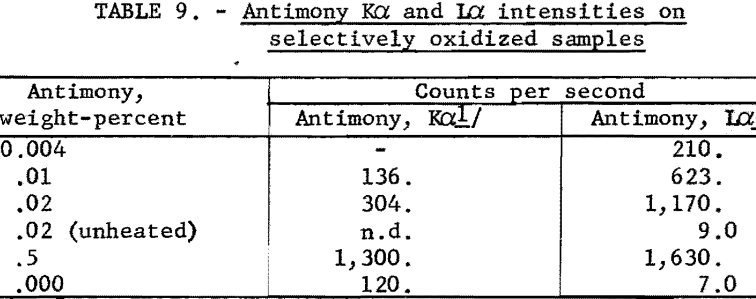
Samples of the second type studied were high-purity lead, which contained small amounts of antimony. These samples were heated under controlled conditions to selectively oxidize and concentrate the antimony on the surface of the heated sample. It was observed that antimony was not ionized effectively in the K shell, since the primary short wavelength radiation was not strongly absorbed in the thin surface layer; however, the longer wavelength radiation is highly absorbed in the surface, resulting in L-ionized antimony, which emits strong antimony L radiation (see table 9). These data show a possible application of the L-series radiation for analyses in the parts-per-million range by preconcentrating the impurity element on the surface of the sample.
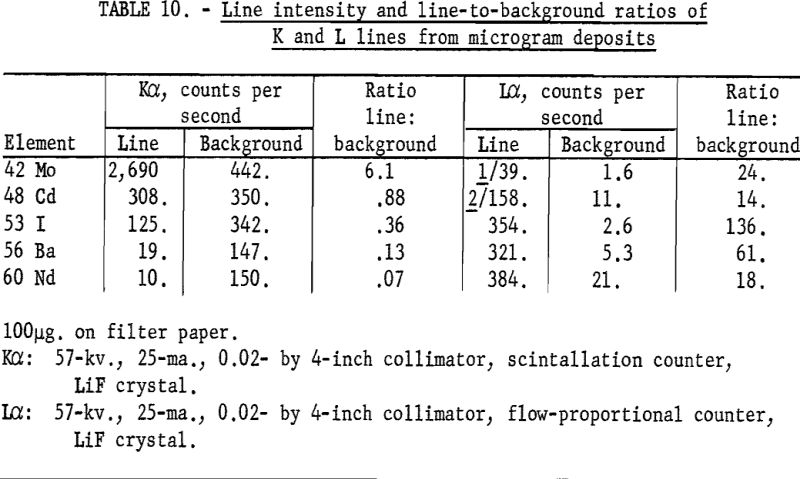
Other methods for determining impurities in high-purity materials involve preconcentration of the desired elements by precipitation and collection on filter paper or by using ion-exchange membranes. Table 10 summarizes the Kα and Lα intensity data for elements (atomic numbers 42-60) using filter paper as the supporting medium. These samples were prepared by placing 0.100 + 0.005 ml. of solutions containing 1 gram per liter of the desired element on a good-grade ashless filter paper.
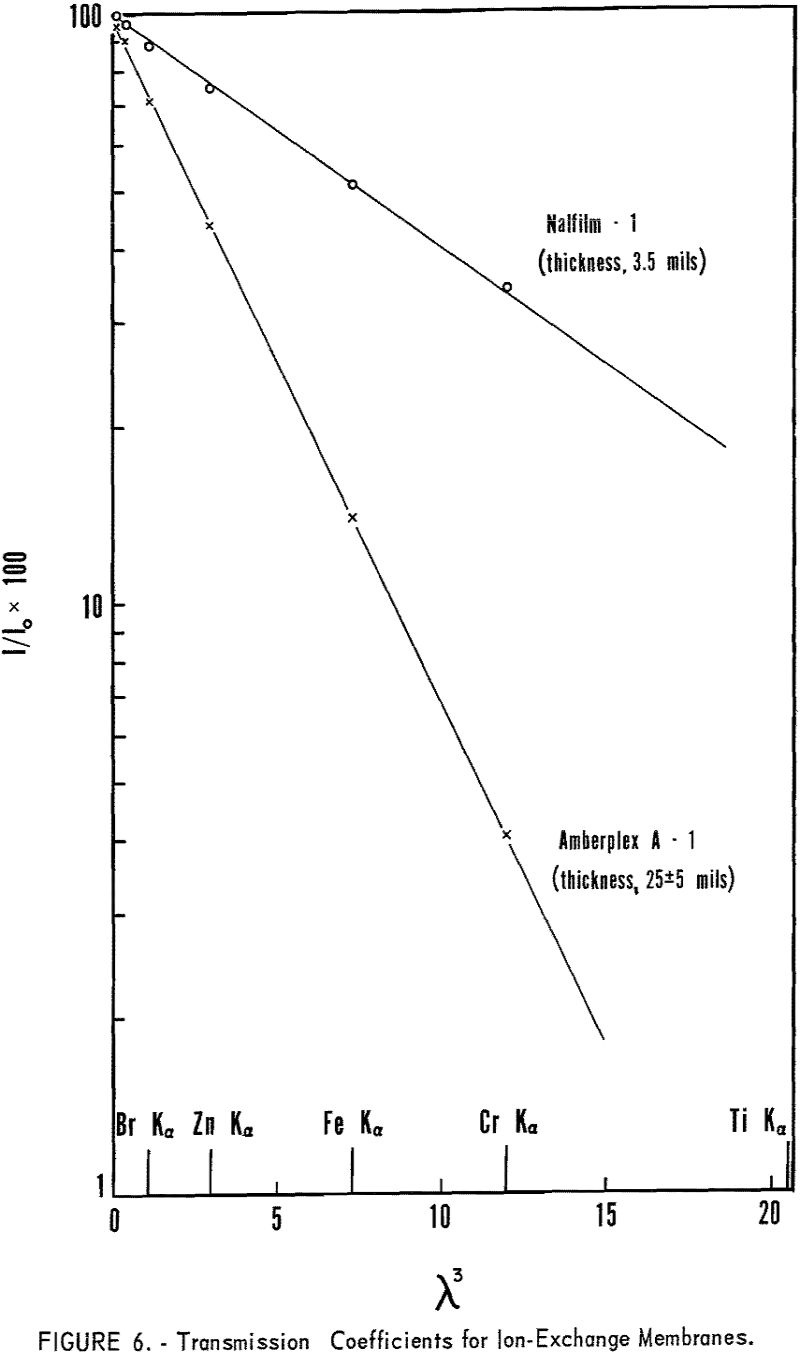
Comparable results are obtained with very thin ion-exchange membranes but ratio of the intensities Kα/Lα increased rapidly with thickness of the absorbing layer. With increasing sample thickness equation 4 is no longer applicable since e -x ≠ 0. Samples such as ion-exchange membranes fall into the intermediate thickness class whereby

As the absorption coefficients of the elements are proportional to λ³, M will increase rapidly with increasing wavelength. Therefore, the longer wavelength radiation is very highly absorbed in thicker ion-exchange membranes. Figure 6 shows the very rapid decrease in transmission with increasing wavelength, using 25-mil Amberplex membranes, whereas the thinner Nalfilm membranes can be used in the long-wavelength region. Thicker membranes have the advantage of greater exchange capacity and greater rigidity in the sample holder but have limited application for radiation longer than 2 A.
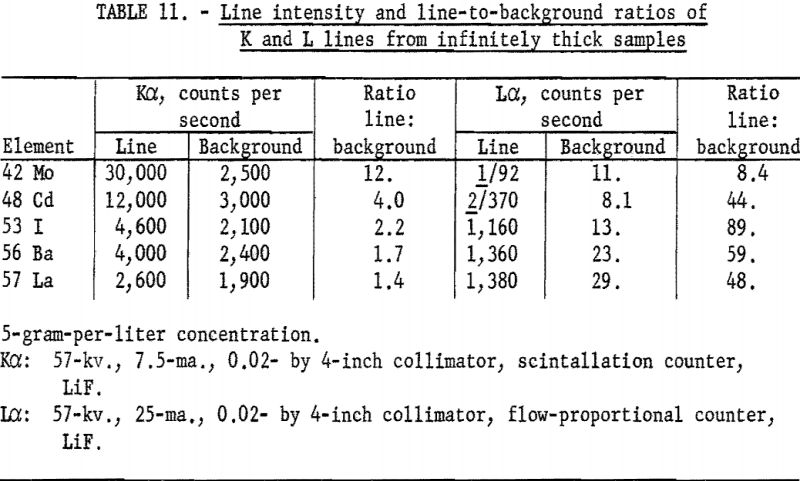
When infinitely thick samples are studied, the much greater depth of sample analyzed with the short-wavelength radiation usually makes the Kα line
intensity many times stronger than the L-series radiation. However, the background also increases rapidly for the K series; thus the line-to-background ratio is not as favorable as the L lines in many instances. Table 11 lists K and L intensity data for certain elements between atomic numbers 42 and 60, using solutions as infinitely thick samples.
Choosing the best analytical line is sometimes very difficult, as illustrated by the determination of tin in a low-grade ore. The data in table 12 indicate that the limits of detectability (based on counting statistics only) are approximately the same for either line, SnKα or SnLα; however, the line-to-background ratio of the Lα line is about a factor of 10 higher than the Kα line. In addition, the background intensity changes rapidly with angular position in the SnKα, whereas the background for SnLα is the same over small angular ranges. Backgrounds cannot be corrected by measurements at either the SnKα or Lα peak positions, as the ores vary in matrix composition (thus affecting the background).

However, it is important to realize that preparation of samples is very critical when long-wavelength radiation is used because of the small depth of sample analyzed. Therefore, if addition or internal standard techniques are employed, the analyst should use the shortest wavelength line practicable.
L and M Intensities From the Same Element
Gold (atomic number 79) and all higher atomic number elements have Mα and Mβ spectral lines with wavelengths less than 6 A. Therefore, some consideration was given to the possibility of using the M series of these elements in preference to the commonly used L series; however, preliminary calculations showed that the Mα or Mβ lines of all elements below uranium (atomic number 92) requires the use of high-spacing crystals, such as EDDT, to satisfy the requirements of Bragg reflection. The low reflectivity of these crystals plus the very small depth of penetration of this longer wavelength radiation greatly limits the analytical applications of M series radiation. The uranium Mβ, line can be used for both microgram deposits and thick samples (see table 13). However, thorium-M-series lines require high-spacing cyrstals with approximately one-fifth the reflectivity of lithium fluoride, thus are not as useful as the uranium-M lines.
Since M-series lines fall in the wavelength range of the K series of elements below atomic number 20 and the L series below elements of atomic number 50, the possibility of spectral interference exists in these regions. Published X-ray spectral tables giving the 2 0 angles for the various analyzing crystals do not include the M series; therefore it is recommended that these lines should be included in any future publications.

