In this video EMC Supasim flotation simulation program is used to simulate the performance of a copper lead zinc plant in southern Spain. Flotation kinetics of key streams are generated by conducting bench scale rate tests on either a laboratory prepared sample of mill feed or grab samples of pulp taken from the plant. And this type of rate test is known as a hot float. A grab sample may or may not be representative and if not, the flotation kinetics it generates will not be a true reflection of the streams floatation characteristics.
- If this happens and you cannot repeat the test, what do you do?
- How to use flotation kinetics to determine what is required to improve plant recovery?
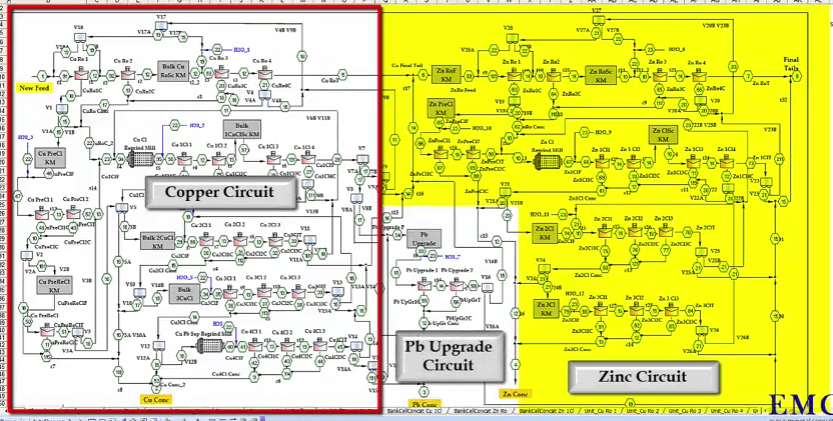 What you see here is a flow sheet for the copper lead zinc plant where you have the copper circuits on your left, the zinc circuit on your right; both have reground mills. It looks very congested that is because it’s got a lot of options. These are valves where you can operate the circuit, in open circuit or in close circuit. And there’s a lead upgrade here. You produce copper concentrate down here. Lead concentrate here and Zinc here. On the third stage of cleaners, you can route that either directly to final concentrate or put that through a reground mill and that concentrate can go to the copper concentrate, the tailings can be rerouted as you can see into a further lead upgrading.
There’s a facility where for instance in these re grind mills; if I click on these at the moment that has a re grind mill program in it but that can be reset so that it becomes effectively a mixer. The control panel is where you have all the banks and you have the number of cells, the volume of cells and the air rate marked as a %. One per cent is the very minimum that you can put into a plant cell and one hundred per cent is the very maximum. And down here you see there’s a set of kinetics that you assign to each bank or each cell and there’s an air rate and water recovery rate relationship. Below you have the mass balance with all the anorlites here, solids tons per hour, pulp volume, water recovery, per cent solids and all of the various streams. What I’ve done to make it easier; I’ve made this into a summary table here so you have the simulation and the plant data. You can see as far as a copper circuit is concerned and the lead concentrate that the simulation produces pretty much what the plant also does. In the zinc circuit up until the rougher concentrates this is also good agreement between the simulation and the plant. However you will find in the zinc final concentrate, you see the plant has a recovery of seventy one point eight per cent at forty eight point three per cent zinc and the simulation is much lower.
Now the problem here is if we go to the kinetics and we go to that zinc cleaner bank; you can see here these other thing cleaners and it’s assigned to kinetic set four. So for go to the kinetics and go along to kinetic set four, you can see that these are the kinetics of the gangue copper zinc lead etc down to pyrite. And as you see on the left you have a fast floating fraction, a fast rate and a slow rate. And these kinetic are from test PZ5A and you can see that the kinetics for the zinc are very low for a zinc cleaner. Thirty four per cent of the zinc is fast floating fraction with a rate of point four, that’s a fast rate and a slow rate of point zero one eight eight. The fast floating fraction of zero point three four means the thirty four per cent of zinc is fast floating and this value is also a stage recovery across the zinc cleaners. This is low; normally one can expect a stage recovery of eighty five to ninety five per cent so this value should properly be at least 0.85.
Our plant data shows that stage recovery is actually 88%. So let’s see where that comes from if I bring on board the actual test of this is PZ5A which is the first cleaner feed in the sink plant and I scroll down and you see that it’s got a head grade of 30%. And if I highlight the cumulative zinc cleaner concentrate, the zinc assay varies from 45 to about 41%. But you can see that the stage recovery across the zinc cleaner in this rate test is only forty seven per cent on a mass pull of thirty four per cent. So what do we do from here? So if we go back to the mass balance, unfortunately from the test what we have is that gave kinetics the low and are not representative of the plant performance across the zinc cleaners. So what we can do is that we can go back to the kinetics knowing that the recovery in the plant is seventy one point eight per cent and we can change these kinetics as to what should they be for the simulation to reproduce what the plant does. Well from experience I know that across a zinc cleaner, the fast floating fraction and I’m just changing it now should be point eight five at eighty five per cent of the sink in the rougher concentrate is well liberated and is easily recoverable. The rate I know should be something like one or one point two five; I’m going to leave the slow rate the same. Having changed that, let’s go to the mass balance and we’ll keep our eyes on these columns here. Let’ set the simulation in motion and let’s see what happens. And you can see the figures change not only in the simulated recovery and grade but also in the mass pull and also in the zinc first, second and third cleaner concentrates. So we see what that does and you can see having changed those kinetics now that the simulation gives pretty much what the plant does. Now what also needs to be borne in mind is not only to the zinc kinetics change to actually what they should be but also if you look at the mass pulls in the plant, the zinc rougher concentrate is about 16.6% mass and the final concentrate is 88% mass roughly.
So that means the stage recovery from the zinc rougher concentrate mass to zinc final concentrate mass is about 50%. That means that the fast loading fraction of gangue should also be in the region of point five because again that is a stage recovery. If we go back to the kinetics and you see from this test that the fast floating fraction of gangue is point one six in other words sixteen per cent of the gangue is fast floating and that is a stage recovery from rougher concentrate in this particular rate test to first cleaner concentrate. That needs to be changed to something like zero point five six and we can leave the fast floating rate of gangue the same and change the slow floating rate to point zero zero five. Again let’s go back to the simulation and see what that produces. You will notice that there’s not much change to the zinc recovery because we’re not changing the zinc kinetics but you can see from the mass pull and from the grade that that is changed and that is being reduced because I’ve increased the gangue kinetics. So now that has completed the simulation and you can see from the mass pull that the simulation is close to what the plant produces services in recovery.
Now you notice in terms of copper which are in these columns but that is not a very good agreement between simulation and copper that is because I haven’t changed the kinetics of the copper in this poor rate test. What this exercise is shown is that although the original rate test gave poor results and therefore poor kinetics were not representative of the plant; you can change the kinetics and define what they are so that the simulation represents the plant. Now this is a useful exercise because what you can do is if you want to increase the recovery or grade in your plant you can change the kinetics and determine what the kinetic values must be so that you get either one or two per cent recovery extra in your plant. How do you go about defining what kinetics are required to achieve an increase in recovery an ore concentrate grade? There are two ways to do this; firstly do tests and from the kinetics determine if floatation behaviour has improved or secondly change the kinetics and use the simulation program to determine when the required improvement has been achieved, then put this new set of kinetics into a Scrollcalc and reproduce the equivalent laboratory scale test.
This set of recovery time and recovery grade curves becomes a target and if they can be matched then you know that the improved simulated plant recovery and grade can be achieved. Regrinding copper and zinc rougher concentrate in the copper zinc flotation plant is an example of the first method. The graph shows rate tests performed on copper rougher concentrate as-is and after regrinding and the same for zinc rougher concentrate. In both cases there is an improvement in grade for the same recovery, although not shown here, there were also improvements in Zinc and Iron rejection in the copper rougher concentrate and iron rejection in this zinc rougher concentrated. 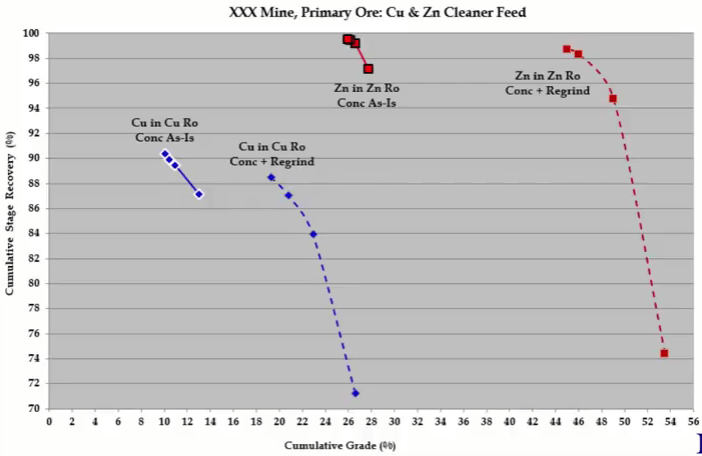 The best way to see what is going on is to analyze a floatation kinetics. Here are the kinetics of copper rougher concentrate floated as-is and after regrinding and you have the same below for zinc rougher concentrate as-is and after regrinding. For copper, regrinding reduces copper froth fraction and rate genetics and those of zinc and iron. Copper selectivity against gangue is improved slightly but the big improvements are between copper and zinc and copper and iron. So regrinding is achieving what it should do and that is to liberate chalcopyrite from sphalerite and pyrites. In the zinc regrind, the aim is to liberate sphalerite from pyrite and not so much to improve selectivity between sphalerite and gangue and the kinetics show that this is being done. Gangue kinetics decreases a little but do not change zinc selectivity relative to floatable gangue. The real improvement is seen in zinc iron selectivity which indicates that sphalerite is being liberated from pyrite. If mineral selectivity is shown, it is clear that regrinding in the copper circuit improves the liberation between chalcopyrites and pyrite and chalcopyrite and sphalerite. And regrinding in the zinc circuit improves the liberation between sphalerite and pyrite. The second way is more unusual and this will be described in more detail.
The next thing I’m going to bring into the screen is scrollcalc. So what I have here is that I have a little program that compares two sets of tests. One as you see here is the zinc cleaner rate test as-is and this is the estimates which is the kinetics that I put into the simulation so that it reproduces what the plant performance is. Here is zinc and the head grade is twenty eight per cent. The kinetics goes into the Kelsall equation; fast fraction here, fast rate here and slow rate here and the slow floating fraction is merely one minus a fast floating fraction; this gives recovery for values of time. Blue lines traced the original lab hot flow rate tests conducted on a grab sample from the plant and the yellow lines are derived from the kinetics that defines actual plant performance across the zinc cleaners. What you saw before in the kinetic sets in supasim that were changed to reflect actual plant performance are laboratory kinetics. So the yellow lines you see here are the result of a laboratory scale rate test and is the laboratory equivalent of plant performance. In other words if you achieve this result in the laboratory generating these kinetics then the zinc recovery in the plant would be seventy one point eight per cent at forty nine per cent zinc grade as we have seen in the plant mass balance.
To confirm that these calculated results are representative, the recovery grade curve which is almost vertical ranging from about forty two to forty eight per cent zinc corresponds to the actual test rate highlighted here and you can see that these values range from about forty two to forty five or forty six per cent zinc. So now to continue this exercise, if I then take this away and we say to ourselves right we’ve got a plant recovery of seventy one point eight per cent, what do I have to do in order to increase that zinc recovery by let’s say one or one and a half per cent? Assume for the test work involving say a final regrind and a more selective reagent suite has optimized the zinc regrind step and that zinc kinetics have been improved from a fast fraction of zero point eight five to zero point eight eight, a fast rate of one point two five to one point five and a slow rate of zero point zero one eight eight to zero point zero two five. Then go back to kinetic set four and change the zinc kinetics to these new values. Remember that these are laboratory kinetics which in the supasim program are multiplied by a series of laboratory to plant scale-up factors in order to simulate plant performance.
Having done this we go back to the plant mass balance and simulate these changes, the product of this is that recovery has increased by two point three per cent from seventy two point nine per cent to seventy five point two per cent. Know that mass pull and concentrate grade have not changed because we didn’t change the gangue kinetics. We have three sets of laboratory scale kinetics which describe flotation performance across the zinc cleaners. The first are kinetics from the normal representative grab sample which are not a true reflection of cleaner feed flotation characteristics. The second are kinetics which do represent the flotation behaviour in the plant which were derived by simulation and the third set of kinetics describe a flotation performance we would like to achieve. And from simulation, we know this gives an extra two point three per cent recovery. 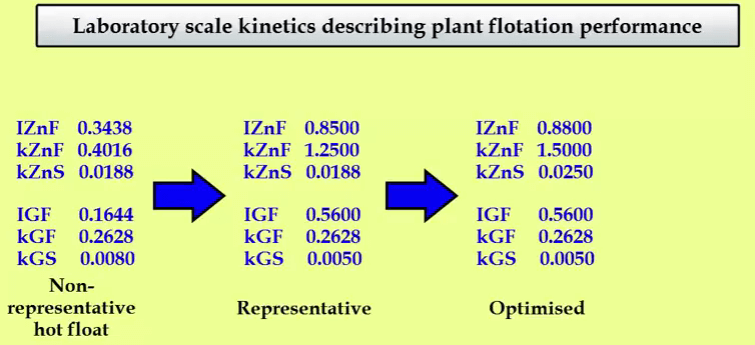 These sets of kinetics becomes a test work target and may describe a set of recovery time and recovery grade curves that are to be achieved by optimizing test conditions. To find out what these laboratory scale curves look like relative to the kinetics that are representative of current plant performance, we need to go back to the scrollcalc method. Test float sample kinetics are at the top here and are shown by the blue lines. Kinetics representative of current flotation performance in the plant are down here and shown by yellow lines. What I’m going to do is to change the original hot float kinetics into the optimized set so that we can compare them and get a visual idea of what the magnitude of improvement is that we need to achieve in the laboratory. So the zinc goes up to point eight eight as I put in the plant, roughly the fast floating rate to one point five and you can see what happens. This is quite a bit of fun actually when you start doing this. Let’s bring that up to roughly one point five, there we are and the slow floating rate was point two five. So I will just use a little slider and put that up there. Obviously you see down here on the cumulative recovery concentrate grades; you can’t have a zinc concentrate grade of about three hundred fifty per cent because practically we’ve left the kinetics of the original rate test of the gangue very low. So those have to go back up to what the plant is which is roughly point six.
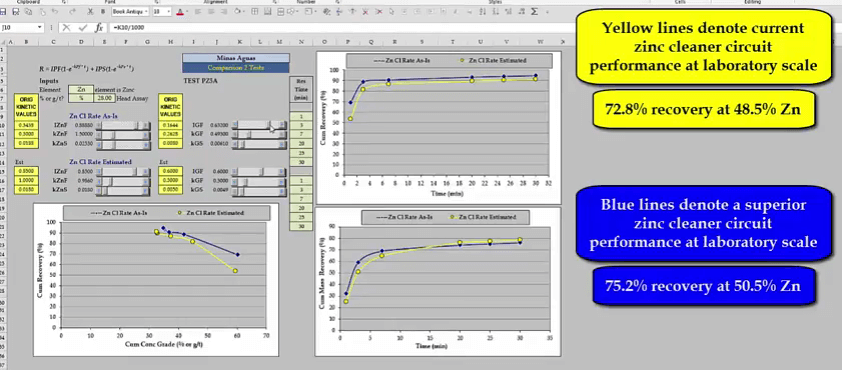
Just going to quickly move it to roughly what these figures are and point three, move it little bit back and point zero zero four nine and I can’t see the plant and I’m just going to put it back to practical figures because either the rate or something would have also increased. So something like that, you will notice that some of the kinetic values are different to the ones quoted previously, don’t worry about this because I’m using rough file used to illustrate the principles involved. To recap, the yellow lines describe a laboratory scale test representative of current zinc cleaner plant performance. Giving a recovery of seventy two point eight per cent at forty eight point five per cent zinc grade. 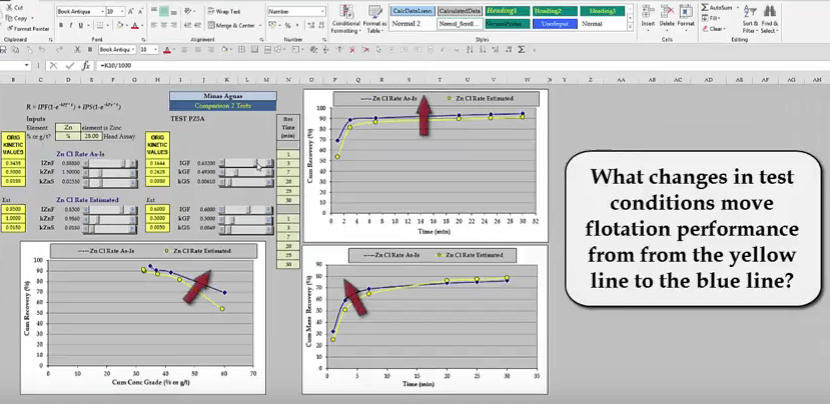 The blue lines describe superior flotation performance and by simulation we have seen that this increases in recovery by two point three per cent to seventy five point two per cent. The task now is to determine what tests conditions need to be changed so as grind reagents or pH etc. In order to achieve these results, the improvement in zinc recovery time and recovery grade curves may seem small but the effect on the plant is large.
https://www.youtube.com/watch?v=Pv_1Qu2pvZI
