Table of Contents
One aim of metallurgy research within the Federal Bureau of Mines is the advancing of metals and minerals processing technology to foster the overall goal of maintaining an adequate supply of minerals and metals to meet national economic and strategic needs. This report describes part of a research effort aimed at increasing the utilization of electrowon copper to augment copper supplies derived from conventional electrorefining processing. Electrowon copper is generally characterized by a different level of trace element impurities than electrorefined copper, which inhibits its acceptance for processing to certain important fabricated products.
Increasingly larger tonnages of copper are being produced by electrowinning because of technical advances such as the solvent extraction processes using, for example, the LIX reagents and because of increasingly stringent air pollution restraints on more conventional processing. However, electrowon copper is generally not used in some important industrial applications, such as wiredrawing, because of its relatively high impurity content in comparison with electrorefined copper. Lead, originating at least in part from use of lead alloy anodes in electrowinning, is characteristically higher in electrowon copper. Other trace impurities present in variable amounts include Sb, Bi, S, Fe, Se, Te, Ag, and O.
The importance of wire products is emphasized by the fact that wire mills are the primary consumer of refined copper. In 1973, wire mills consumed 1.6 million short tons out of the total 2.4 million tons of U.S. consumption. Over half of this copper goes into communications and magnet wire, which require the highest quality cathode copper owing to the fine gages and conductivity requirements. ASTM Standard B115 specifies that the copper purity shall be a minimum of 99.90 pct, including silver as copper, and that the resistivity shall be at least 100 pct IACS (International Annealed Copper Standard).
Wire breakage during drawing of the finer sizes of wire presents a problem even under the best conditions, and problems become critical when magnet wire is drawn to sizes as small as No. 40 AWG (American Wire Gage), which is 0.0031-inch diameter. Normally, about 40 pounds of this size wire is wound onto a reel in one continuous strand; this is equivalent to some 250 miles of wire. Continuous systems of melting (nonrefining furnace), wheel casting, and fabrication are gaining in prominence because the uniformity of material can be controlled more easily.
For electrowon copper to be effectively utilized, research is needed to determine the sources of impurities in electrowon copper, their effects on fabricability, and methods for their control to tolerable levels.
To move toward these ultimate goals, a cooperative effort was initiated between the Bureau of Mines and Essex Group, Inc., of Ft. Wayne, Ind. The main Bureau laboratories involved were the Metallurgy Research Centers (MRC’s) at Salt Lake City, Utah, and Rolla, Mo. Essex was to supply nonproprietary information relating to commercial processing of electrorefined copper to wire products and to conduct trials at similar process steps with electrowon copper insofar as possible. Processing to wire includes melting of cathodes, casting to bar form, and hot fabrication to rod stock for feed to the final wiredrawing operations. Samples of selected cathodes, continuous castings, and fabricated rod were supplied by the Mining and Metallurgy Division of Essex Group to the Bureau for analysis. The electrowon copper comprised 100- ton lots from a Peruvian source and from Bagdad Copper Corp.;6 the electrorefined copper was produced by Kennecott Copper Corp.
Salt Lake City MRC initiated research to identify sources of lead and other impurities in electrowon copper and to determine effects of the emerging practice of adding cobalt to electrowinning cells as a purification step. It also participated in a round-robin analysis of samples of the electrowon and electrorefined copper. The round-robin analysis was coordinated by Rolla MRC, and the results are part of this report; Rolla and other Bureau research centers, Essex Group, and Kennecott Copper Corp. also took part in the round-robin analysis. The purposes of the round-robin analysis were to make an accurate analysis of trace impurities in selected electrowon and electrorefined copper products and to point out those elements for which analytical procedures produce uncertain results.
Rolla MRC was also to devise a test that would correlate hot fabricability of copper with various purity levels. The original intention was to concentrate on wire products, but efforts were redirected toward evaluation of bulk copper at earlier process stages after problems arose in the casting and initial bar rolling during trial processing of the Peruvian electrowon copper. Lead was selected as the main impurity element for evaluation, because of its prevalence in electrowon copper and the uncertainties surrounding its effects on fabricability of copper. Oxygen was purposely varied in some laboratory- melted materials.
It was recognized that high-speed mechanical tests might correlate better with workability under actual forming conditions than conventional tension tests. Charpy impact data for commercial coppers (OFHC, phosphorized OFHC, and ETP) were available over the temperature range of 20° to 700° C. However, such data do not yield ductility values. Furthermore, it was believed that longitudinal rather than transverse deformations would more closely duplicate the critical stresses generated during rolling or drawing operations.
Various tension, impact tests of copper and copper alloys have been reported. Parker and Ferguson give impact energies, elongation, and reductions of area for OFHC and ETP copper at room temperature. Using more sophisticated equipment, Nadai and Manjoine generated stress-strain relationships for copper (“commercial pure”) over a range of strain rates from 10 -6 to 10³ sec-¹ at temperatures from 21° to 1,000° C. Leech, Gregory, and Eborall tested some copper alloys on a simpler, modified Charpy impact tester. They were able to obtain fair correlations between visible edge cracking during rolling and the reduction of area of impacted Cu-8 pct Sn specimens over the range 600° to 800° C.
For this study, the test method of Leech was chosen as being the most straightforward approach to tension-impact testing of the copper specimens. Lead, the impurity of primary interest, was added to cover the range up to about 300 ppm. The specimen materials as-cast, equiaxed fine-grained and columnar coarse-grained, and hot-rolled were also analyzed for oxygen and sulfur. The impact tests were conducted at room temperature and at elevated temperatures to 871° C (1,600° F). The impact properties are correlated insofar as possible with the lead content, test temperature, grain structure, and other factors.
Acknowledgments
For their contributions to the round-robin chemical analyses, acknowledgment is made to Mike Gonshor, Essex Group, Inc., Ft. Wayne, Ind., and W. Marvin Tuddenham and A. P. Laughindridge, Kennecott Research Center, Salt Lake City, Utah. Thanks also are due to analytical services personnel of the Bureau’s Metallurgy Research Centers at Albany, Oreg., College Park, Md., Rolla, Mo., and Salt Lake City, Utah, for their substantial contributions to this effort.
Experimental Procedure
Round-Robin Chemical Analysis
Material Source and Description
Round-robin analyses were conducted on 11 samples of copper by 6 cooperating analytical laboratories. Samples 1 through 3 were taken from small lots of material (<150 pounds each) and analyzed in triplicate by three laboratories. Sample 1 was millings taken from continuous-cast bar made from Peruvian electrowon copper. Sample 2 was millings from continuous-cast bar made from electrorefined copper from Kennecott Copper Co. Sample 3 consisted of drillings taken from a cathode of Peruvian electrowon copper drilled on the diagonals as specified by ASTM Standard B115. The remaining samples (4 through 11) were obtained from two large lots of material (~160,000 pounds). Samples 4 through 8 were diagonal drillings of five random electrowon cathode sheets produced by Bagdad Copper Corp. Samples 9 through 11 were milled from continuous cast and rolled rod (3/8-inch-diameter) obtained from melting the Bagdad electrowon cathode lot. These three samples were taken from different 40,000-pound loads of rod at the beginning, in the middle, and near the end of the Bagdad lot. Fifteen common impurity elements were analyzed, as follows: O, S, Bis Pb, Sb, As, Fe, Ni, Ag, Te, Sn, Se, Cd, Co, and Zn.
The three initial round-robin samples for analyses each contained 600 grams of material from which 150-gram lots were split out and sent to each of the three participating laboratories. For sample groups 4 through 8 and 9 through 11, three additional laboratories were enlisted to bring the total to six. Each of these laboratories received 50-gram samples for analysis; several ran two sets of samples. The analyses for the last two groups of samples were conducted, as nearly as possible, according to guidelines set forth in ASTM Standard E173 for conducting inter laboratory studies of methods for chemical analysis of metals. Appropriate analytical report forms and brief instructions were provided to each participating laboratory. The instructions include the following items, consistent with ASTM Standard E173:
- Samples were to be cleaned in 1:1 distilled water plus reagent-grade nitric acid and rinsed in distilled water and alcohol and dried.
- Each laboratory was to have a single analyst analyze each sample (X and Y) on separate days with the same apparatus.
- Some laboratories would be asked to run two sets of duplicate analyses.
- Sample size was to be a minimum of 50 grams. Consistent with available standards, participating laboratories were to analyze by emission spectrograph for Sb, As, Bi, Fe, Pb, Ni, Ag, Te, and Sn.
- The analyses for X and Y samples in ppm, analytical methods, and standards used were to be reported on the forms provided.
The minimum requirement for using this ASTM statistical method is stated as five laboratories and eight pairs of values. Three of the participating laboratories ran duplicate pairs of analyses. Unfortunately, all of the laboratories did not have the capability or standards required to analyze for all 15 elements. Therefore, valid statistical numerical treatment of the data could be performed only for analyses of elements Bi, Pb, Sb, As, Ni, Ag, Te, and Sn on samples 4 through 8.
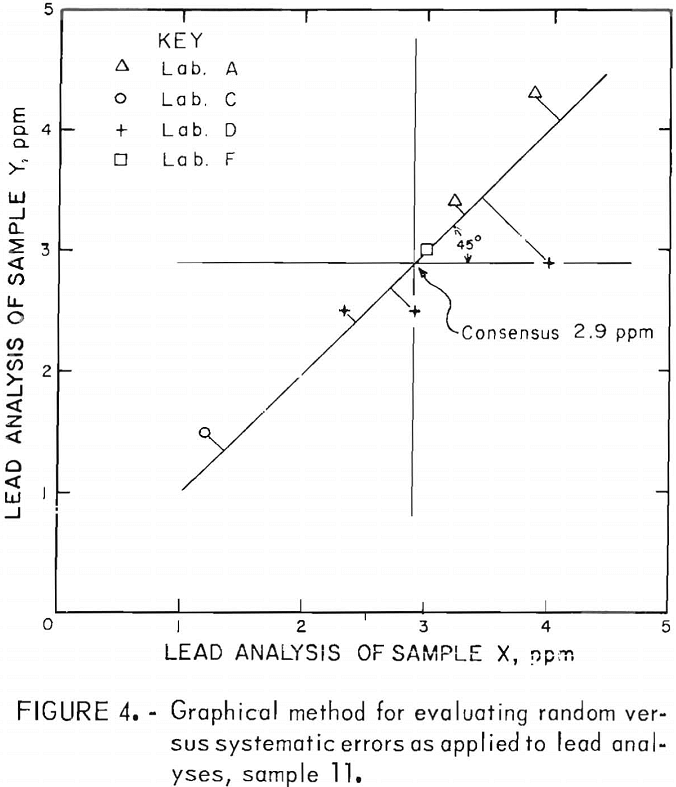
Two other methods were also used to evaluate the analytical results: (1) the average and standard deviation, and (2) a graphical method, proposed by W. J. Youden, for assessing systematic errors versus random errors. The graphical method was applied only to the analyses of elements O, S, Pb, and Fe for each of the 11 samples.
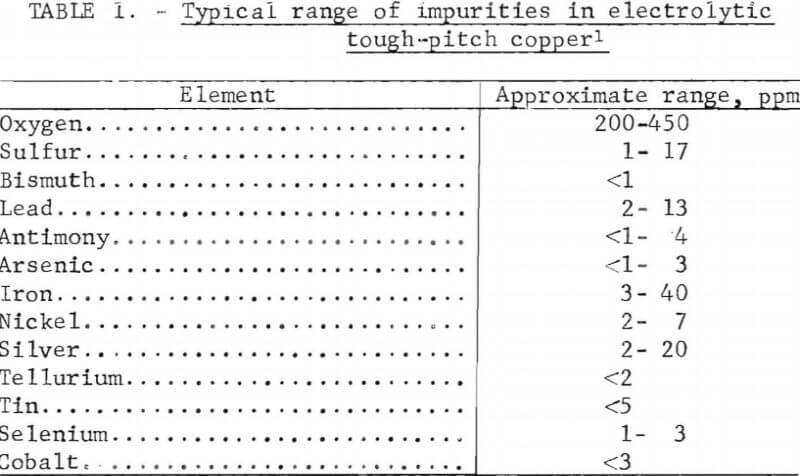
A typical range of impurities found in electrolytic tough-pitch copper is shown in table 1. Extensive research on the effects of impurities on copper has been conducted in the past. The report of the joint ASTM B01/B02 Task Group on the annealability testing of copper gives an indepth study of previous research and includes a comprehensive chronological bibliography from 1941 to 1971. However, as might be anticipated, numerous contradictory research findings were reported.
Analytical Procedures
Samples for chemical analysis were milled from castings and hot-rolled rod, or drilled from diagonally sectioned cathode strips. Solid samples were taken from rods 9, 10, and 11 for one set of oxygen analyses by neutron activation; these samples were analyzed at the Reno MRC, but were reported with the results of the Salt Lake City MRC.
Analyses for oxygen were performed at Rolla MRC using a Leco conductometric oxygen analyzer with oscillographic readout on samples containing less than 400 ppm oxygen. A gravimetric method was used on samples containing oxygen in excess of 400 ppm. Three other laboratories (Albany MRC, Essex, and Kennecott) also used Leco oxygen analyzers. Sulfur analyses were determined at the Rolla laboratory with a Leco sulfur analyzer with automatic sulfur titrator. Four other laboratories also used Leco sulfur analyzers. The elements Bi, Pb, Sb, As, Fe, Ni, Ag, Te, and Sn were determined by Bureau laboratories, at Rolla and College Park, and at the Essex and Kennecott laboratories using the emission-spectrograph, globule-arc method with suitable reference standards. Two laboratories used atomic absorption methods to determine these nine elements. Selenium was determined by atomic absorption equipment by three laboratories and by X-ray fluorescence analysis at a fourth laboratory. The last three elements, Cd, Co, and Zn, were determined by three laboratories using atomic absorption methods.
Spectrographic copper reference standards from four sources were used at Rolla and several other laboratories in order to provide quantitative analyses. These standards had been obtained from the Spectroscopy Society of Canada, Kennecott Copper Corp. (K-series), American Metal Climax (Anaconda refined copper standard AA-1), and Bundesanstalt Fur Material-prufung (BAM) (four German standards).
Lead-Doped Copper
Material Preparation
Melting and Casting
Castings for preparation of specimens for evaluation of hot workability were prepared at Rolla MRC from the OFHC wirebar copper, the electrorefined continuous-cast copper, and the electrowon continuous-cast stock previously described. The lead was added to the melts in the form of a pressed compact consisting of specific amounts of corroding-grade lead (99.99 pct pure) mixed with up to 30 grams of copper powder (99.3 pct pure).
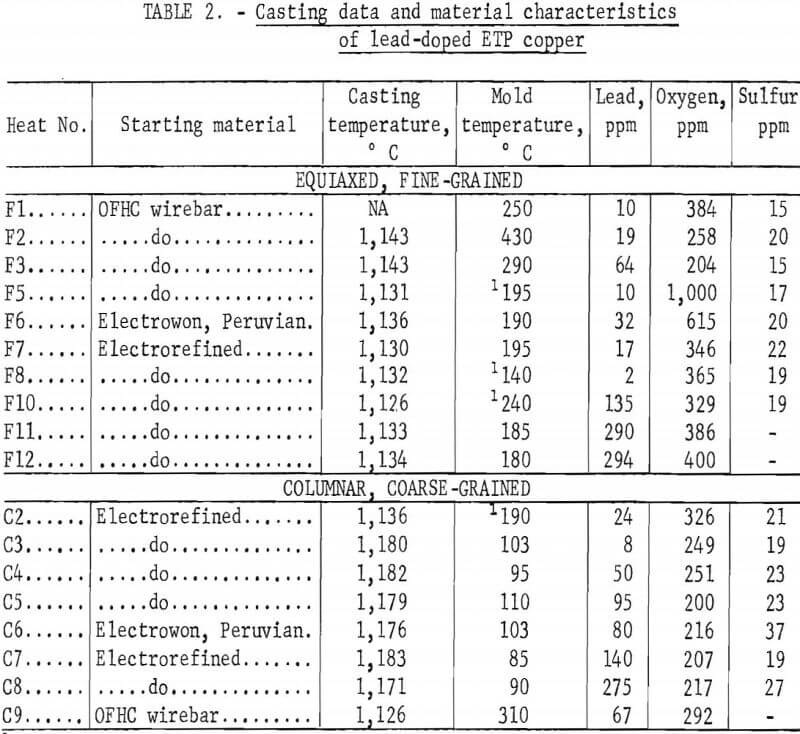
The heats were induction-melted in air in furnaces of 30- or 50-pound capacity. The charges were held under charcoal during the heating and melting. Lead additions were made after the melts had reached the desired casting temperature. Following these additions, the melts were stirred to insure homogenization. The heats and casting temperatures are included in table 2; the F and C prefixes with the heat numbers refer to the fine- or coarse-grained material, respectively.
The oxygen level of the melts was controlled to an extent by skimming off the charcoal and holding for various periods at the casting temperature. Normally, 5 min at 1,135° C and <30 sec at 1,175° C yielded an oxygen range of 200 to 500 ppm.
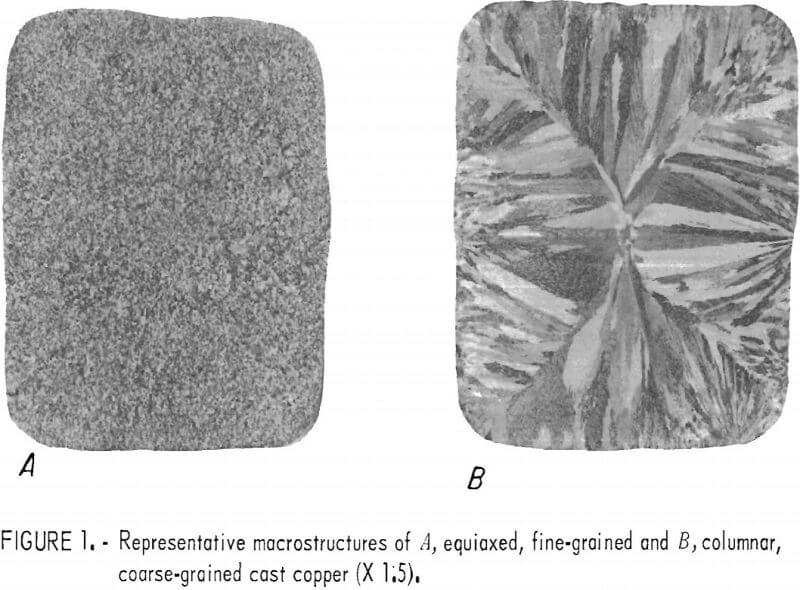
The molten copper was cast into vertical carbon molds (split-type) coated with bone ash. Molds were preheated to temperatures ranging from 85° to 430° C in an attempt to control grain structure and size; however, no correlation between temperature and structure was observed. The mold temperatures listed in table 2 were measured with a thermocouple probe just before casting. In some cases, the preheated molds were water-cooled immediately before casting. The temperature of the melts were measured with platinum-13 pct rhodium versus platinum thermocouples encased in protection tubes and inserted into the melts. The casting temperatures were nominally in two ranges: 1,125° to 1,145° C, and 1,175° to 1,185° C. These ranges produced, respectively, equi-axed, fine-grained (FG) and columnar, coarse-grained (CG) structures. Specific melting and casting information is included in table 2. Ingots approximately 1.75 inches square by 10 inches high were produced. Representative macrostructures appear in figure 1.
Hot Rolling
Sections of four ingots were reduced 60 pct in cross section by longitudinal rolling at 870° C (furnace temperature) through incremental reductions of 20, 20, 20, and 16 pct in thickness. Billets were reheated prior to each reduction. Optical pyrometer measurements of slabs exiting the rolls indicated surface temperature drops of 20° to 40° C. No edge cracking was observed in any of the rolled sections.
Material Characterization
Chemical Analysis
Castings from the heats were analyzed for lead, oxygen, and sulfur contents. The analytical procedures were essentially the same as described for the round-robin analysis. Results of the analyses of the ingots are included in table 2. The somewhat higher lead content (8 ppm) of heat C3 (no lead added) in comparison with heat F8 (2 ppm Pb) made from the same material is attributed to some carryover of lead in the crucible from a previous heat. The materials that were hot-rolled were reanalyzed for oxygen and sulfur after rolling; these analyses are listed in table 3.

Metallography
Photomacrographs (fig. 1) were made of each ingot cross section for a face cut 1.5 inch from the butt end. Where a second macrograph was made 8.5 inches from the ingot butt, little or no variation in structure relative to the first section was observed. The sections for photomacrographs were polished through 1-µm diamond abrasive and etched in a 50-pct HNO3 aqueous solution. Photomicrographs were made from selected areas within these faces. For the hot-rolled slabs, photomicrographs of the central sections were made for both the transverse and the longitudinal orientations (perpendicular to slab surface).
Specimens for microstructural examination were, polished through a 0.25-µm diamond abrasive and dip-etched in a solution of CrO3 (4 grams), NH4Cl (0.75 gram), HNO3 (5 ml), H2SO4 (5 ml), and water (90 ml), or electroetched in 10-pct CrO3 solution or in a solution of CrO3 (25 grams), glacial acetic acid (133 ml), and water (7 ml).
Grain and dendrite sizes were measured according to a linear-intercept technique similar to that described in ASTM E112. In some instances, fewer than 50 intercepts were measured; dendrite sizes were measured parallel to their axes. Porosities were determined quantitatively from water-immersion, mass-density measurements.
Lead, oxygen, and sulfur distributions were investigated with an electron microprobe, which yielded qualitative and semiquantitative results. The scanning electron microscope (SEM) was employed to examine untreated fracture
surfaces following impact testing.
Impact Testing
Tension-impact specimens (fig. 2) were machined from the central 7 inches of the cast ingots; the configuration was similar to that derived by Leech. Orientations were longitudinal (L) to the ingot axis. Specimens of the columnar material were further identified according to whether the gage section contained the boundary between nominally orthogonal grains (L1) or only parallel grains (L2). These orientations are outlined in figure 2. Impact specimens were cut from the hot-rolled slabs so that the long dimension was parallel to the rolling direction.
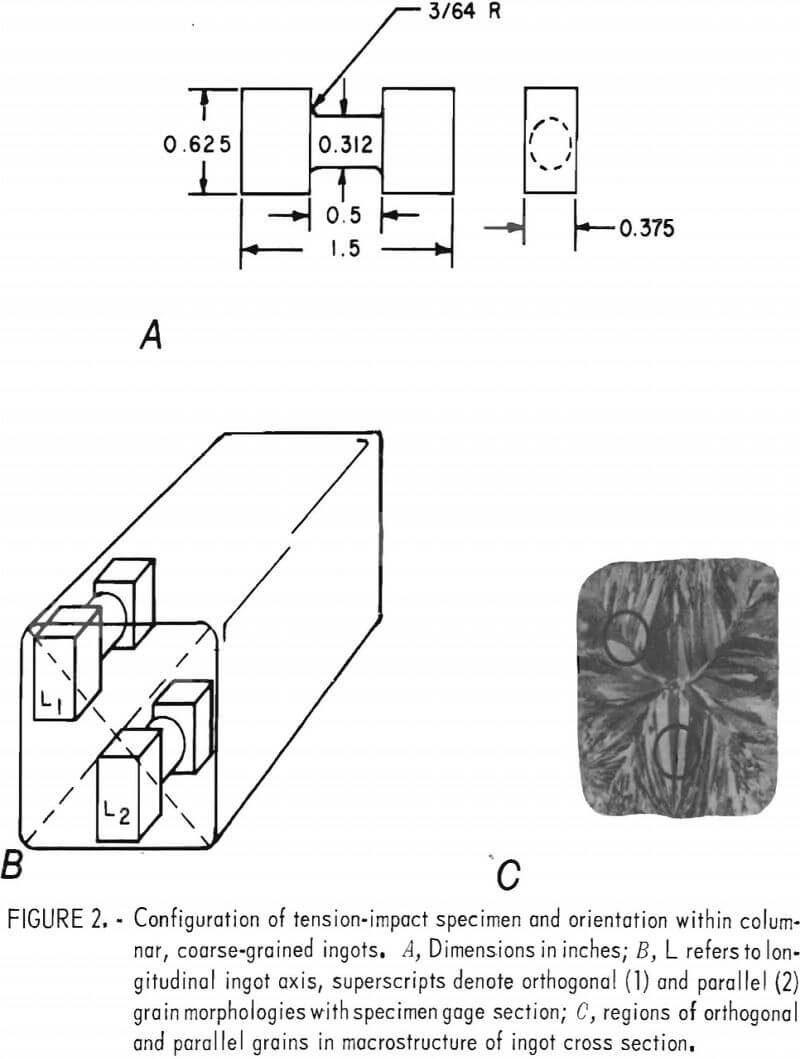
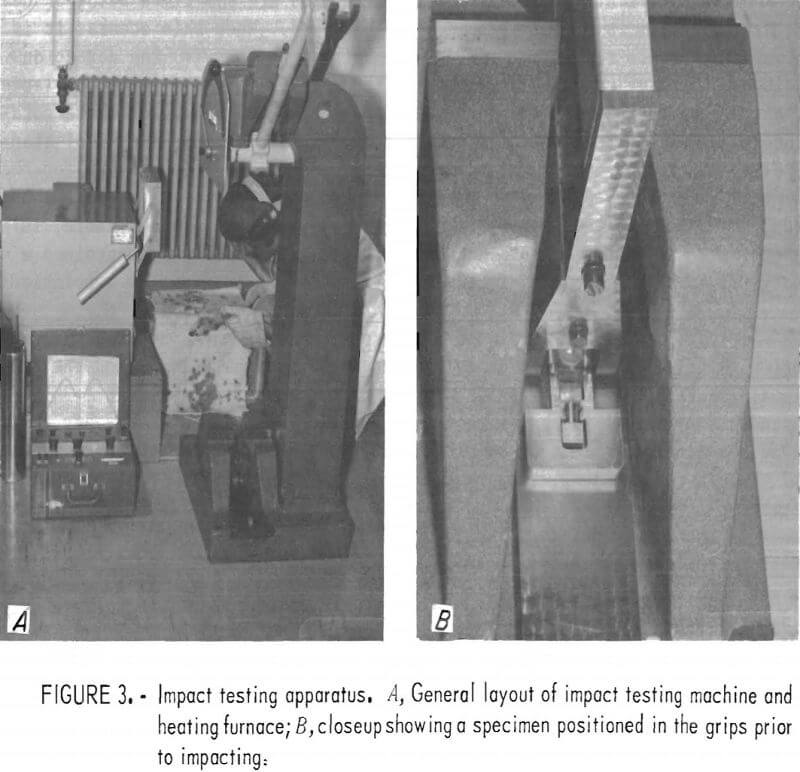
Tension-impact tests were performed on a modified, commercially available impact machine. The striker plate, base plate, and specimen grips were patterned after the design of Leech. The striker assembly and specimen grips are shown in figure 3B. Momentum is transferred from the forked plate on the striker head through a movable grip to the specimen. Counterweights were added to balance the pendulum.
Two corrections were made to the measured energy-transfer values. For the first correction, the kinetic energy imparted to the movable grip and fractured specimen half was subtracted. A constant value of 8.6 ft-lb was determined for this correction by taking the average of several impacts on the grip holding fractured half specimens. For the second correction, the net energy values were multiplied by 1.14 to correct for the additional mass of the striker head and counterweights. No correction was made for possible energy loss due to noncentered impacts, which was considered a relatively minor factor.
For elevated-temperature impact tests, specimens were heated in a muffle furnace situated adjacent to the impacting machine (fig. 3A). Furnace temperatures were monitored using a Chromel versus Alumel thermocouple placed about 0.25 inch from the specimen. Normally, two specimens were heated simultaneously. A typical sequence involved removal of one specimen for testing, transfer of the second to the position previously occupied by the first, and
insertion of a third specimen. In this manner, each specimen experienced approximately the same thermal history for a given impact temperature. Specimens were normally in the furnace approximately 30 min prior to impacting.
When removed from the furnace for testing, the specimens underwent substantial cooling. Corrections were made based on cooling rates established with a thermocouple implanted inside a dummy specimen. Temperature drops of 40° to 70° C were experienced, depending on starting temperature and transfer interval between the furnace and impacting machine. Correction was not made for heating of the specimen resulting from dissipation of the impact energy.
Strain rates, estimated from the impact energy and elongation values, ranged from 290 to 340 sec-¹ for the cast material, and from 250 to 280 sec-¹ for the hot-rolled material.
Gage lengths and cross sections of the specimens were measured with a traveling-stage microscope. Impact energy, elongation, and reduction in area values were determined.
Results
Round-Robin Chemical Analysis
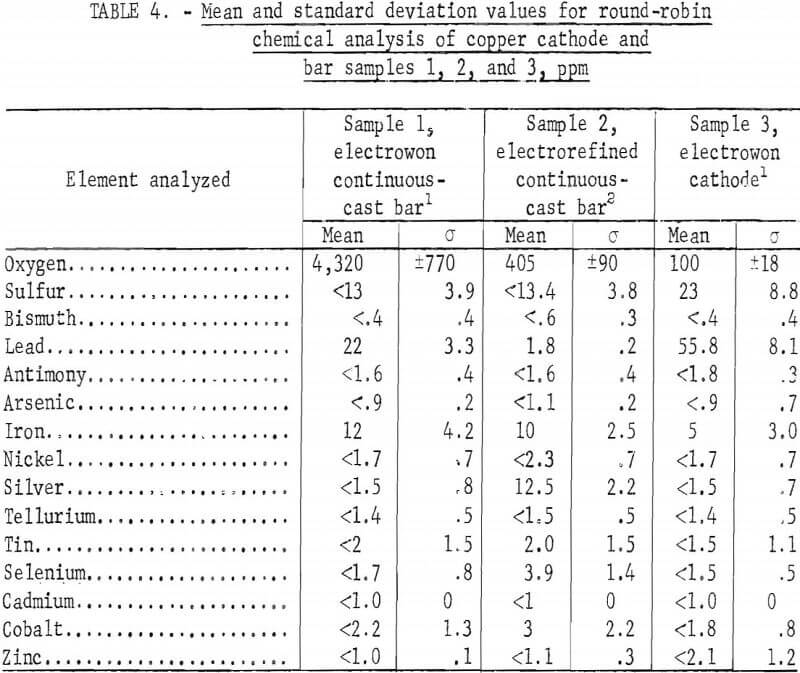
The analyses of minor and trace impurities in copper in the low-ppm range are somewhat difficult since the required analyses are sometimes below or near the detection limits of the element being analyzed. When this occurs, it is common practice to report the analysis as being less than (<) the detection limit or of the value of the lowest standard available. As a result, a large number of the analyses obtained in the round robin were reported in the notation <. As all of the participating laboratories did not use identical standards and analyzing equipment, the reported detection or lower limits for the elements were different in most cases for each laboratory. In tabulating the data, the lower limit as set by each laboratory was used, if applicable, in determining the mean and the standard deviation. If one result contained a < analysis, then the mean that included this result was prefixed by a notation <.
Analyses of samples 1, 2, and 3 were performed by three separate laboratories in triplicate. The average results are shown in table 4, and the individual laboratory average results are shown in tables A-1, A-2, and A-3 in appendix A. Table 4 indicates that the following impurity elements are at or below the detection limit on samples 1, 2, and 3: Bi, Sb, As, Ni, Te, Cd, and Zn. Except for sample 2, these additional impurities were also at or near the detection limit: Ag, Sn, Se, and Co. The only significant impurity differences in the continuous-cast sample 1 (Peruvian electrowon) and sample 2 (Kennecott electrorefined), other than oxygen, appear to be lead and silver. Oxygen is controlled during the melting in a vertical furnace by adjusting the flame to permit greater or less oxygen absorption in the melt. Although the selenium is slightly higher in the electrorefined material, this does not appear to be significant because the analysis was no more than one standard deviation greater. The comparison of analyses of sample 3 with sample 1 cannot be of great consequence since these analyses are based on one cathode sample and a rather small sample of continuous-cast material. Here, the general trend indicates that during melting and casting, a small decrease occurred in sulfur and lead and a slight increase occurred in iron impurities.
The large lot of electrowon cathodes from the Bagdad Copper Corp. was sampled by selecting one cathode from each 5,000-pound stack, then cutting diagonal strips from cathodes selected from stacks 5, 9, 21, 25, and 29 for taking sample drillings. These drilling samples were round-robin samples 4, 5, 6, 7, and 8, which were analyzed by five laboratories with a total of eight sets of duplicate analyses performed. The mean and standard deviations are shown in table 5, and the analyses for each sample in appendix A, tables A-4 through A-8.
The results indicate that all 15 elements analyzed, except for oxygen and sulfur, were in the 1- to 4-ppm range. The numerical method for analyzing the data was applied to samples 4 through 8 for Bi, Pb, Sb, As, Ni, Ag, Te, and Sn. This method indicates the repeatability and reproducibility.
Repeatability is a quantitative measure of the variability of an individual analyst using a given apparatus and is defined as the greatest difference between two independent results that is to be expected due to random errors on the basis of the 95-pct confidence level. Reproducibility is a quantitative measure of the variability between different analysts and equipment in different laboratories. It is defined as the greatest difference between results obtained in different laboratories due to random errors on the basis of the 95-pct confidence level. In general, the repeatability was less than the standard deviation, but the reproducibility was greater than the standard deviation. This would indicate, as expected, that good agreement was obtained within a single laboratory for analysis of a specific sample for a given element, but that analyses by several laboratories of the sample for the element were subject to larger random errors.
The Bagdad cathodes were surprisingly uniform in impurity content except for the oxygen analyses and one high lead analysis (sample 4, laboratory A). Oxygen analyses, throughout the round-robin study, produced less consistency than desired. The extreme variability of oxygen analyses between laboratories is indicative of large systematic errors between laboratories. A possible source of error is in the standards. Several laboratories stated that Leco standards were used; these were designed as iron and steel standards. Of the spectrographic standards, only the Canadian standards contain oxygen in the particular range appropriate for oxygen determination in these samples.
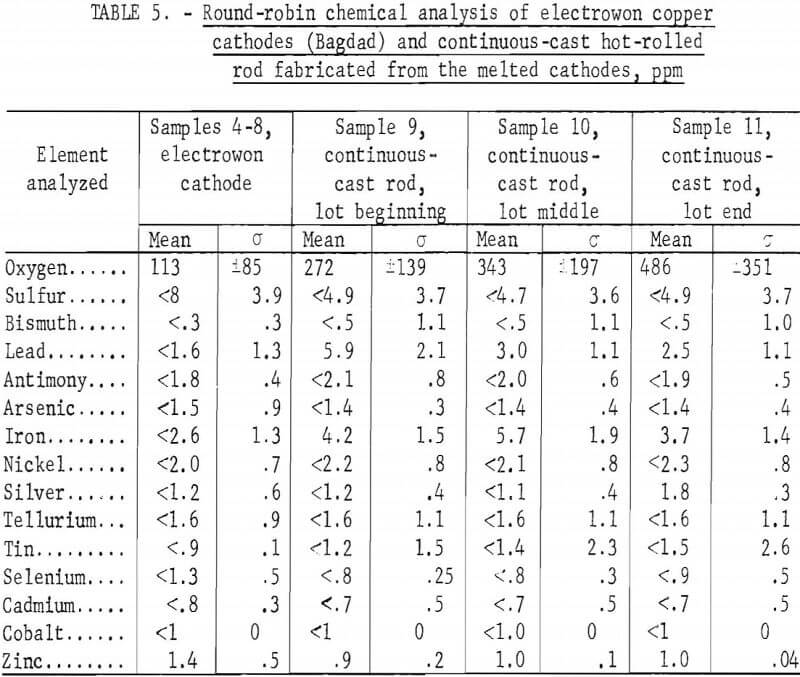
The remaining three samples, 9, 10, and 11, were obtained from each of three 40,000-pound loads of continuous-cast and rolled rod cast from previously sampled Bagdad cathode. Two 3-foot sections of rod were taken from each load. The analyses for these samples are shown in table 5 and in tables A-9, A-10, and A-11 in appendix A. The continuous-casting and rolling process caused slight increases in lead and iron impurities, and slight decreases in sulfur and possibly in selenium and zinc. The oxygen increased gradually from the beginning to end of the continuous-cast and rolled lot. The precision of
the analyses on the rod samples did not increase over that for the cathode, as would be expected; in fact, there were slightly higher variations between laboratories. (A new laboratory joined in the analyses at this time, with one of the earlier laboratories dropping out; this caused most of the change in the reported precision.)
Laboratory bias is readily shown in using the graphic method for analyzing the data. Plots of the data were made for the elements O, S, Pb, and Fe for each of the 11 samples. A typical graph of this type is shown in figure 4. The horizontal and vertical lines drawn through the average Y and X values, respectively, intersect in the consensus or mean analysis value. A 45° line drawn through the consensus intersection and extending into the ++ and — quadrants indicates the precision of the results. Perfect precision would be indicated if all of the points fell on the 45° line. Random errors displace the points from the 45° line. Therefore, perpendiculars from each plotted point to the 45° line are a means of estimating the precision of the procedure as revealed by the combined results from each participating laboratory. When the lengths are designated by P1, P2, Pn and n is the total number of lengths measured, then an estimate of the common standard deviation (s) is given by

Similarly, an estimate of the systematic error of each laboratory can be obtained by measuring the distance along the 45° line from the foot of the above-mentioned perpendiculars to the point of intersection of the horizontal and vertical lines (consensus). This distance, divided by gives the best estimate of the systematic error of the laboratory measured relative to the consensus of all the laboratories.
Results of the data evaluation by the graphical method for the impurity elements O, S, Pb, and Fe are shown in appendix A, tables A-12 through A-15.
Relative systematic errors appear to be most pronounced in the oxygen analysis, although the repeatability or precision within individual laboratories was good. There does seem to be some order to the individual laboratory estimates of relative systematic errors for oxygen. For laboratory A, the systematic error was positive for consensus values less than 250 ppm, and negative for all values greater than 250 ppm All estimated systematic errors were negative for laboratory B, except for those representing the very highest oxygen value (sample 1). The laboratory C analyses were all positive variations, except the one analysis of sample 11. The laboratory D values were just the reverse of those of laboratory A; all were negative deviations at oxygen analyses (consensus) of less than 250 ppm, and positive for greater than 250 ppm. Finally, all deviations on the three analyses submitted by laboratory E were in the positive direction.
The extreme variations in oxygen analyses, which were performed on Leco oxygen analyzers except for the one set run by neutron activation analysis, could be due to sample preparation prior to obtaining the analyses. Of the four elements evaluated by the graphical method, the analyses for iron and lead showed the least variation between laboratories.
Lead-Doped Copper
As-Cast, Equiaxeda Fine-Grained
Mechanical Properties
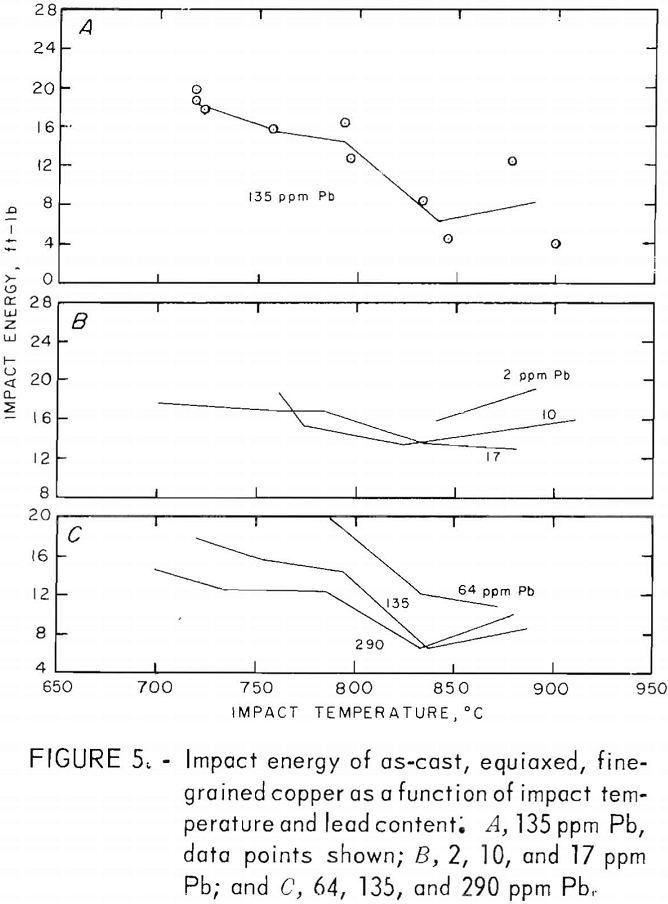
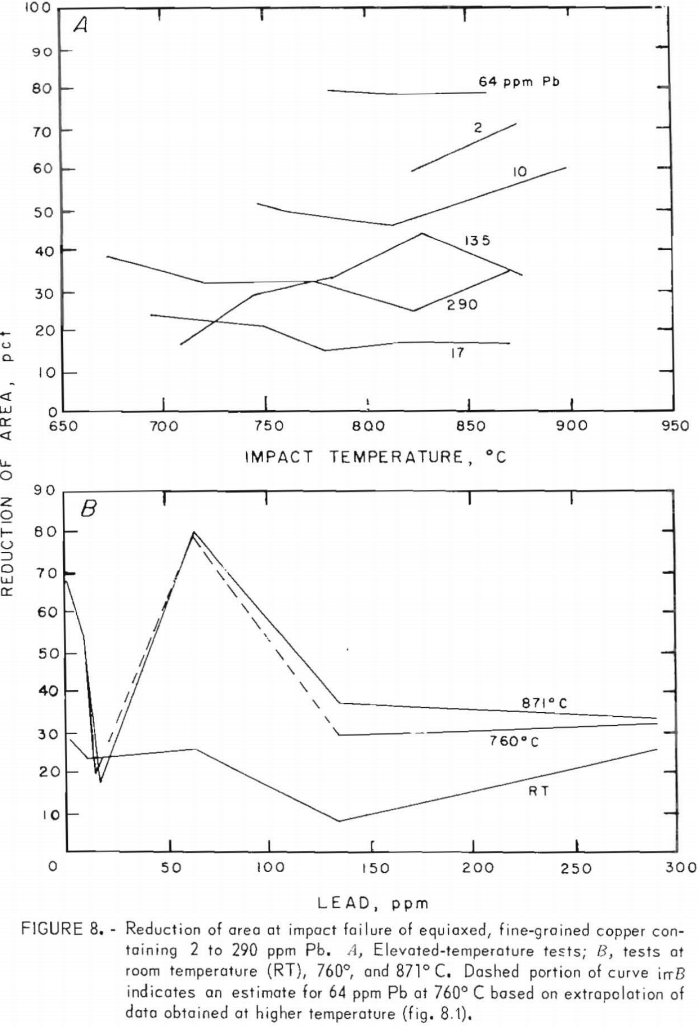
Tension-impact tests were performed at room temperature and over the hot-working range of copper (760° to 871° C) for material containing 10 to 290 ppm lead. The room temperature (RT) data were obtained in the range 20° to 25° C. Heat F8 was tested over the upper temperature limit only. The results, shown in figure 5, represent tests on heats F1, F2, F3, F7, F8, F10, and F11. The limits of oxygen content for this group are 200 to 400 ppm.
To aid in clarity, data points are omitted from most of the curves. A representative set for one of the heats (F10) is shown in figure 5A. The spread is typical of the other heats. Normally two specimens were tested at each furnace temperature; differences in impact temperatures resulted from variations in specimen placement times between the furnace and grips. The curves are drawn to connect means of these pairs of points except in cases where the temperature drop of one of the specimens was excessive. It is thought that this method is as valid as any for these data. The curves are taken as trend indicators rather than exact relationships. The estimated error in impact energy based on reading errors, specimen-diameter variations and temperature uncertainty is ±1 ft-lb. The larger deviations experienced probably are the result of heterogeneities in the cast material. Where large visible pores appeared in the fracture surface, the data for these specimens were discarded.
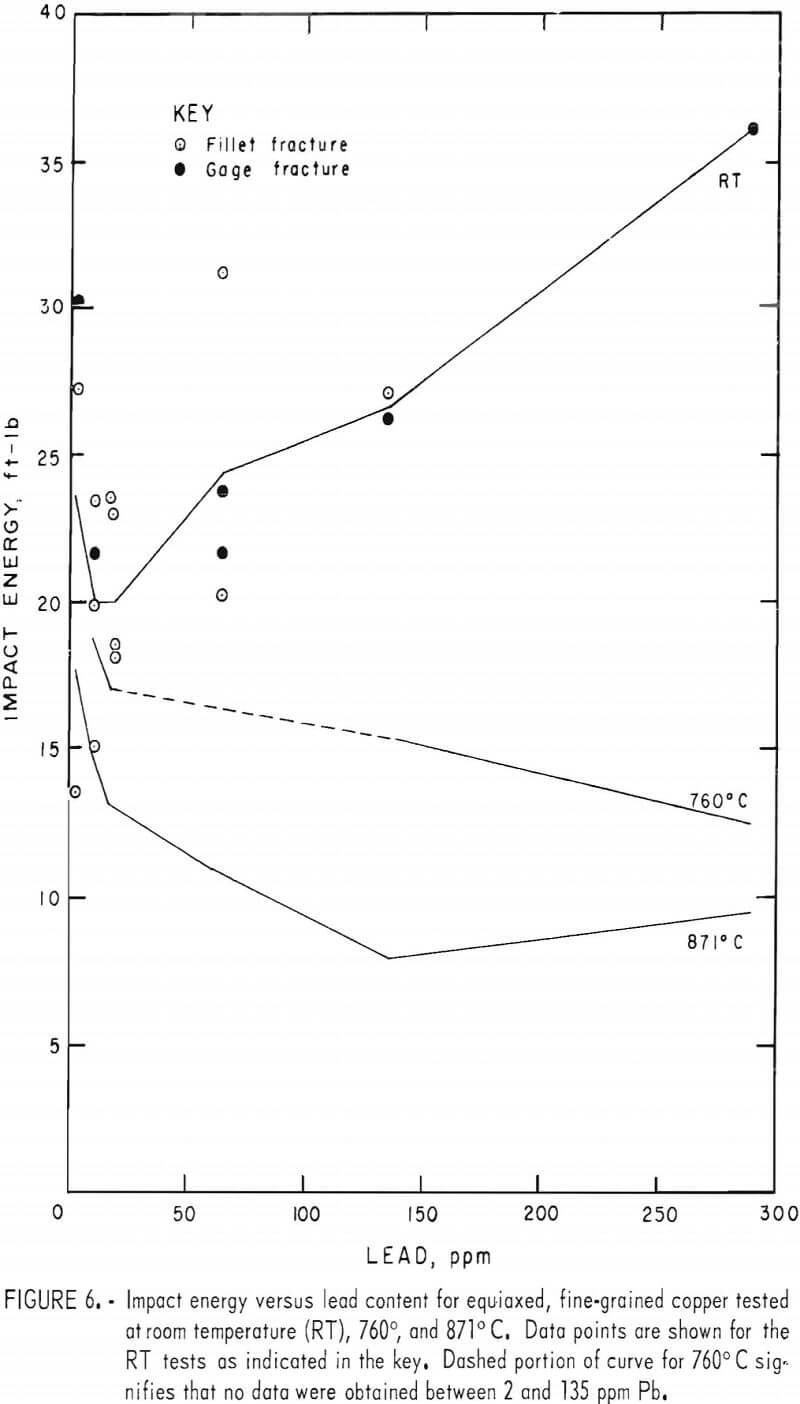
The variation of impact energy with lead content for the RT, 760°, and 871° C impact tests is shown in figure 6. No data point for 64 ppm at 760° C is given. Although an energy of about 20 ft-lb might be expected from the curve in figure 5C, the resulting peak in the lead-dependent curve is unsupported by other data. Furthermore, the data at 786° C (fig. 5C) are based on one point only, and are therefore less reliable. The dashed line in figure 6 reflects the uncertainty in the energy values in this region.
Some of the room temperature data were from specimens machined to a larger fillet radius to remedy cracking in the fillet. The resulting smaller gage diameter required corrections to the raw data by the factor A/Ar, where K is the mean original gage area and Ar the reduced area. No systematic change in impact energy values with reduced gage section was noted, other than a reduction in the data spread.
A sharp drop in impact energy results from raising the lead content from 2 to 20 ppm. Above this level, the trend becomes temperature dependent increasing at RT, while dropping further at 871° C.
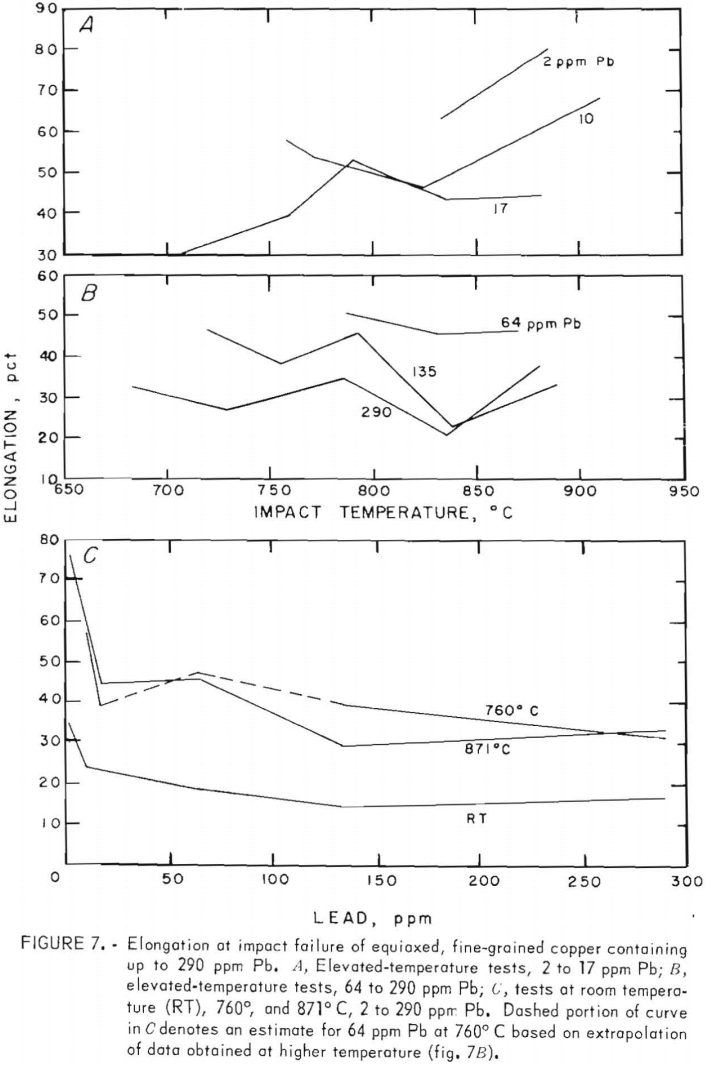
Percent elongation (PE) and reduction-of-area (RA) data, figures 7 and 8, vary insignificantly between 760° and 871° C. Maxima for 64 ppm lead at both temperatures are better substantiated here. Again, dashed lines in the figures represent estimates. The RT data in both figures are derived from reduced-gage specimens only. They generally follow the higher temperature trends.
Only two heats, F1 and F5, had sufficiently similar lead and sulfur contents together with differing oxygen levels such that the influence of oxygen on the mechanical properties could be assessed. Impact test data from these heats lead to the following relations between impact energy, Ec, elongation, PE, reduction of area, RA, and oxygen contents C0 :

Assuming these figures to be valid over the range studied, 200 to 400 ppm maximum deviations due to oxygen of 1.4 ft lb in energy values and 4 to 5 pct in ductility might be expected.
No two heats of the same starting stock, macrostructure, and lead and oxygen contents had sufficiently varied sulfur levels for this type of analysis. Overall, heats C5 (electrorefined) and C6 (Peruvian electrowon) came closest to these criteria. Specific mechanical properties at 871° C as functions of sulfur content (Cs) were determined to be

The derivation of these equations is treated in appendix. B.
Metallography
A typical microstructure of the FG copper appears in figure 9. A grain size of 102 µm was measured for this material, where each dendritic cell was counted as a grain. Grain sizes of all the FG heats fell within 100 to 150
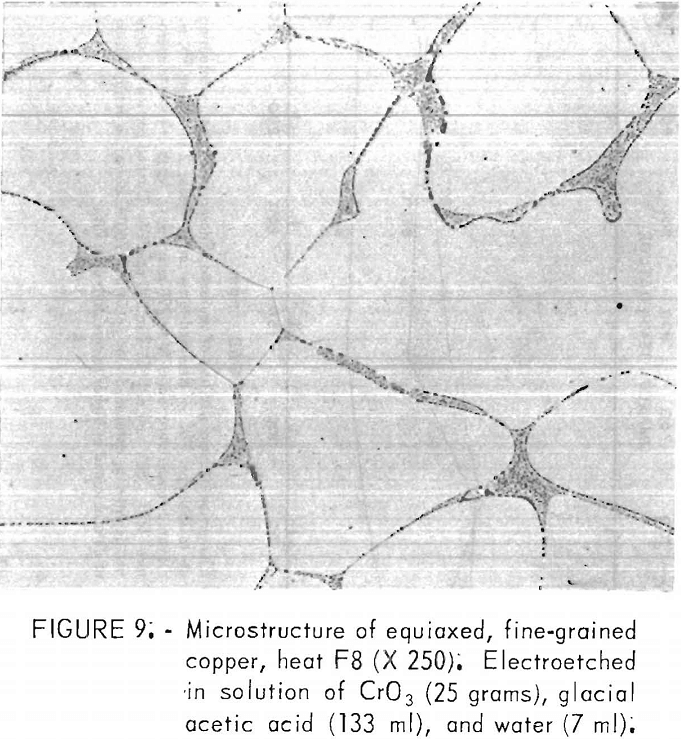
Oxides and pores were concentrated primarily in the grain boundaries, as expected from the segregation during cooling and solidification. The oxides were determined to be cuprous oxide by their “ruby red” color under polarized light and by electron microprobe analysis. Lead precipitates were found adjacent to these oxides in material where lead content exceeded about 100 ppm. No concentrations of lead were detected within the grains. Also, in these high-lead specimens, sulfur was detected in the same regions. No sulfur concentrations were found without those of lead, even though total sulfur contents varied little among heats. These determinations on the microprobe were qualitative; no specific phases were related to the measured values.
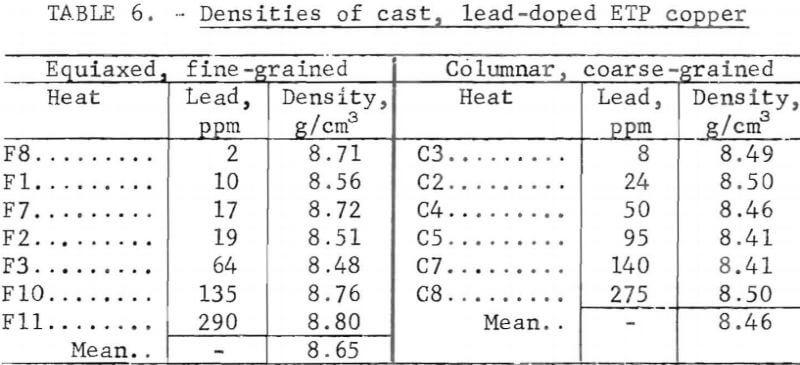
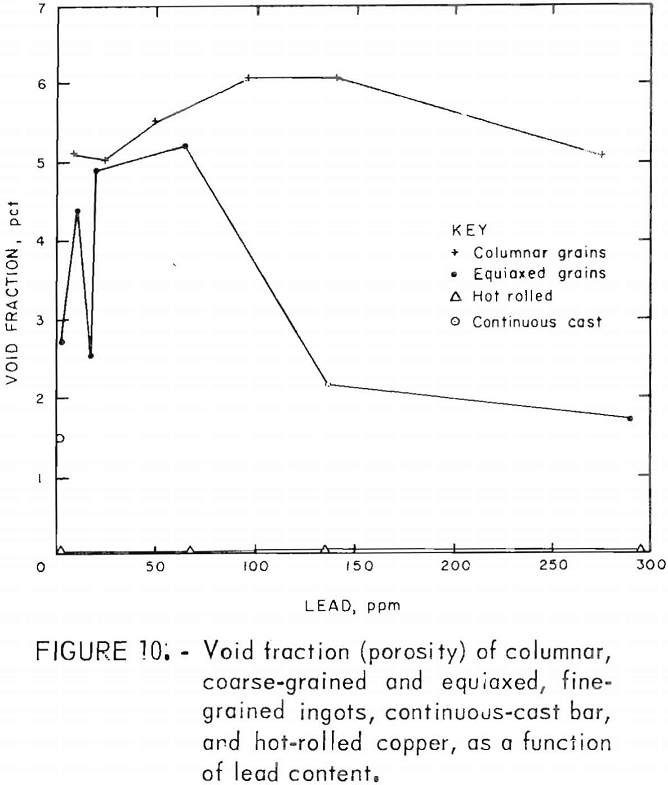
Porosity was not measured quantitatively from metallographic data. Relative estimates of porosity, based on a real pore densities and mean pore diameters, showed a maximum at medium lead contents. Quantitative data, table 6, extracted from density measurements, confirm this behavior. The points in figure 10 were calculated from these data by assuming all deviations from the ideal density, p0, are due to porosity; hence the void fraction, fv =1 – p/po. Here, Oo is taken to be 8.95 g/cm³, and p is the measured density.
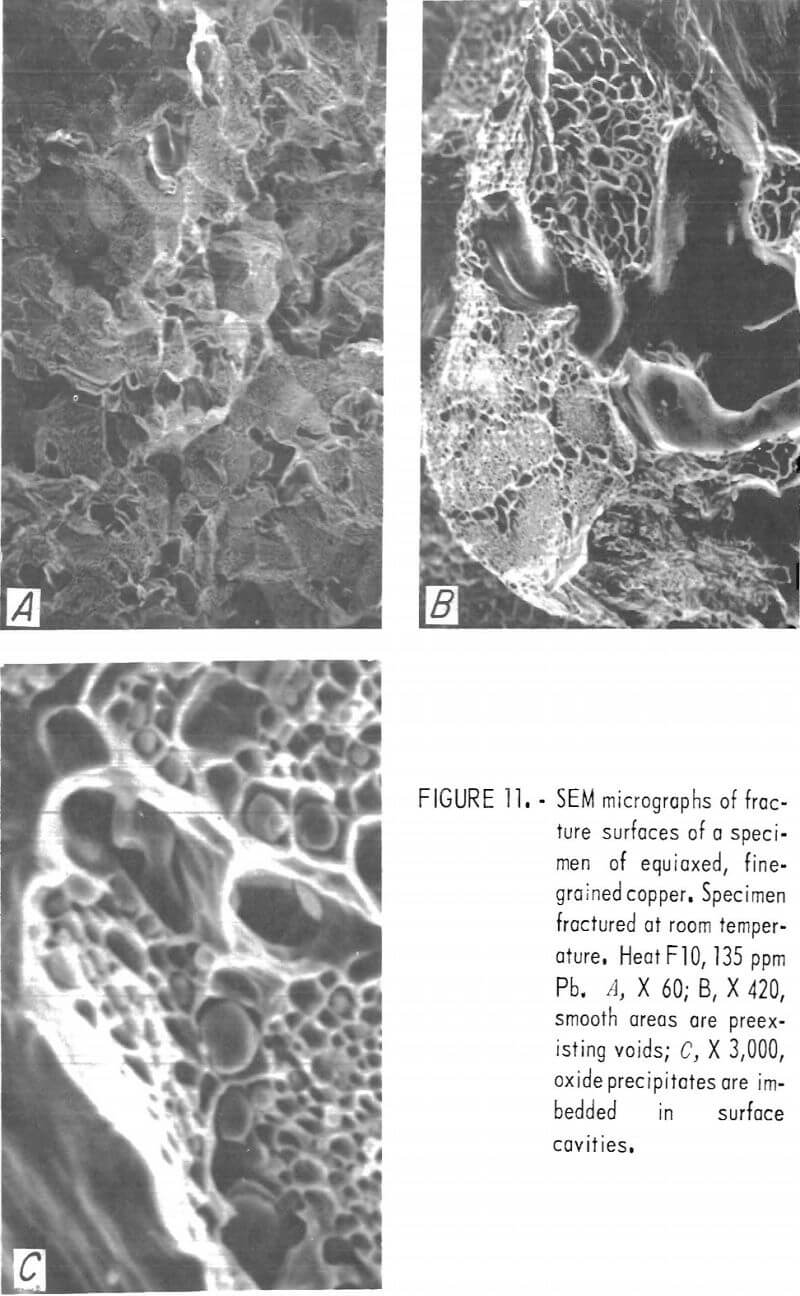
Fracture surfaces of specimens impacted at room and elevated temperatures were examined with the SEM. The RT fractures showed a distinct network of cavities covering much of the surface (fig. 11). Spherical precipitates appeared in many of these cavities. Comparison with optical photomicrographs of these materials shows these spheres to be of the same size, shape, and distribution as the Cu2O precipitates At lower magnification, the surfaces have a blocky, faceted appearance characteristic of intercrystalline fracture. The large smooth cavities are preexisting pores.
Rapid oxidation of the fracture surface following high-temperature impact obscures fine details.
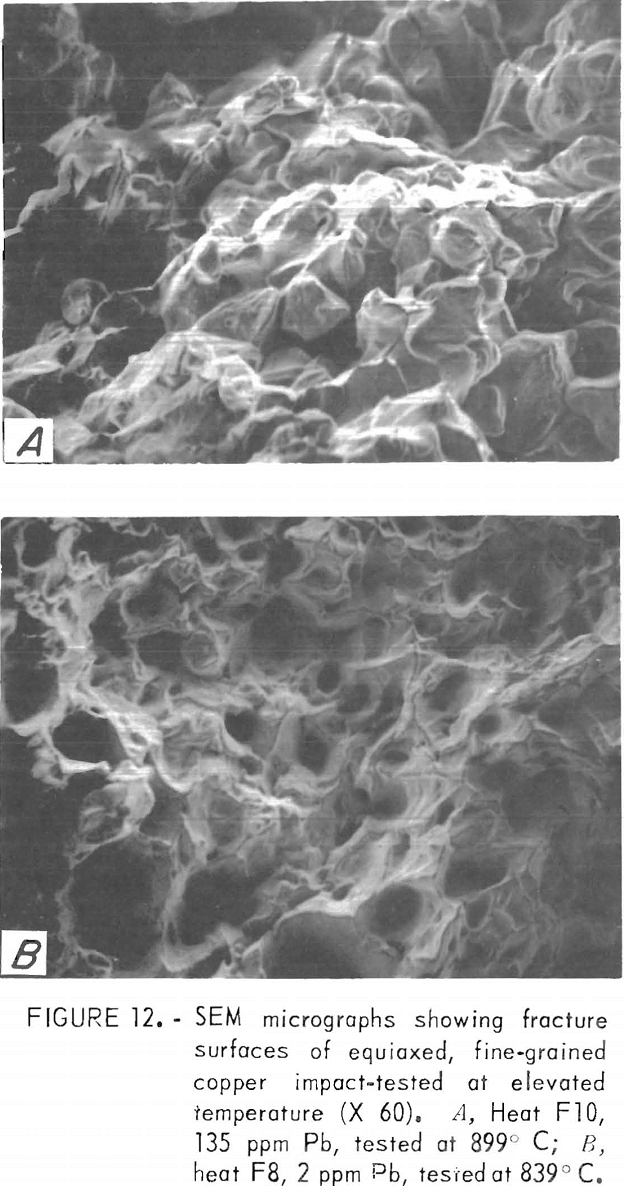
Nonetheless, some information may be obtained from SEM examination at lower magnification. SEM micrographs of hot-fracture surfaces of specimens containing more than about 100 ppm Pb show, as in figure 12A, an intercrystalline fracture surface similar to that at RT. Fracture surfaces of low-lead specimens exhibit the characteristics of ductile failure, with what seem to be rupture dimples (fig. 12B). However, the areal density of these dimples corresponds to that of the cast-in pores situated along interdendritic boundaries.
As-Cast, Columnar, Coarse-Grained
Mechanical Properties
Tension-impact tests were performed on the as-cast, columnar, coarse-grained copper over the same ranges of temperature and lead content employed for the equiaxed, fine-grained copper. Results are differentiated with respect to grain orientation (shown in fig 2).
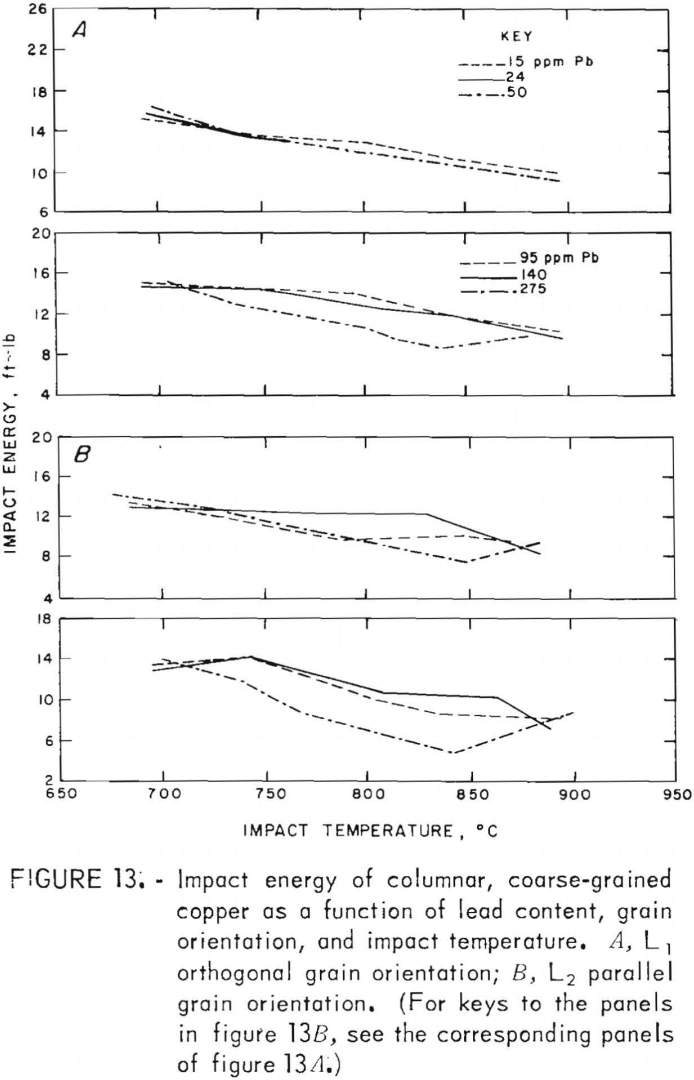
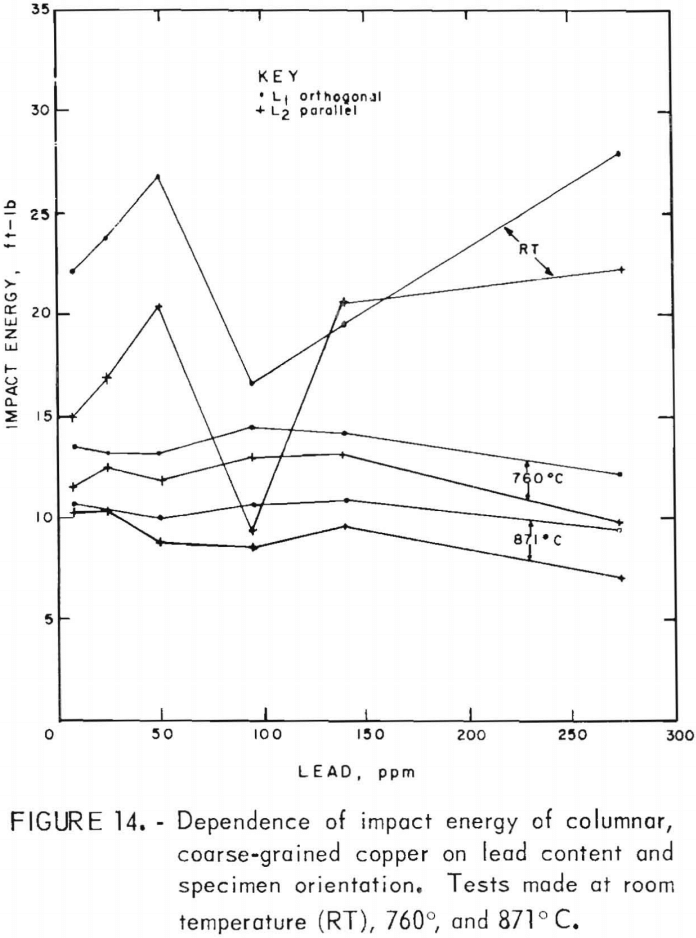
Impact-energy versus impact-temperature curves for both longitudinal orientations are shown in figure 13. Resultant isothermal curves appear in figure 14. In virtually all cases, the L1 specimens possess higher impact strengths than the L2. The high-temperature curves are similar to the 760° C data for FG specimens, with maxima at intermediate lead contents. In comparison, the RT data in this region seem anomalous with a sharp minimum at 95 ppm. At the low-lead end of the spectrum, the sharp rise in energy with decreasing lead that was observed for the FG material is absent.
Again, fillet fractures appeared at room temperature. Because of limited material, reduced-gage specimens were made for two heats only (C5 and C8). Consequently, comparative data between fillet and reduced-gage fractures are not available. The impact energies shown reflect both types of fracture, with the same cross-sectional correction applied as for the tests of the FG material. For clarity, data points are not shown; the scatter is of the same magnitude as for the FG.
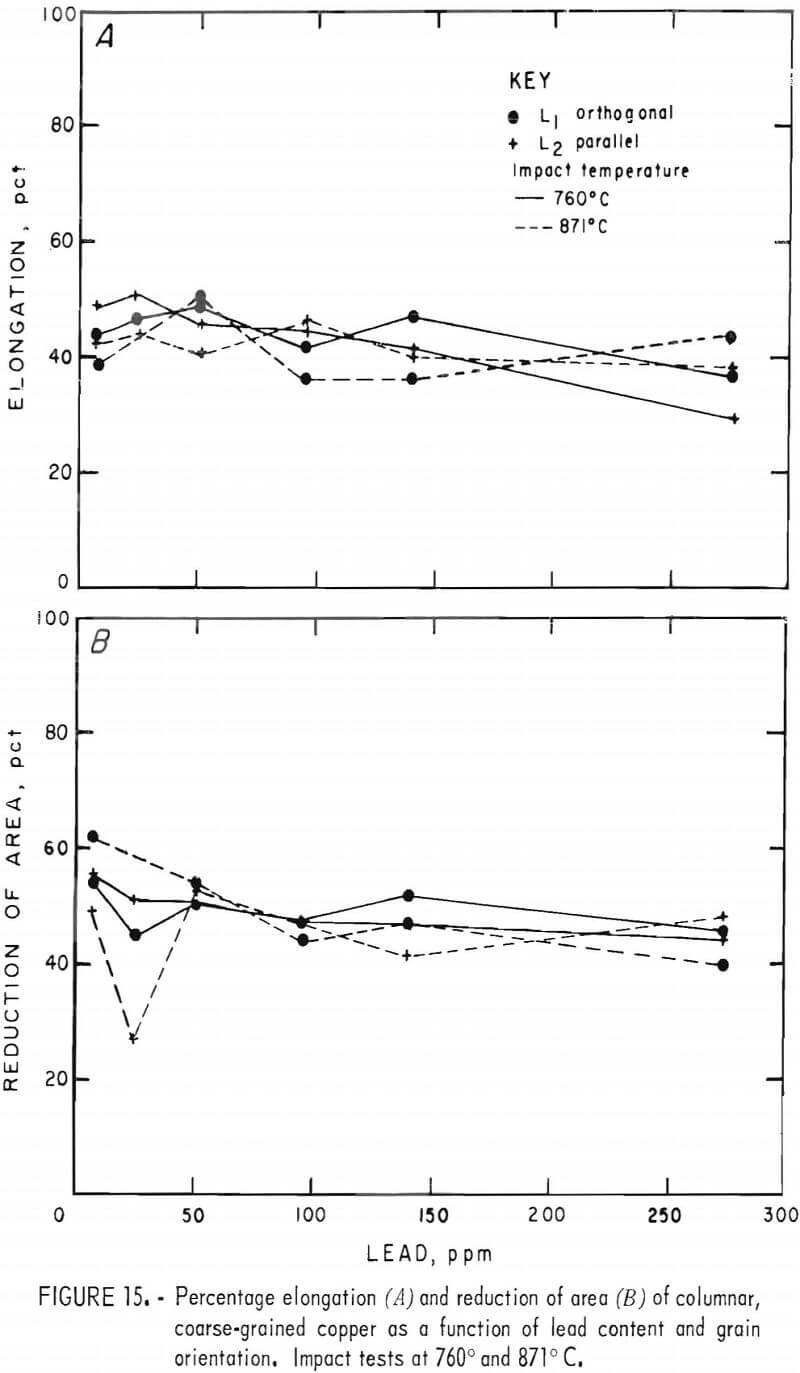
Elongation varied little with either lead content or temperature, as seen in figure 15A. Furthermore, no systematic distinction between grain orientations is evident. Room temperature data, not plotted, generally overlapped those shown for the higher temperatures.
The elevated-temperature RA data, figure 15B, depict similar behavior showing no variation with temperature, and a slight decrease with increasing lead. Three RT specimens that fractured within the gage section had RA values of 23 to 31 pct. The remainder fell below 20 pct.
Metallography
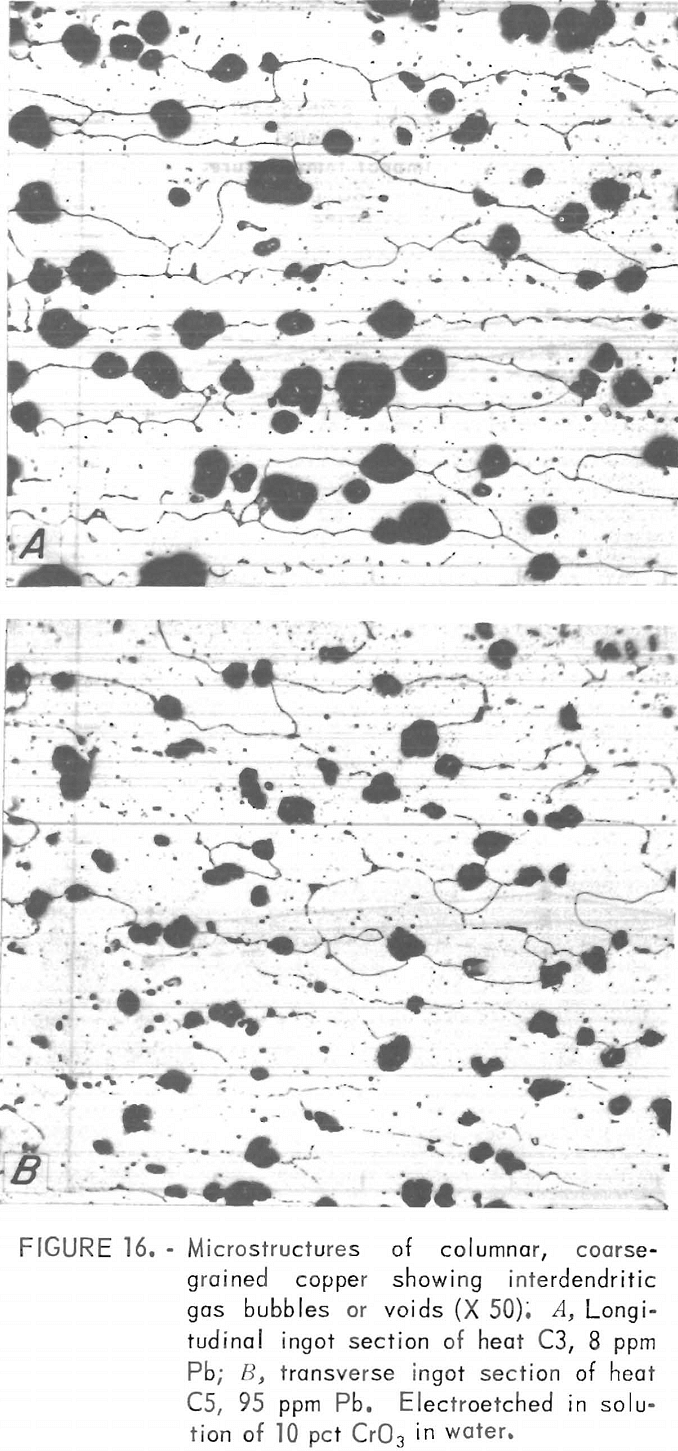
A typical columnar, coarse-grained structure is shown in figure 1B. Mean grain widths of the six heats measure from 1.1 to 1.6 mm, with aspect ratios ranging from about 1 to 9. Both “linear” (fig. 16A) and “disarrayed” (fig. 16B) dendritic structures were noted, having cell diameters ranging from 80 to 130 µm.
Pore densities in the CG material exceeded those in the FG material. Unlike the FG material, porosity of the CG material decreased monotonically with lead content and covered a narrower range (fig. 10). Mass density data, from which the porosity values are derived, are listed in table 6. By comparison, a density of 8.82 g/cm³ and corresponding porosity of 1.4 pct were measured for continuous-cast electrorefined copper.
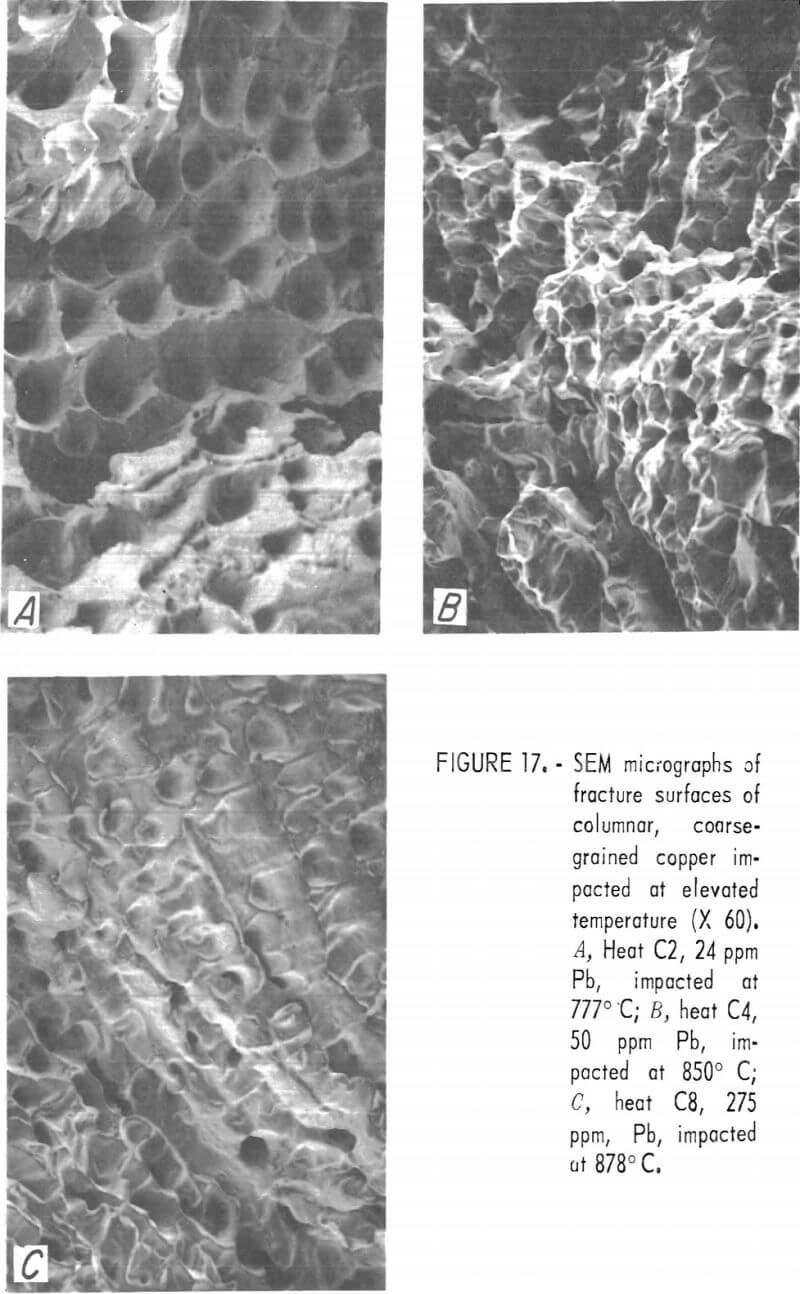
The “linear” dendritic microstructure is reflected in the SEM micrographs of fracture surfaces. High-temperature fractures of low-, intermediate-, and high-lead copper are shown in figures 17A through 17C, respectively. The apparent transition from ductile to inter-crystalline fracture may be misleading. The “rupture dimples” in figure 17A have a surface density of 2,800 cm-² about one-half that estimated for the prefracture pore density.
Room temperature CG fractures possess the same features as do the fractures of the FG specimens a fine network of dimples containing globular precipitates and larger voids. At all lead contents, fracture occurred along interdendritic boundaries.
Hot-Rolled
Mechanical Properties
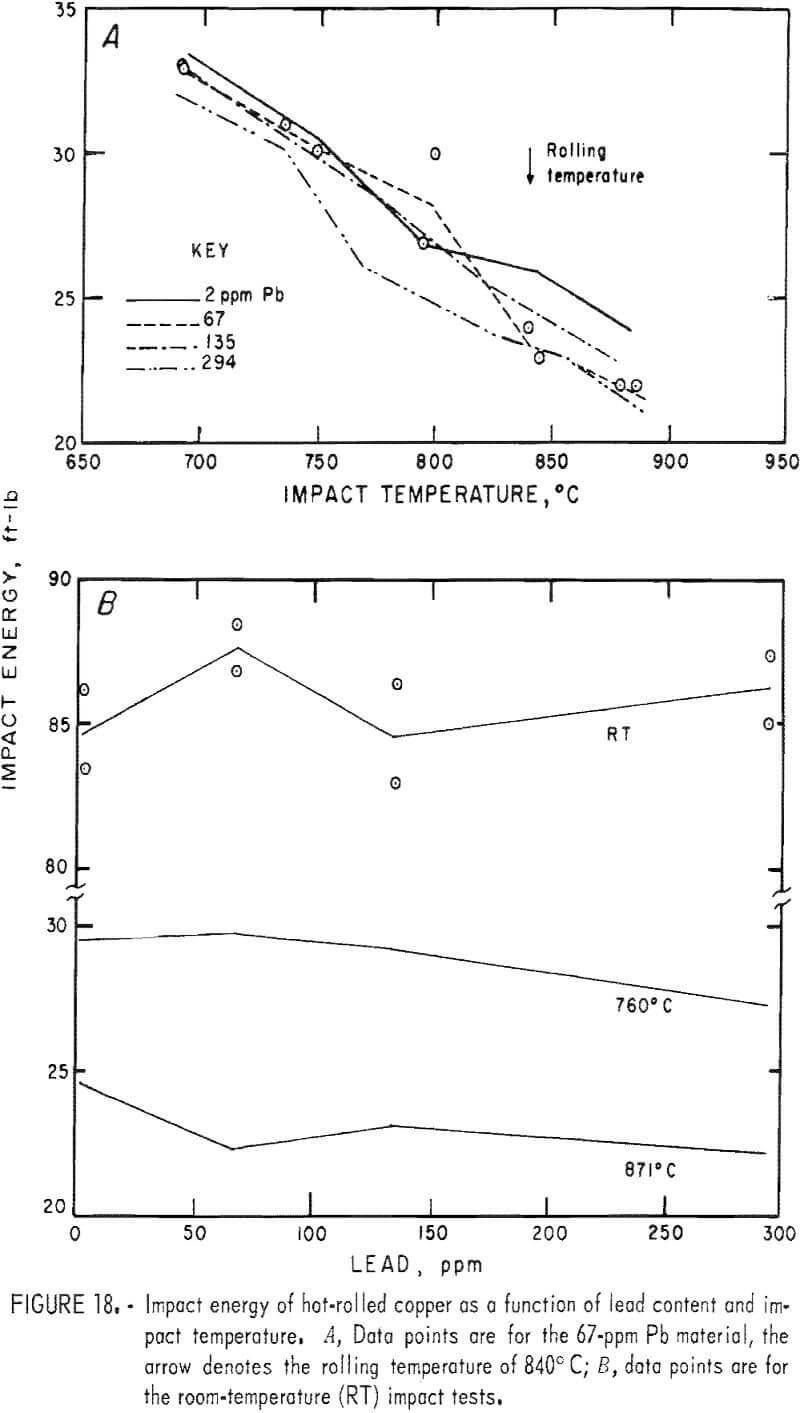
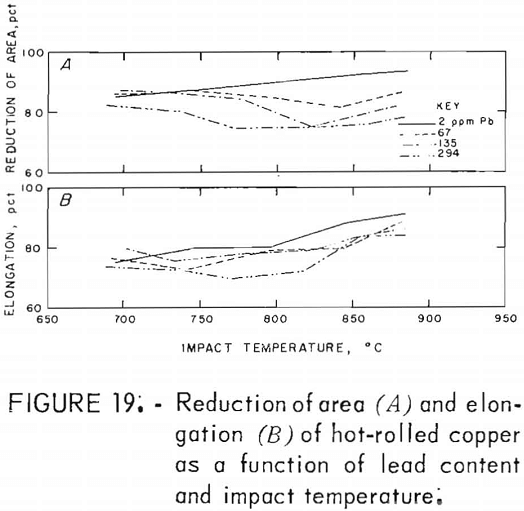
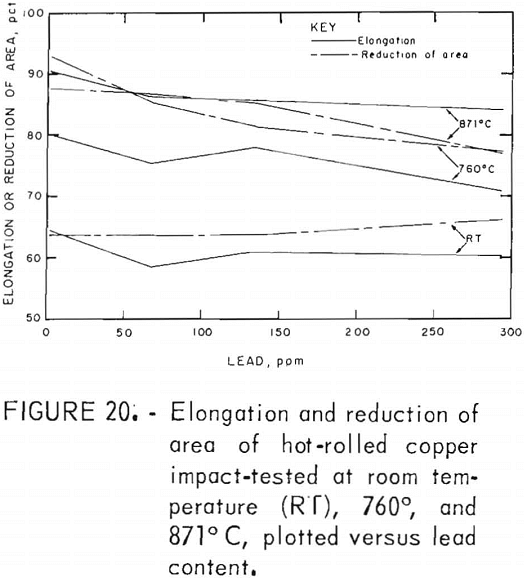
Hot rolling to 60-pct reduction in area improved the mechanical properties by a factor of about three. Both temperature and lead dependencies of impact energy, elongation, and reduction of area are given in figures 18-20. Scatter in the data was reduced to ±5 pct, reflecting greater homogenization of the material. Interestingly, the scatter maximizes in the middle of the temperature range. Over the 2- to 300-ppm-Pb range, the impact energy decreases 8 pct at 760° C and 10 pct at 871° C. A 0.6-pct increase for the RT data over this range of lead is overshadowed by the fluctuations at intermediate levels. Note the change of scale for these data, which exceed by a factor of almost two the data recorded for cast OFHC copper (50 ft-lb). Also, it should be noted that all hot-rolled specimens fractured within the gage, rather than at the fillet.
The high-temperature ductility has a similar slight lead dependence. The RA values are relatively temperature insensitive.
Metallography
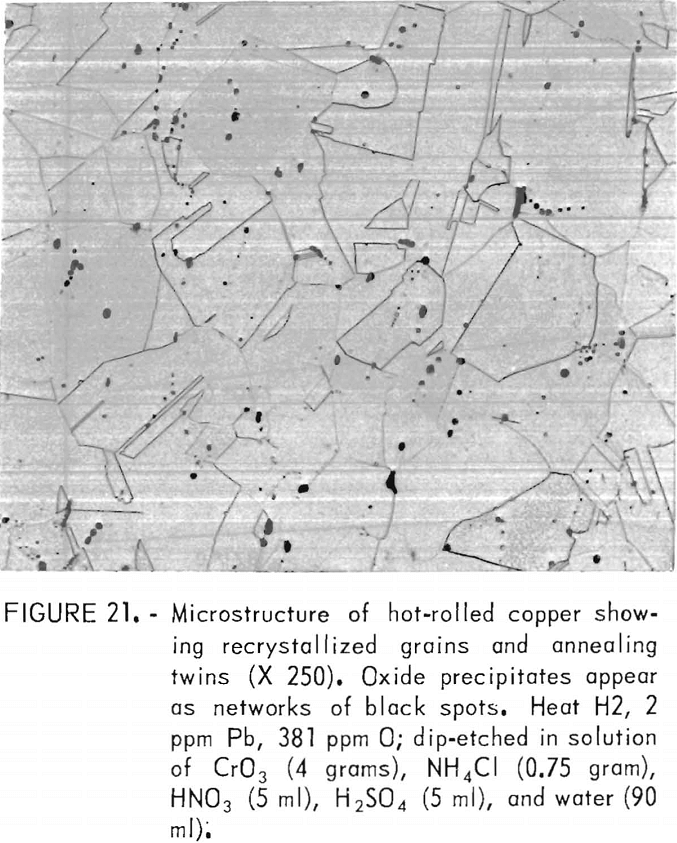
Hot rolling produced a recrystallized, equiaxed structure with a grain size of 36 to 49 µm. The grain boundaries were largely independent of the original network of oxide precipitates. Figure 21, showing this structure, may be compared to the as-cast microstructure for this heat shown in figure 9. Grain sizes, densities, and porosities of the four heats are listed in table 7. It is seen that porosity is nearly eliminated by the hot work.
Electron microprobe analysis showed that hot working did not affect the lead-sulfur configuration observed in the as-cast material. Lead and sulfur were precipitated together in the Cu2O network.

All specimens of this material, including those tested at room temperature, fractured in a purely ductile mode.
Discussion
Round-Robin Chemical Analysis
Analyses of 15 minor and trace impurities present in 2 lots of continuous cast electrowon copper from separate sources were compared with impurity analyses in 1 lot of similarly cast, electrorefined copper. All three materials surpassed the chemical requirements for electrolytic cathode copper, ASTM B115 and for electrolytic copper wire bars, cake, slabs, billets, ingot, and ingot bars, ASTM B5; both ASTM standards require a minimum purity of 99.9 pct copper with silver being counted as copper. In fact, discounting the oxygen impurity, all three materials had total impurities of less than 65 ppm, which is better than the 99.99-pct minimum requirement for the best grade commercial copper, oxygen-free electronic (OFE). However, the Peruvian electrowon copper would not qualify for this grade because of its relatively high lead content (22 ppm). It was significantly higher only in lead impurity in comparison with the electrorefined material but was lower in silver and selenium; sulfur was about the same in the two materials. The Bagdad electrowon copper had higher overall purity than the electrorefined; although it contained slightly higher lead, it was lower in S, Fe, Ag, and Se.
A slight increase in lead and iron impurities occurred during the melting-casting-rolling process, based on the analyses of Bagdad cathode and continuous-cast rod. A substantial increase in oxygen was observed, from 270 ppm at the beginning to 490 ppm toward the end of the lot; it was probably due to the combustion setting of the furnace during melting. During this processing, there were indications that slight decreases in S, Se, and Zn impurity contents may also have occurred.
The numerical method of evaluating the chemical analysis of certain elements in samples 4 through 8 indicated that the repeatability at the 95-pct confidence level on the analysis of Bi, Sb, As, Ni, Ag, Te, and Sn was less than the respective standard deviations and that reproducibility of analysis on a given element was generally on the order of three times the standard deviation. The nonuniform detection limits between laboratories are reflected in the higher reproducibility values.
Essex had found that the lot of Bagdad electrowon copper included in the round-robin analysis had drawability comparable to that of electrorefined copper when drawn into sizes AWG 19 through AWG 40 (shaved rod used for drawing AWG 40). They found also that the impurity level from this rod was lower than that of some conventional electrorefined copper.
Lead-Doped Copper
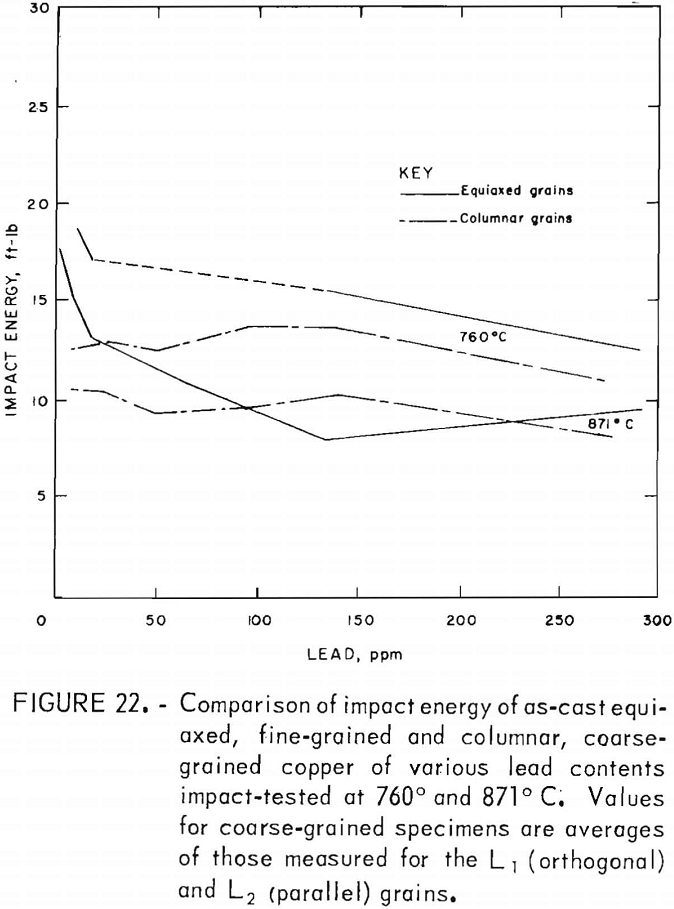
Direct observations of the effect of lead on hot working were made only to the extent that copper castings containing up to 300 ppm Pb were hot-rolled by 20-pct reductions per pass without edge cracking. This is consistent with the tension-impact results, which show elongations of 30 pct or more over the same range of lead contents in the hot-working range. This lower limit applied to both the fine- and coarse-grained materials. The measured data indicate that lead does, in fact, play a minor role in affecting the high-temperature mechanical behavior, with the exception of low levels of lead in fine-grained material. For hot-rolled copper, where the oxide and lead precipitates have been redistributed to a large extent away from grain boundaries, the impact energy is reduced no more than 11 pct over the range of lead contents evaluated. Fracture of coarse-grained material is dominated by morphological factors, as evidenced by the consistently stronger orthogonal grain structure for all lead contents. Impact-energy curves for the fine- and coarse-grained copper are compared directly in figure 22. The curves for the columnar-grained material are derived from the mean values of the L1 and L2 data.
No explanation has been found for the apparently anomalously high values of ductility at 64 ppm Pb indicated in the high-temperature curves for the fine-grained copper.
It is perhaps not too surprising that high lead levels exert little influence on strength or ductility. The microprobe results indicated the presence of lead concentrated along the Cu2O precipitate network. Quantitative measurements to determine the extent to which the lead precipitated were not made. As the equilibrium phase diagrams of the Cu-Pb or Cu-O-Pb systems have not been precisely determined, the solubility of lead in copper is not known with any certainty. The best estimates for oxygen-free copper are >250 ppm above 760° C. Above these levels, insoluble lead segregates at the interdendritic boundaries. In the absence of oxygen, such segregation could prove harmful, acting as crack nuclei and lowering the strength. However, with oxide precipitates along the boundaries, the damage is already done; that is, the oxides now act as crack nuclei, and the additional lead aggregates contribute little more. Photomicrographs with the SEM of room temperature fracture surfaces reveal such oxides in place along the fracture surface. Under such conditions, the oxide-matrix interface has evidently separated, leaving a hemispherical cavity. Ductile fracture of the remaining copper-copper interface then follows. It is reasonable to assume that a similar mechanism is operative at elevated temperatures.
The morphological factors alluded to earlier include porosity, grain size, dendrite size, and orientation. Although the CG material had a higher mean porosity than the FG, no explicit correlation between it and mechanical properties was found. A more thorough analysis, such as the distribution between the interdentritic boundaries and the matrix, or the pore-size distribution, might reveal some specific effects. Material with similar low levels of impurities and similar grain structures would be necessary to isolate any effects.
Grain size, as used here, refers to the “macroscopic” size (fig* 1). In the FG material, this coincides with the microstructure, that is, the dendritic structure, which is about the same size in both the FG and CG materials. Although grain size has a well-established inverse relation to strength in single-phase materials, it is unclear to what extent it affects the interdentritic type encountered here. The SEM micrographs, which show a more “planar” surface for the CG fractures than for the FG fractures, suggest that the linear orientation afforded by the large columnar grains creates an easier crack-propagation path. Such a model might explain the consistently higher strength of the orthogonally (L1) oriented grains. The boundary between the two orientations of columnar grains lies normal to the direction of crack propagation and may interrupt it. The extra energy needed to propagate the crack through this region may account for the observed difference (1 to 2 ft-lb), although this has not been shown conclusively. Elongation or reduction of area should not be measurably affected by this relatively small region, as was confirmed in the results obtained.
The role of oxygen has already been discussed qualitatively. Quantitatively, the only data available cover levels above 380 ppm, where moderate variations in oxygen would not be expected to have substantial additional effect. In the absence of specific data below about 400 ppm, no corrections for oxygen have been applied.
Sulfur appears to exert at least 20 times as much influence as oxygen. However, some complicating factors prevent application of this correction to the mechanical property data. First, an investigation by Bigelow and Chen has shown a eutectic at 810° to 850° C in the Cu-S-O system at 300 ppm O, with corresponding limits of sulfur solubility of 20 to 30 ppm. The test temperatures and sulfur contents experienced in the present study fall into this region. Second, microprobe results and other investigations indicate a lead-sulfur interaction at these temperatures. With 85 and 90 ppm Pb potentially available to tie up free sulfur in the two test heats, it is not clear whether either or both were in the solid-solution or liquidus regions at 871° C. It can be stated that the downward trend in energy and ductility reflects a deleterious effect of sulfur above 30 ppm.
Summary and Conclusions
The significant impurity differences in electrowon cathode from two sources were in sulfur and lead. The Peruvian cathode, which was relatively high in lead and sulfur, was “hot short” when cast, on a continuous-casting machine.
The continuous-cast Bagdad electrowon copper had a lower overall impurity content than the continuous-cast electrorefined copper sample (Kennecott) tested. Although the Bagdad material was higher in Pb after casting, it was lower in S, Fe, Ag, and Se.
Comparison of the analysis of Bagdad cathode with the same material after melting, casting, and hot-rolling to rod indicated that increases in O, Pb, and Fe impurities had occurred and that S and possibly Se and Zn had decreased.
Reasonable agreement of analysis occurred between laboratories for impurity elements Pb, Bi, Sb, As, Fe, Ni, Ag, Te, and Sn, which were analyzed by the emission spectrographic method. There seemed to be some difficulty among laboratories either in equipment or in procedure in providing analyses for Se, Cd, Co, and Zn impurities. The least interlaboratory agreement in analyses occurred for oxygen. There is an apparent need for improved standards and/or procedures for determining oxygen in copper.
Lead was added to ETP copper in concentrations up to 300 ppm for evaluation of its effects on hot workability. Both fine-grained, equiaxed and coarse-grained, columnar castings were produced. Some of this material was hot-rolled to produce a recrystallized grain structure.
Specimens of the three materials were tension-impact-tested over the hot-working temperature range, 760° to 871° C. Values of impact energy, elongation, and reduction in area were determined. Fracture surfaces were observed under the SEM. The fine-grained material displayed a 26-pct drop in impact energy up to 20 ppm Pb, followed by a more gradual decrease. In comparison, the coarse-grained material fractured at a lower energy with little dependence on lead. Hot rolling raised the impact energy by a factor of roughly 1-½ to 2-½. The influence of lead was reduced to <11-pct drop in energy over the entire compositional range.
The coarse-grained material showed higher porosity, overall, than the fine-grained; however, no correlation between this and impact energy was discovered. Differences in impact energies between the two types are attributed to the grain orientation. Hot rolling resulted in recrystallization such that the grain boundaries no longer coincided with the oxide network.
It may be concluded from these results that grain structure is as significant as lead impurities in influencing the impact deformation behavior of cast copper. With only a few exceptions, elongations (½-inch gage length) and reductions of area were at least 30 pct for all lead contents evaluated for each cast morphology; this extent of ductility would be expected to insure reasonable workability. Following the initial breakdown and recrystallization, elongations before failure under impact increase to 70 pct or greater at 60-pct reduction of area. Therefore, lead levels up to 300 ppm can evidently be tolerated in moderate hot working of copper.
Although the specific effects of lead interaction in ETP copper were not determined, it was shown that (1) room temperature fracture occurred along the Cu2O precipitate network, (2) lead at high levels concentrated at these precipitates, (3) sulfur tended to concentrate at the lead precipitates, and (4) separation of the grain-boundary network from these precipitates through hot working substantially increased the impact energy and lessened the influence of lead.
