Table of Contents
The 10-mm Dorr-Oliver cyclone is used for dust compliance sampling, which includes both stationary and personal sampling. The cyclone classifies “respirable” size particles, which are particles that reach the alveolar regions of the lungs, usually considered to have aerodynamic diameters (AED) of 10 µm or less. Although there are believed to be no instruments that actually sample true respirable size dust, the cyclone has been chosen in the United States as the device that most closely simulates the penetration of dust into the lung.
The purpose of this Bureau of Mines study was to perform a simple screening test on the 10-mm Dorr-Oliver cyclone to determine if the effects of increased wind velocities and orientation need to be further investigated.
The study looked specifically at three areas:
Effects due to increased air velocity.
Orientation effects at increased velocities.
Effects of a shield around the cyclone inlet.
Low-Velocity Studies (10-mm Cyclone)
The sampling performance of the 10-mm cyclone has been studied in static and low air velocities (<300 ft/min). These studies have shown no significant sampling differences due to velocity or sampler orientation.
One study that evaluated the sampling inlet efficiency of the 10-mm cyclone in static air conditions showed that losses due to improper inlet sizing had little effect on the respirable dust measurement of the cyclone when operated at 2 L/min. Sampling inlet losses were under 5 pct whenever the radius of the sampler opening, divided by the particle stop distance, was greater than 1.5.5 This is true for the 10-mm cyclone for all particles smaller than 6-µm AED. Since 85 pct or more of the particles larger than 6 pm will be captured, inlet loss is insignificant in static air.
In another study, there were no significant differences on the 10-mm cyclone for air velocities ranging from 50 to 300 ft/min, for dust loads ranging from 0.5 to 6 mg/m³, or for sampler orientation. The orientations tested were facing toward airflow, facing away from airflow, and perpendicular to airflow direction.
High-Velocity Areas
Many current factors in mining are contributing to a need for increased airflow. For example as mining expands to greater depths, methane levels tend to increase and higher air velocities are needed to sufficiently dilute the methane gas.
Longwall mining, which is also increasing each year generally requires airflows that are higher than on continuous or conventional mining sections. Airflows as high as 1,200 ft/min have been recorded on U.S. longwall panels. These increases in airflow velocity are primarily due to—
- The decreased intake area on long-wall panels.
- The increased air volumes needed to adequately dilute the large quantities of where 5ds = (QT/4π)1/3
where ds = particle stop distance,
Q = sampler volumetric flowrate,
and T = relaxation time for the largest particles of interest.
contaminating gases released due to long-wall mining’s high coal extraction rate and overburden fracture.
High air velocities can also be encountered in surface mining and may affect the sampling performance of the cyclone whenever strong winds are present. The air direction and velocity can change drastically in minutes, and as little as an 8-mi/hr wind can produce a 700-ft/min flow past the cyclone.
High-Velocity Studies
Studies have been performed on various samplers at velocities above 300 ft/min, but none of these studies have been primarily concerned with respirable dust sampling by the 10-mm cyclone sampler. A study performed on the collection efficiency of an environmental aerosol sampler used in the United Kingdom showed reduced efficiency at high velocities. At wind velocities above 790 ft/min, only 60 pct of the 6-µm AED particles and only 15 pct of the 10—µm particles were sampled, as compared to results with isokinetic samplers.
A similar study was performed on the collection efficiency of three types of field dust sampling filter cassettes. Tests were conducted in a chamber in which the cassettes were rotated to generate relative wind velocities of approximately 0, 400, and 1,000 ft/min. The worst case recorded was for a 37-mm open-face cassette which over sampled by a factor of 2 when faced into the wind and undersampled when its inlet was at 90° and 180° to the airflow.
The effects of wind direction on inlet efficiency were also observed by the University of Minnesota’s Particle Technology Laboratory on a newly designed inlet for sampling inhalable particles. This work suggested that shielding the inlet might reduce the effects of velocity.
In this report the term “sampling error” refers to the sampling bias resulting from the inlet. Other factors can also contribute to the overall sampling error, such as dust deposition of the inner tubing walls, response of the light-scattering device used, fluctuation in dust feed, and other errors. However, we feel these errors are small when compared to the effect of velocity on the sampler inlet efficiency.
Dust collection on the inner walls of the cyclone and tubing could be a factor in dust sampling but was judged insignificant because once the air enters the cyclone, it is not dependent on the effects of the external air velocity, and all inner walls were of equal length.
Light-scattering photometers, used to measure mass dust concentrations, can be influenced by changes in the dust size distribution. Because the cyclone classifies the particles to permit only “respirable” sized particles to pass into the instrument, the effect should be minor. However, future research to verify this may be warranted.
Equipment
Testing was conducted in a wind tunnel at the Pittsburgh Research Center. Pittsburgh coal seam dust was loaded into a hopper. The dust feed was sized so that 100 pct passed through a 20-mesh screen, and 20 pct through a 200-mesh screen. The dust was transported by a controlled vibrator from the hopper into a grinder. From the grinder, the coal dust (approximately all passing 200 mesh) was blown by a small fan into a near-static chamber, where it was uniformly mixed with air.
Figure 1 shows the exhaust ventilating wind tunnel setup. The dusty air first entered the section where the low- velocity sampling was performed. This was followed by the much narrower (18-in diam) high-velocity sampling section.
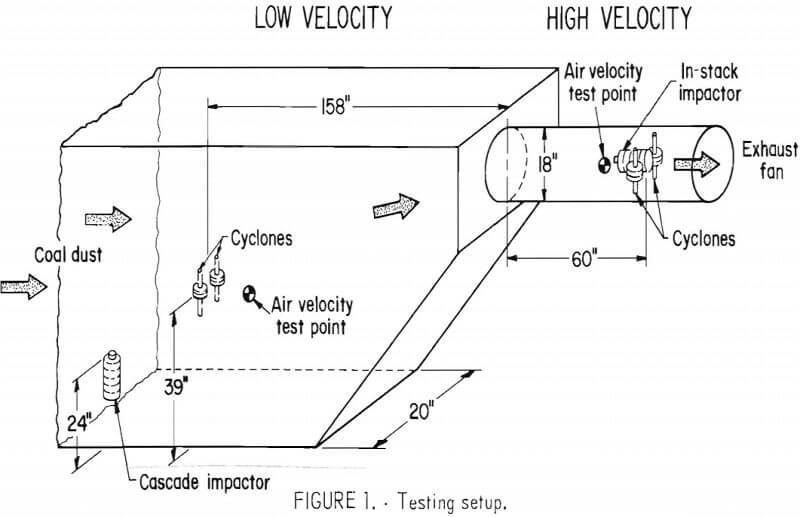
Impactor size distribution measurements were taken to insure that the experimental conditions did not change the coal dust particle size distribution. In the low-velocity section, an Andersen eight-stage cascade ambient impactor was used. In the high-velocity location, an Andersen eight-stage in-stack isokinetic sampler was used. Impactors were operated according to manufacturers instructions.
Test Procedures
Tests were conducted to determine the effects of (1) air velocity, (2) inlet orientation, and (3) inlet shielding on the sampling efficiency of the 10-mm cyclone.
Air Velocity
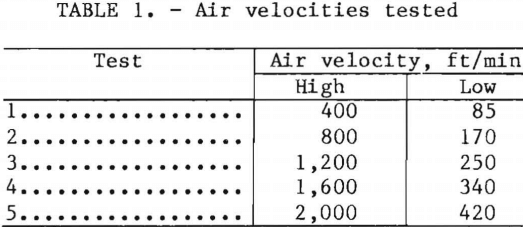
The total velocity range tested was 85 to 2,000 ft/min. The high-velocity air-flow ranged from 400 to 2,000 ft/min, in 400-ft/min increments. The low-velocity airflow was approximately one-fifth of the high-velocity airflow. Table 1 shows the five different test conditions. Airflow measurements were taken for each test using a hot wire anemometer.
The coal dust aerosol was sampled through the 10-mm Dorr-Oliver nylon cyclones located in the center of each testing location. The cyclones were connected by equal lengths of flexible tubing to instantaneous-reading GCA real-
time aerosol monitors (RAM-I).
The RAM instruments were connected to a strip chart recorder to give a continuous concentration measurement. The average concentration for a given time interval was determined by integrating the area on the chart, using a polar planimeter.
Four cyclones were used, two in each section of the tunnel. One cyclone in each section was mounted on a narrow rod which could be turned to allow the cyclone to sample in any direction; the inlet of the other cyclone (the reference cyclone) was always oriented into the airflow.
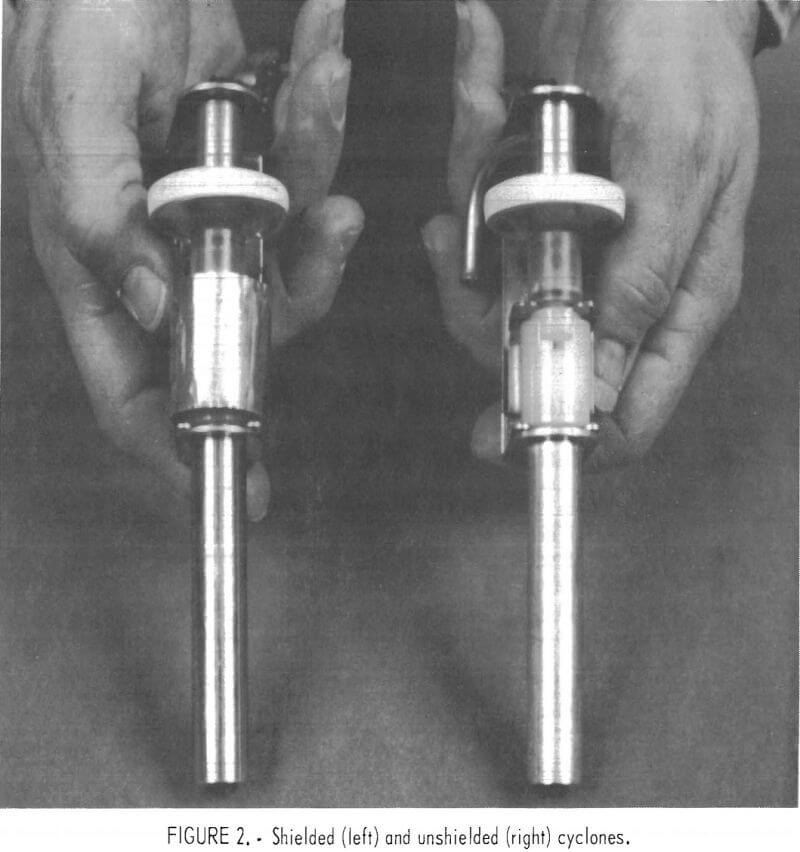
Another test sequence was performed using a shield to reduce the velocity effects on the cyclone inlet (fig. 2). The shield was crudely constructed of a short piece of aluminum bent into an approximately 1.2-in-diam cylinder, which was centered around the cyclone inlet. No attempt was made to optimize the design.
The effect of velocity on cyclone performance was determined by comparing the amount of dust sampled from the same airstream moving at a low and a high velocity. As mentioned earlier, previous tests showed that cyclone sampling performance was not significantly affected by low-velocity airflows (less than 300 ft/min). We therefore compared the sampling performance of the cyclone in high velocity against that of a “reference” cyclone in the low-velocity airflow.
The particle size distributions were measured at each velocity during one particular run. Measurements were taken for approximately 30 min, simultaneously, in the low- and high-velocity sections to determine the size distribution.
Inlet Orientation
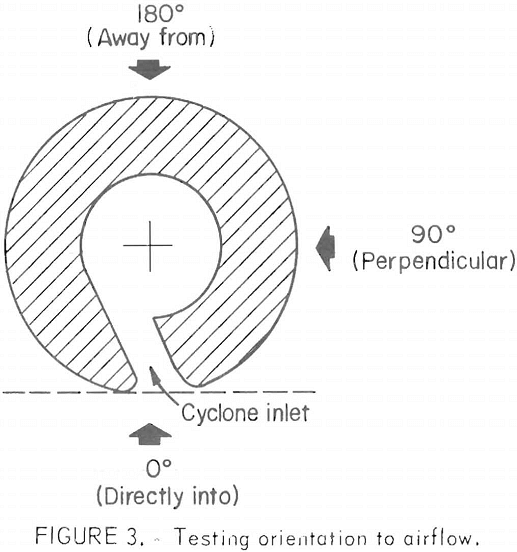
The sampling inlet of the 10-mm cyclone is not perpendicular to the cyclone body, but is tangential to the inside body area. The direction of airflow to the cyclone inlet for our testing can be seen in figure 3.
The movable cyclone was tested in three different orientations: (1) facing directly into the airflow (0°), (2) perpendicular to the airflow (90°), and (3) facing away from the airflow (180°). The reference cyclone always faced directly into the airflow. Three runs were made for each cyclone orientation at each air velocity to ensure repeatability for each test, and the three values were averaged to obtain the effect of a specific orientation at a specific velocity.
The first series of tests evaluated the effects on the normal cyclone (unshielded). At each velocity, the movable cyclone was rotated to the different orientations at 3- to 5-min intervals, and the results were compared to the reference cyclone.
Inlet Shielding
In an effort to reduce the effects of orientation and velocity, the rotated
cyclones were shielded in both the low- and high-velocity sections. The stationary cyclones were unshielded and used for reference. The shielded cyclones were rotated through the different orientations as in the unshielded tests. In interpreting the results, the data from the reference cyclone in the low-velocity section were used as the base line.
Results
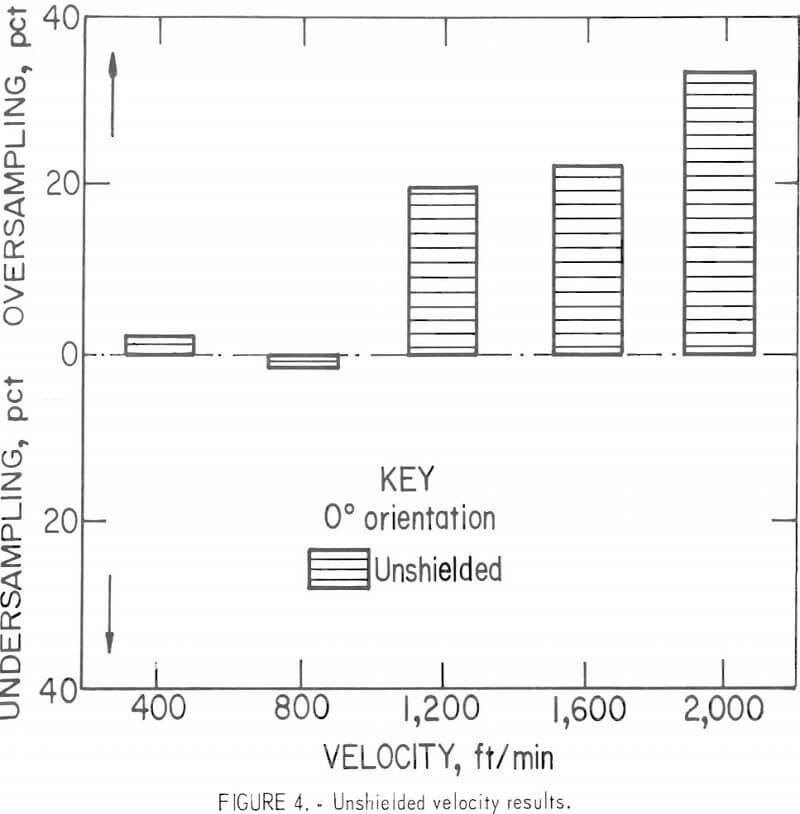
Both velocity and inlet orientation affected the sampling efficiency of the unshielded cyclone. As air velocity increased, the percent sampling error increased relative to the reference cyclone in the low-velocity section. Figure 4 shows the effect of velocity on the sampling efficiency of the cyclone at the 0° orientation. Generally as velocity increased, the amount of oversampling also increased.
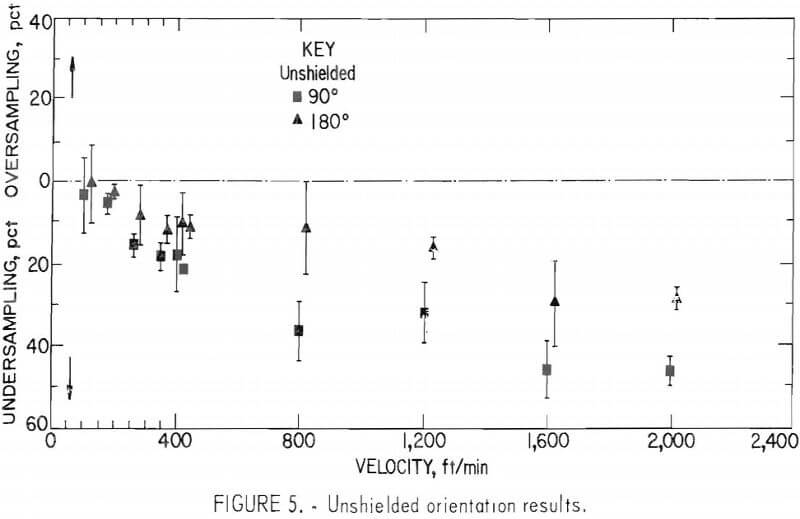
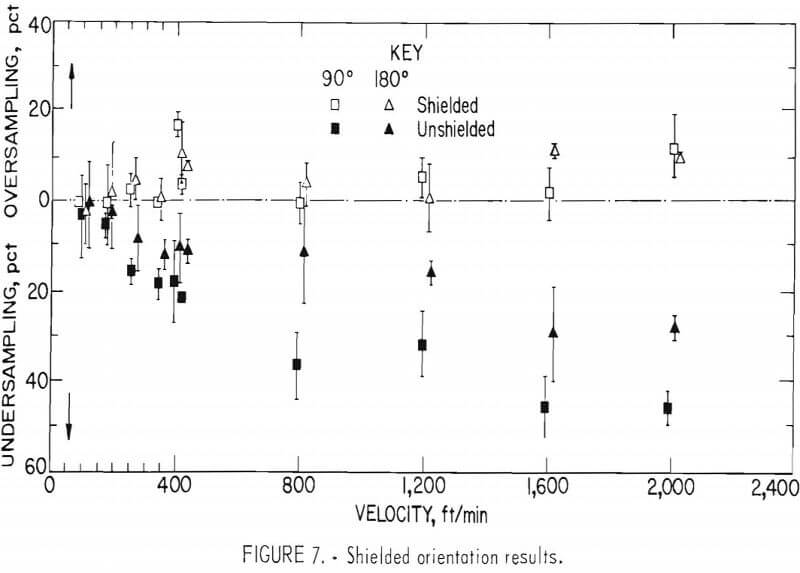
The effect of the cyclone orientation at the different velocities is shown in figure 5. The data for the 90° and 180° cyclone orientations are compared to those of the reference cyclone (0° orientation) for the same velocity. At both the 90° and 180° orientation, trends showed that as velocity increased, the amount of undersampling also increased. The percent of undersampling was consistently greater at the 90° orientation than at the 180° orientation. Error bars show one standard deviation.
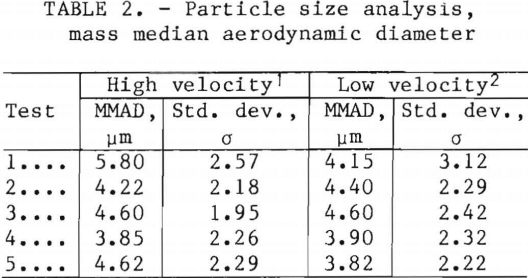
The size distribution of the coal dust did not change when the dust was accelerated through the high-velocity section, nor was there a significant change in the sizes between 400 and 2,000 ft/min. Table 2 gives the mass median aerodynamic diameter (MMAD) and the geometric standard deviation for each velocity.
The effects of velocity and orientation were reduced by shielding the cyclone inlet. Figure 6 shows that the shielded cyclone at the 0° orientation reduced the amount of sampling error at the higher velocities, when compared to the low-velocity reference cyclone. The greatest amount of error recorded was at the
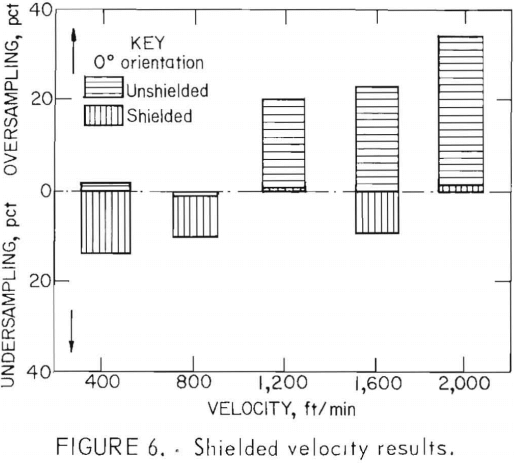
400-ft/min velocity, at which the shielded cyclone undersampled by approximately 14 pct.
The shielded cyclone also reduced the effects of orientation. Figure 7 shows the reduced sampling error from changing the cyclone orientation to 90° and 180° as compared to the reference cyclone (0°) at the same velocity.
Discussion
Theoretical considerations of an isokinetic sampling of aerosols and turbulence pattern effects on inlet sampling would explain the results shown in this preliminary study.
The relationship between sampler inlet velocity and the velocity of air around the sampler can significantly change the mass sampled. Consider the 0° orientation and the effects at the three possible inlet sampling conditions. Figure 8 shows the sampler inlet, the flow volume, and the flow lines around the sampler at the three possible inlet conditions for a blunt-edged orifice. As
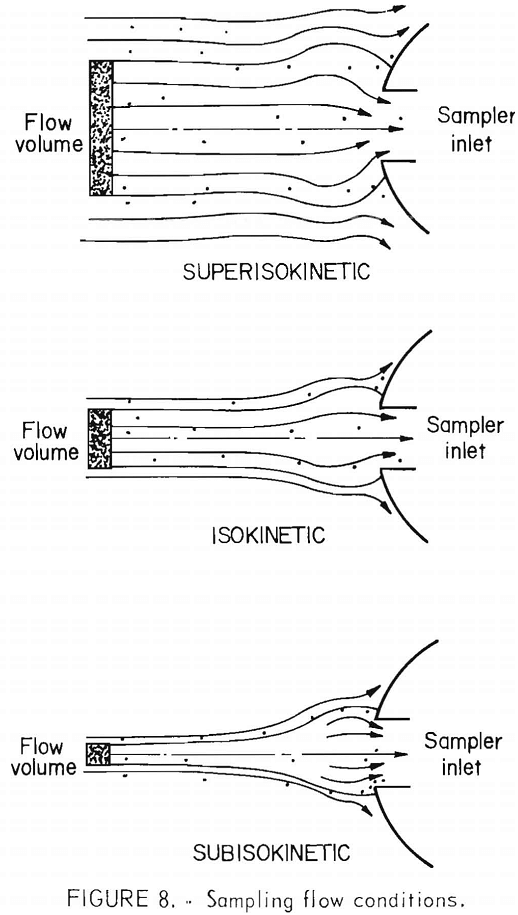
the airstream velocity increases, the flow volume decreases. At one extreme, there is the superisokinetic flow condition, in which some of the large particles are not pulled into the sampler inlet because their inertia carries them across the flow lines; the cyclone thus undersamples. At the other extreme, in the subisokinetic flow condition, some additional particles are captured from outside the flow volume, and the measured dust concentration is higher than the real concentration. The amount of over-sampling should increase with velocity, which was exactly what occurred during laboratory testing at the 0° orientation.
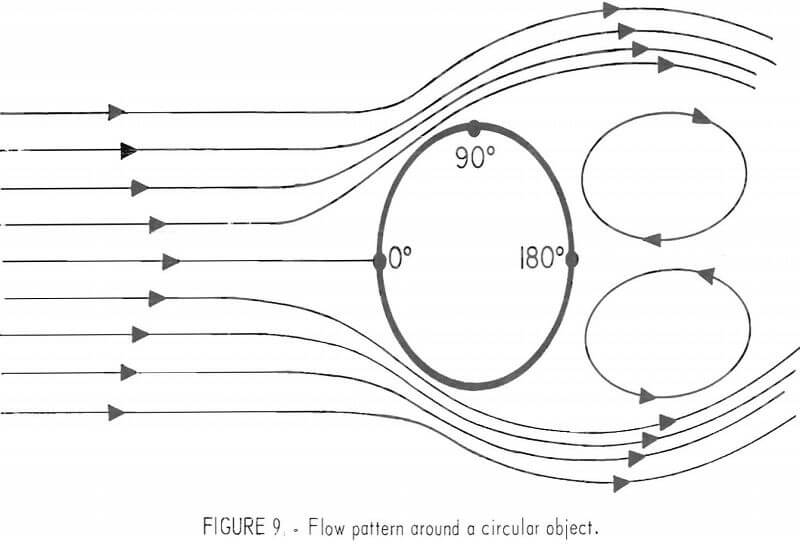
The Institute of Occupational Medicine in the United Kingdom has looked specifically at the flow characteristics around blunt samplers. While the flow patterns can be complicated, the flow lines follow a symmetrical pattern (fig. 9) if averaged out over a long period of time. These flow patterns can help to better understand the results of the tests at the 90° and 180° orientations. In the 90° position, the flow velocity increases as the flow travels around the side of a circular object. A portion of the particles are carried past the inlet due to their inertia. In the 180° position, the inlet is in a turbulent wake of the circular object.
The data show that the largest amount of undersampling occurred at the 90° position since the particle inertia carried particles past the sampler inlet. In the 180° position, results approached the low-velocity values, because the velocity in the turbulent wake was much lower than the actual air velocity and consequently inlet efficiency improved.
Lowering the air velocity at the cyclone inlet would seem to insure that all samples, regardless of orientation, would not be biased due to external effects. When a shield was placed around the cyclone inlet, a turbulent wake was created that substantially lowered the velocity inside the shield. Since sampling was
performed in a relatively quiescent cavity, between the shield and the cyclone, the effects of velocity and orientation were reduced from those of the uninterrupted airstream. The concept of using a shield to lower the velocity around the inlet was explored, but no attempt was made to determine the optimum shield. Further refinements of the inlet shield should minimize bias.
The shield was used to block the direct flow of air and to create a turbulent flow around the cyclone’s inlet, while substantially lowering the velocity in the inner shield region. The flow lines around the outside shell of the shield are similar to those for the normal unshielded cyclone, but inside the shield where the sampler inlet is located, the flow is turbulent in all orientations and at a much lower velocity. The creation of a turbulent region while lowering the airstream velocity was apparently why both the 180° orientation and the shielded results consistently sampled closer to the expected low-velocity value.
It is possible that the sampler, when worn by an individual is somewhat shielded by the individual and therefore would retain some of the accuracy, even at high velocities. This degree of shielding would be dependent on the actual location of the sampler, and the physical size, shape, and clothing of the individual.
Conclusion
The performance of the 10-mm Dorr-Oliver nylon cyclone is affected by high air velocities. The higher the velocity the greater the sampling error with respect to the expected low-velocity value. Also, the higher the velocity, the greater the sampling difference from one cyclone orientation to another.
There are many environments in both underground and surface mining industries where velocities exceed 300 ft/min (3.4 mi/hr). Shielding the cyclone seems to be one way to minimize the affects of high-velocity airflow but more testing needs to be performed with, the shield. The laboratory results did show some general trends, but a more in-depth study is needed.
