Table of Contents
The U.S. Bureau of Mines examined the influence of turbulence on the fine bubble flotation of fine-sized (minus 10 micron) galena in order to improve flotation efficiency. Fine bubble flotation was carried out in a spinning-disk flotation cell and was compared to results obtained from flotation in a conventional cell at equivalent agitation levels. An automated electrochemical technique was used to monitor the turbulent velocity distributions of the fluid within the cell as a function of time and position. The velocity profiles were used to increase the precision of the fine particle, turbulent flotation model. While improved flotation response was obtained with intense agitation, the effect of bubble size was small. These results matched the model’s predicted response for fine particle flotation.
Fine particle beneficiation depends heavily upon froth flotation. Conventional froth flotation is generally very effective for particles between 300 and 20 µm in diameter. For smaller particles, flotation efficiency drops off. Slower flotation kinetics have been used by Nonaka (1982) to explain this inefficiency.
Schulze (1981) and others have expressed the rate of flotation of a single particle as the product of several probabilities:
Pf = Pc x Pa x Ps………………………………………………….(1)
where Pc is the probability of collision, Pa is the probability of attachment, and Ps is the probability of the particle remaining attached to the bubble throughout the flotation process. Pa depends primarily upon the surface
characteristics of the mineral, the degree of collector absorption on the mineral, and the induction time. Induction time decreases with particle size. All other factors being equal, fine particles should float faster due to shorter induction times. However, flotation rate is inversely proportional to particle size (Trahar, 1981). Thus, Pa cannot account for the reduced flotation efficiency of fine particles. Ps has been shown by Woodburn (1971) to be dependent upon particle size. Ps is lowest for coarse size particles and approaches unity for fine size particles. After considering all of the other probabilities and assuming equation 1 correctly describes the process, reduced flotation efficiency must be attributed to Pc.
The probability of collision between a bubble and particle is directly related to the number of collisions per unit time and unit volume. Inoue (1986) has reviewed the hydrodynamic equations for a turbulent flow system, and the following is a summary of his review. The number of bubble-particle collisions (Nc) is
![]()
where Np is the number of particles,
Nb is the number of bubbles,
rp is the particle radius,
rb is the bubble radius,
Up is the velocity of the particle relative to the fluid,
and Ub is the relative velocity of the bubble to the fluid.
Using Kolmogoroff’s theory of isotropic turbulence, the velocities of the bubbles and particles become a function of the dissipation energy within the flotation cell. Bischofberger and Schubert developed the following equation for the bubble and particle relative velocity’s equation

where ε is the dissipation energy per unit mass and time,
v is the kinematic viscosity,
pf is the fluid density, and
Pi is the density of the particle (p) or bubble (b).
The hydrodynamics within the flotation cell determine the dissipation energy of the fluid. Substituting the bubble and particle velocities obtained from equation 3 into equation 2, the number of collisions can be calculated and the probability of collision can be determined. These equations show that fine particles have lower relative velocity and thus a lower collision probability and a slower rate of flotation. Thus, a low probability of collision is responsible for the inefficiency of conventional fine particle flotation. Use of small bubbles in fine particle flotation offers a potential solution to this problem.
Small bubbles, while having a lower relative velocity, offer a number of advantages for fine particle flotation. For example, for a constant volume of air in the cell, as bubble size decreases, the number of bubbles increases dramatically, which in turn raises the number and the collision probability. Furthermore, decreasing bubble size increases the gas hold-up time within the cell and increases the bubble concentration, which leads to an increase in the probability of bubble-particle collision.
Experimental evidence verifies the theoretical advantages of fine bubbles for fine particle flotation. In quiescent systems, Reay and Ratcliff (1975) found that the flotation recovery was proportional to the mean bubble diameter,
db -1.9. The flotation rate is proportional to the product of the recovery, the bubble frequency, and the bubble projected area. These quantities are in turn proportional to db-1.9, db-3, and db², giving a flotation rate approximately proportional to db~3 (Jameson, 1984). Anfruns and Kitchener (1977) found similar results, i.e., that flotation rate varied as db-2-69. Flotation studies in quiescent systems do not, however, represent conventional mechanical flotation systems. Bogdanov et al., (1980) examined the effects of fine bubbles on the flotation of martite and found that, in an agitated system, the flotation rate for fine particles increased with decreasing bubble size. They also found that use of fine bubbles also resulted in an improvement in the flotation rate of sulfide minerals. Ahmed and Jameson (1985) studied the effects of bubble size and agitation level on flotation of latex, quartz and zircon and showed that the rate of fine particle flotation was inversely proportional to bubble diameter. Interestingly, they noted that as agitation increased, flotation rates for the coarser particle sizes decreased while that for smaller particle size fractions increased. This effect did not, however, change the overall trend of increasing flotation rate with decreasing bubble size.
As part of the Bureau of Mines’ research program to maximize the recovery of mineral values during the processing of mined ore, the Bureau conducted research on the importance of turbulence on the flotation response of fine particles when fine bubbles are used. Flotation studies were carried out on a galena/quartz mixture to compare the actual flotation response with the predicted response of flotation theory. Particle size measurements, bubble size measurements, power measurements, and fluid velocity measurements were used to calculate the expected flotation response for a conventional laboratory batch flotation cell and a fine bubble batch flotation cell. Previous researchers have utilized similar measurements to calculate the flotation response, but these researchers only used the mean bubble size, mean power consumption, and mean fluid velocity. In this study the actual bubble size distributions, power consumptions, and fluid velocity profiles were used to provide an accurate mathematical representation of the flotation process.
Flotation Model Development
A mathematical model based upon flotation theory was adapted from several sources in the literature. The full development of the model is given elsewhere (Jordan, 1989). The basic equation is
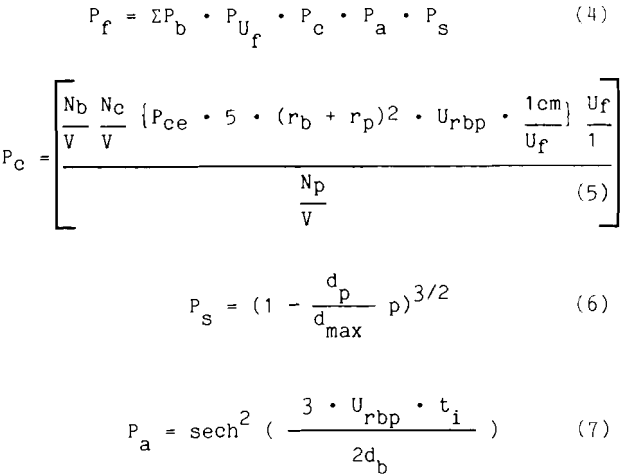
Where Pce · 5 · (rb + rp)² · Urbp · 1cm/Uf is the effective cylindrical volume of pulp that passes by the bubble,
(rb + rp) is the collision radius of the bubble and particle,
Urbp is the relative velocity of the bubble to the particle,
Uf is the turbulent fluid velocity in that unit volume,
1cm/Uf is the residence time that the fluid pulp remains within the cubic centimeter unit volume,
Np/V is the number of particles per unit volume,
Nb/V is the number of bubbles per unit volume,
Uf/1 is the number of unit volumes passing through this position per second,
Pb is the frequency probability for the bubble size,
Puf is the frequency probability of the fluid velocity,
∑ is the summation over all of the possible fluid velocities and possible bubble sizes within the flotation cell,
dp is the particle diameter, and
db is the bubble diameter.
The relative velocity of the bubble to the particle is
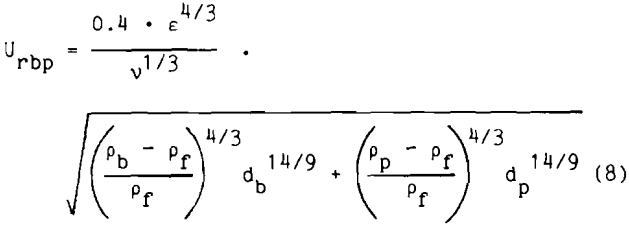
where ε is the mean dissipation energy in the whole flotation cell,
Pf is the density of the fluid,
Pp is the density of the particle,
Pb is the density of the air bubble.
Summing up all of the possible flotation probabilities throughout the flotation cell, the total flotation response could be calculated by sequentially moving through the flotation process at 1-s intervals. The model results closely fit a first order rate equation so that a flotation rate constant was calculated for each particle size fraction. The flotation rate was then calculated according to equation 9.
![]()
where R is the percent recovery of the hydrophobic mineral,
k is the flotation rate, and
t is time.
Minerals and Experimental Procedures
Froth Flotation
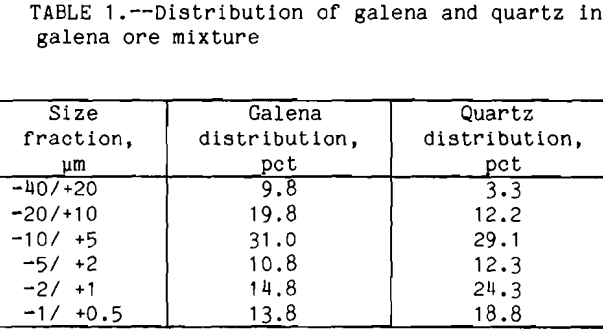
Galena from Brushy Creek, MO, was obtained from Ward’s Natural Science. Traces of anglesite were present in the ore due to surface oxidation. For flotation, an ore mixture of 6 pct galena and 94 pct Ottawa sand was used. In order to study fine particle flotation, it was desirable to grind the ore mixture to minus 40 µm. To achieve this, ore (galena/quartz mixture) was ground in a ball mill at 65 pct solids for 3 h. The result was an ore consisting entirely of minus 40 µm particles. The particle size distribution for galena and quartz in the mixture are shown in table 1.
The ore was conditioned at pH 12.5 for 5 min in a high speed mixer at high solids concentration. The level of conditioner was kept high (1.0 lb/ton) to ensure that all galena particles were hydrophobic (Gaudin, 1957). The slurry was placed in a conventional 500-g Denver DR1 flotation cell and diluted to give a 12.5 pct solids concentration to keep the slurry viscosity low. Dowfroth 400 was added to bring the frother concentration to 25 ppm. The sample was floated for 0.5, 1, 2 or 5 min in order to determine the rate of flotation. Galena was floated at three different impeller speeds, 750, 1,100 and 1,800 rpm, with an air flow rate of 5.0 L/min. During flotation water was added to maintain the froth height. After each flotation test, the tailings were dried and analyzed for lead.
Fine bubble flotation was conducted in a modified 500-g MS flotation cell. A 6-cm-diam by 2-mm-thick disk was used to replace the flotation impeller. Sebba (1985) showed that at high rotation speeds the spinning disk sheared air in the pulp and formed fine-sized bubbles. The cell was also tested at three different impeller speeds, 2,800, 4,450 and 7,000 rpm. The laboratory procedure, reagent levels and air flow rates were identical to those of the conventional flotation method.
Concentrate and Tailings Analyses
Concentrates were analyzed chemically. The typical grade of the concentrate obtained for a majority of the flotation tests was around 21 pct lead. For tailings analysis, a portion of the flotation tailings was split out for size and chemical analysis. A Microtrac particle size analyzer was used to determine the size distribution of the gangue in the tailings. Since the particle size analyzer cannot distinguish between chemically different species, sedimentation based upon Stokes law was used to determine the recovery of galena as a function of particle size. The tails were diluted to about 3 pct solids with tap water. Sodium chromate was used to suppress the natural floatability of galena particles. Tetrasodium pyrophosphate (TSPP) was used to disperse particles and allow free settling. Separations were made at 20, 10, 5, 2, and 1 nm. The samples were settled and siphoned for a minimum of three times at each size fraction to ensure a clean and sharp size separation. After each size separation, the dispersed size fraction was flocculated and dried for chemical analysis.
Bubble Size Measurements
The size distribution of the flotation bubbles was obtained by the following method. A flotation test was conducted without the ore sample but included water, reagents and air. A sample of the bubble slurry was continuously drawn through a small tube to an observation cell under a microscope. A peristaltic pump was used to draw the bubble slurry through a microscope observation stage and return it to the flotation cell. Periodically the pump was stopped and a photograph of the bubble slurry was quickly made through the microscope. These bubble photographs were evaluated with an image analyzer to determine the bubble sizes and the frequency distribution of each size bubble. During each test, the air content of the bubble slurry was measured.
Velocity Measurements
An electrochemical technique (Jordan, 1989) was used to measure the velocity profile within the flotation cell. The technique is described in an earlier publication (Jordan, 1989). Fluid velocities were measured at 1-cm intervals horizontally and vertically through each flotation cell.
Power Measurements
The dissipation energy within the flotation cells was measured by linking an Eaton Lebow torque meter to the impeller shaft. To account for the bearing friction, the power consumption of the impeller spinning freely in air was subtracted from the flotation pulp power measurements. Dividing the power consumption by the volume of the flotation cell produced the mean dissipation energy, ε.
Results and Discussion
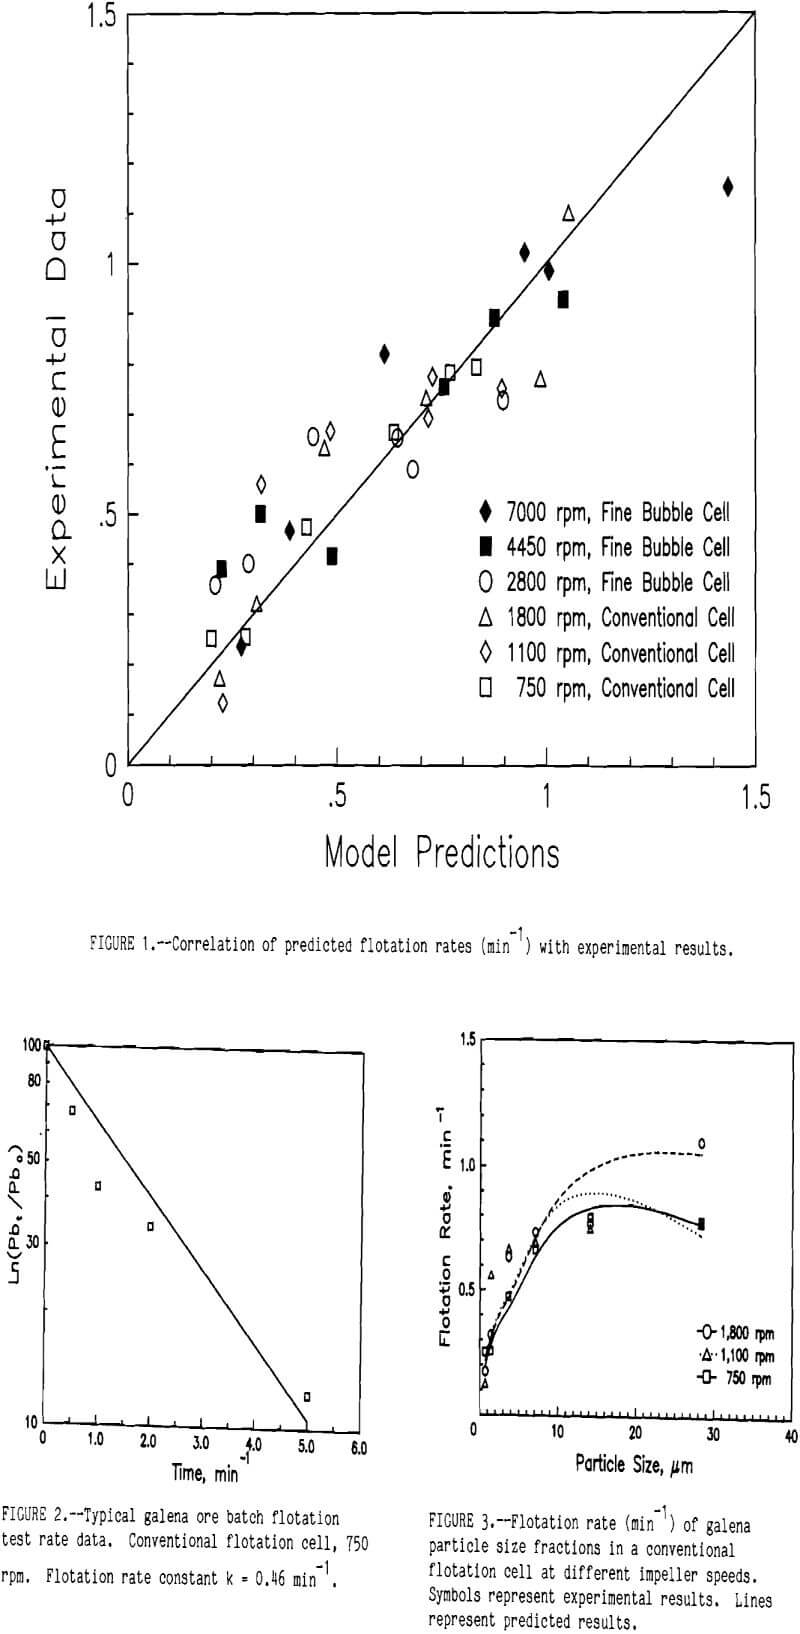
Experimentally determined flotation rate data correlated well with model results. Figure 1 compares experimental rates with predicted values. While there is some scatter (mean square error = 0.0168), the data points tend to fall along the 45° line, indicating good correlation.
For a given set of flotation conditions (same cell type, bubble size, agitation rate, etc.), flotation rate varied as a function of particle size. This might be inferred from an examination of the batch rate data for a typical galena ore flotation test (fig. 2). While a first-order plot fits the data well (r2 > 0.95), there is obviously some curvature to the data. This indicates that something more complex than a simple first order reaction is taking place. One explanation for this is that the batch flotation rate represents a composite of the flotation rates of the different size fractions. The flotation rate of the larger size fractions, which float more rapidly, predominate early in the flotation test. As the larger size fractions are removed, the rates of the smaller, slower floating fractions predominate, slowing the batch flotation rate.
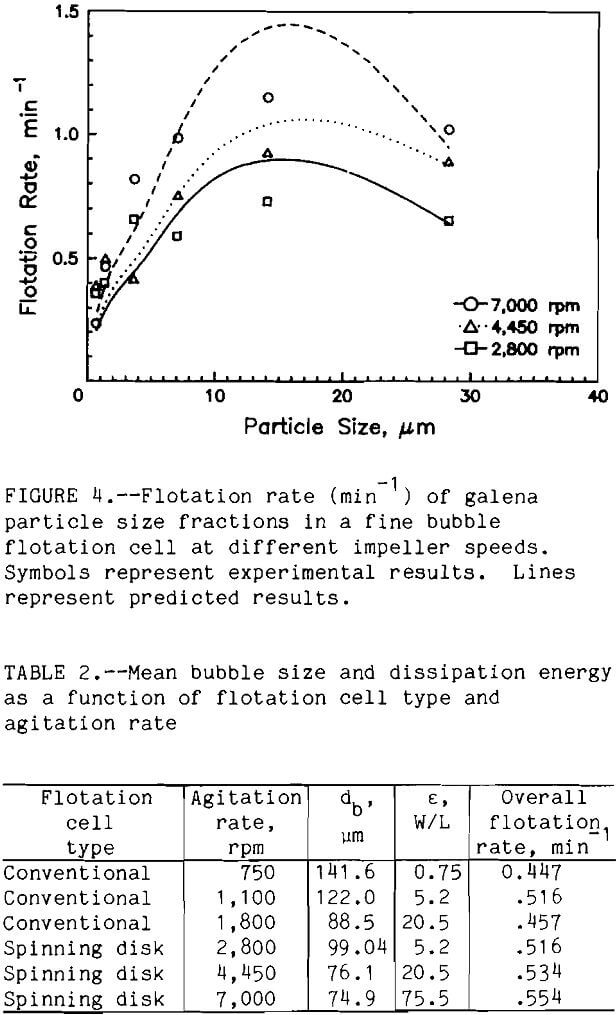
This hypothesis was confirmed by plotting flotation rate as a function of particle size. Flotation rate in the conventional cell as a function of particle size is shown in figure 3; the results for the spinning disk cell are shown in figure 4. The lines in figures 3 and 4 represent the model predictions. Flotation rate increased approximately logarithmically with particle size up to 40 µm, the largest particle size studied in this investigation. Trahar reported a similar trend for 60-s galena flotation tests (Jowett, 1980). The increase in flotation rate with increasing particle size has been shown for other sulfide minerals as well (Jordan, 1989).
The dependence of flotation rate upon particle size can be understood by examining some of the hydrodynamic considerations. First, as the dp increases, the number of bubble-particle collisions increases (equation 2). Nc is directly related to the probability of collision Pc, which is in turn related to the probability of flotation. Second, the efficiency of collection Ec of a single bubble is related to particle size (Dobby and Finch, 1987). Reay and Ratcliff showed that the flotation rate is directly related to Ec, which in turn is proportional to dpn, where n = 2. Thus, flotation hydrodynamics indicate an increase in flotation with particle size.
The effect of hydrodynamic factors such as turbulence (dissipation energy) is shown in table 2. The data shows as the dissipation energy is increased, the bubble size decreases for both the conventional and spinning disk cell. The low flotation rate for the test run at 1,800 rpm in
the conventional cell is an anomaly. It is believed to be experimental error rather than a real phenomenon. The overall flotation rate increased as the dissipation energy increased.
The effects of bubble size on flotation rate can be determined by comparing conventional and spinning disk cells at equal dissipation energy (ε). For an equal value of ε, the spinning disk cell produced smaller bubbles than the conventional cell, but the difference was small. For ε equal to 5.2 W/L, the difference in db was 23 µm and for 20.5 W/L the difference was 13 µm. At the 95-pct confidence level, the effect of bubble size on flotation rate is statistically insignificant for both the experimental data and the predicted results. The lack of significant improvement in flotation rate is probably due to the fact that at a given ε, the difference in the size of the bubbles produced by the flotation machines is relatively small. While db changes somewhat, the bubble size distributions at a given ε show significant overlap between the fine bubble and conventional flotation cell.
Increasing agitation rate not only decreased the bubble size, but increased ε. Within experimental error, decreased bubble size had only a slight effect on flotation rate. This indicates that the increase in dissipation energy is primarily responsible for the higher flotation rates. Since the effect of bubble size on flotation rate was small, flotation tests in the fine bubble and conventional cells at identical dissipation energy were assumed to be essentially duplicate tests. Using this assumption, a plot of flotation rate versus particle size at various values of dissipation energy (fig. 5) shows the significance of dissipation energy. The lines on figure 5 represent model predictions. Dissipation energy is a measure of the turbulence within the
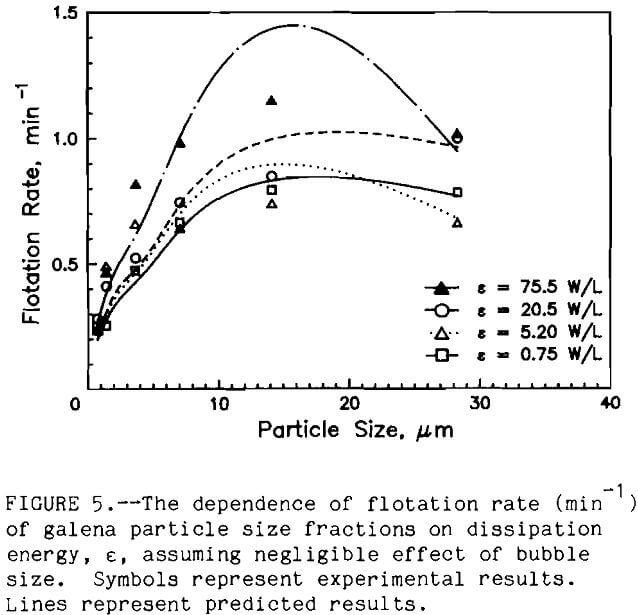
flotation cell. As agitation rate increases the turbulence within the flotation cell increases, and consequently so does the flotation rate. From equation 4, Up and Ub are proportional to ε.
As Up and Ub increase, the number of bubble-particle collisions increases (equation 3), raising the probability of collision and therefore the flotation rate. It should be noted that for this series of experiments, the bubble sizes fall within a small range. If a larger range were used, the turbulence together with bubble size would affect the flotation rate (Jordan, 1989).
Conclusions
In the flotation of fine (minus 10 µm) galena particles, particle size and turbulence are major factors. Within the size range studied (142 – 75 µm), bubble size was only a minor factor. As particle size increases, the efficiency of collision and number of collisions increases, leading to an increase in flotation rate. Turbulence increases the velocities of bubbles and particles relative to the fluid. This in turn leads to an increase in the number of collisions, and consequently the probabilities of collision and flotation increase. Turbulence and bubble size are inversely related through dissipation energy. A hundred-fold increase in dissipation energy caused only a two-fold decrease in bubble size. Thus, the effect of turbulence on the probability of collision was much greater than the effect of bubble size in the size range studied. However, a flotation model incorporating bubble size predicted experimental results well.
