The BSA and DRC models have been shown to offer excellent alternatives to the NDRC model, given previously in the literature (1) in predicting the dynamics of glass bead flotation. Since the TP model converged to unrealistic parameter values and gave the poorest data fit, the TP model is judged unacceptable for predicting continuous mechanical, flotation cell dynamics, at least for this system under these test conditions.
Although the DRC model did not fit the data quite as well as the BSA model, this experiment should not be judged the best test of the model, since the glass beads were all of very nearly identical size and shape and must have had quite similar flotation properties. Thus only a small variation in floatability between particles was expected. In practice the floatable mineral particles would have a much wider range of floatabilities, and the DRC model should have much greater ability with such systems.
Essentially perfect mixing of liquid phase was shown to exist in this cell. The solid phase was slightly less well mixed, but the mixing was good enough for models based on perfect mixing to apply. It has been demonstrated, however, that perfect mixing in the liquid phase does not guarantee perfect mixing in the solid phase and that, in general, tracer tests on the liquid (which are relatively easy to perform) cannot be used to ascertain the mixing behavior of solid particles in the pulp.
The models presented here should be further tested in industrial applications before final judgement is passed on them since their adequacy in describing industrial processes is, in the final analysis, the measure of their value. More work should be done in the area of prediction of flotation cell hydrodynamics and on the application of dynamic flotation cell modeling to cases where non-ideal solids mixing due to sedimentation and inertia effects is important. Simple, accurate methods of continuous, real time monitoring of floatable mineral concentrations in liquid suspension should be perfected. Finally, models which predict the flotation cell dynamic response to other changes in operating conditions such as aeration rate and impeller rpm should be developed.
Dynamic Mathematical Models
In the models to be presented shortly, the rate of transfer of floatable mineral from the pulp is assumed to be analogous to that of a first-order chemical reaction. Several authors have found this represented their flotation data well, although a few have found orders, n, other than one. The general rate expression of order n may be written as:

Where r is the rate of disappearance of floatable mineral by flotation, C0 is the concentration of floatable mineral in the pulp, k is the flotation rate constant, n is the “reaction” order, and t is flotation time.
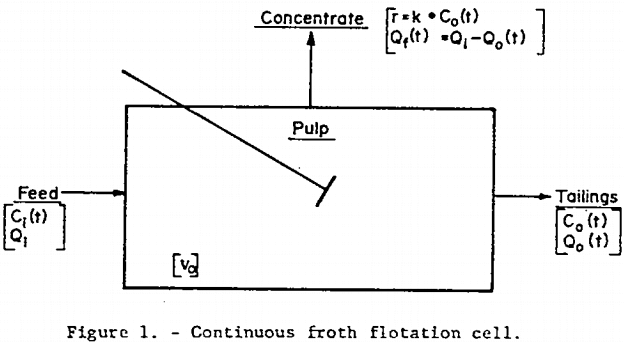
Non-Distributed Rate Constant (NDRC) Model: An unsteady-state material balance on a floatable mineral having a single-valued rate constant, k, in the pulp, of volume Vo, of a flotation cell with feed rate Qi and tailings discharge rate Qo (see figure 1) leads to the transfer function presented by Niemi (1.)

Where s is a complex variable of the Laplace transform of a function of t and Ci is the time-dependent concentration of floatable mineral in the feed.
Distributed Rate Constant (DRC) Model: Since the flotation rate constant depends, in a complex way, on the properties of the floatable mineral and on the environment within the flotation cell, several investigators have suggested that each mineral particle in the feed has associated with it a distinct flotation rate constant, k. It is therefore reasonable to expect that there is a unique distribution, ψ(k), of rate constants associated with the floatable mineral in the feed to a given flotation cell under a given set of operating conditions. Sadler and Landis have shown that simultaneous solution of an overall material balance and a material balance on the fraction of floatable particles with rate constants between k and k+dk lead to the transfer function for the distributed rate constant model.

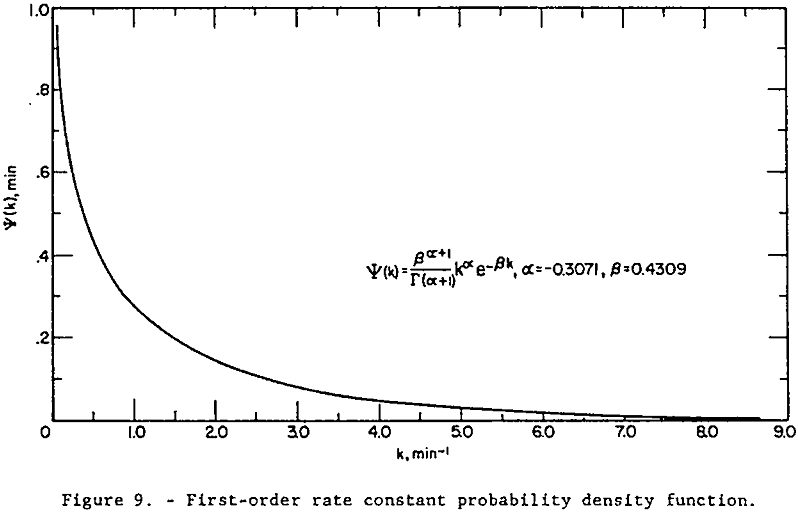
The physico-chemical interactions involved in the froth flotation process are presently too poorly understood to permit a priori prediction of the true form of ψ(k) from measured mineral and cell operating parameters. However, several authors have suggested a modified gamma distribution for representing ψ(k).
![]()

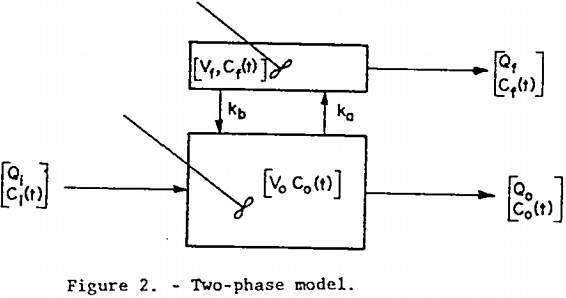
Two Phase (TP) Model: The differential equations originally postulated by Arbiter and Harris serve as a starting point for the derivation of the floatable mineral concentration transfer function for the TP model shown in figure 2. This model allows for a two-way exchange of floatable mineral between perfectly mixed pulp and froth phases, the rates of exchange being first order in floatable mineral concentration in each of the respective phases. As in the previous two models all volumetric flow rates and volumes are assumed constant, as are ka and kb. Unsteady-state material balances on the froth and pulp phases result in the following Laplace transformed equations:

Simultaneous solution of equations 5 and 6 yields the desired transfer function:

where H = Qi Vf
B = Qi (Vfkb + Qf)
D = V0Vf
E = kaV0Vf + QoVf + kbVfV0 + QfV0
F = kbVfkaV0 + kbVfQo + QfkaV0 + QfQo – kavo²kb
Bubble Surface Area (BSA) Model: A practical difficulty is likely to arise in using equation 7. It is assumed that the froth flow rate, Qf, and froth volume, Vf, are constant and measurable, but this is often not the case in practice because of the irregular and surging nature of the froth flow. In addition, since Vf is defined as the airless froth volume while the froth exists as a mass of air-filled bubbles whose size varies with time and position in the froth, it is quite difficult to obtain an experimental value for both of the “constants” Qf and Vf.
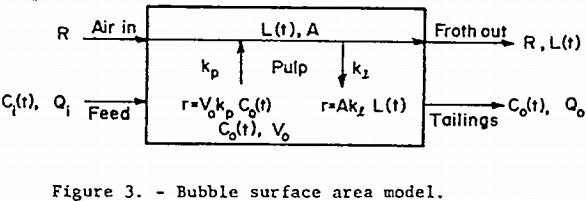
The bubble surface area model is a model, shown in figure 3, which avoids most of these difficulties, but still allows for a two-way exchange of floatable mineral between phases. Picture the continuous well-mixed mechanical cell as always having a constant amount of bubble surface area, A, available in the pulp for bubble-particle interaction. Also assume that fresh surface area in the form of bubble surface is continuously being introduced at a constant rate R. Furthermore, assume that the rate of floatable mineral mass transfer from pulp to bubble surface is first-order in floatable mineral concentration with non-distributed rate constant kp. Also assume that, within the pulp, all the floatable mineral that is attached to bubble surface at time t is distributed evenly over all the available bubble surface at a loading density L. Let the rate of return to the pulp from the bubble surface of attached mineral particles be first order in loading density with rate constant kp. Assume that once a mineral-laden bubble reaches the froth layer above the pulp, no floatable mineral particles return to the pulp. Figure 3 shows the important quantities involved. The assumption of constant A and R is often justified since the effect of a change in floatable mineral concentration on aeration rate and bubble residence time is small for light bubble loadings. Due to the extreme turbulence in the pulp, it is easy for particles to be stripped from the submerged bubble surfaces to which they are attached, but once the mineral-laden bubbles join the relatively quiescent froth above the pulp, there is less of a tendency for them to become detached and return to the pulp.
An unsteady-state floatable mineral balance on the pulp yields

A balance on the bubble surface gives

Writing equations 8 and 9 in deviation form and taking the Laplace transform of each gives

Simultaneous solution of equations 10 and 11 yield the desired transfer function.

Transportation Lag: In most process flow systems there is a finite time lag between the onset of a change in process conditions and the detection of the process response to the change. Although it is not absolutely necessary to do so, this transportation lag was removed from the stimulus-response data before any model-to-data fits were made, as suggested by Clements and Schnelle. Should the experimental process transfer function be used in control system design, the effect of time delay can be re-introduced by writing the process transfer function as G(s)·exp(-Ts).
Experimental Features and Preliminary Results
Two types of continuous tests were run to provide data for model testing. First the cell response to a simultaneous step change in sodium chloride tracer and glass bead feed concentration (no flotation reagent present) was measured in order to establish whether or not the solid phase was well-mixed. Then the cell response, under conditions of flotation (flotation reagent present), to a square pulse change in glass bead feed concentration was measured. This second set of data was used in fitting the flotation models previously presented.
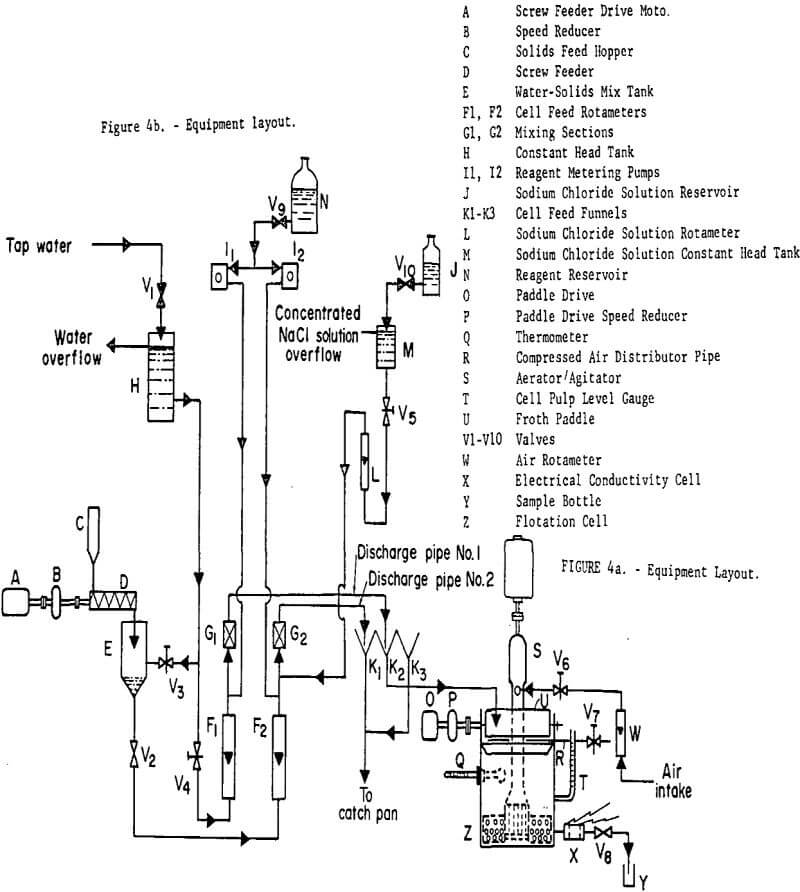
The glass beads were Cataphote Corporation type MS-L (minus 200 plus 325 U.S. Sieve), and Armour Armac T was used as frother collector. The flotation cell was a rotor-stator type of approximately 6000 cc volume. The rotor was operated at 2300 rpm and the double bladed froth scraper at 38 rpm. Compressed air, emitted from a distributor positioned just above the liquid level at the back of the cell assured even flow of froth to the front of the cell from all regions of the pulp surface. The rear of the cell was made from clear plastic so that the pulp could be observed during cell operation. Details of the equipment layout are shown in figure 4. Disturbances in feed concentration were generated by manipulation of discharge pipes 1 and 2 above feed funnels 1, 2, and 3. Solids concentration in the tailings was determined by analysis of grab samples (of 2 sec duration) taken downstream of valve 8. NaCl tracer concentration (NaCl was used only during mixing tests) was continuously monitored using a conductivity cell and a transducer of the types described by Clements and Libbers. The transducer output was recorded by a strip chart recorder and was found to be linear over the range 0 to 1000mv. Tests also showed that the monitor output was unaffected by changes in glass bead concentration at concentrations less than 1 g’cc. The rotameters shown in figure 4 were used merely to detect possible changes in flow rates since all flow rates were actually measured by catching timed samples in graduated cylinders. A much more detailed description of the equipment and procedures may be found in the work of Sadler.
Solids concentration was determined gravimetrically using a sensitive laboratory balance.
Mixing Tests: With V9 closed and the aerator/agitator, S, in operation, the water, bead, and NaCl solution flow rates were brought to steady-state at the desired values. (Volumetric flow rates from discharge pipes 1 and 2 were adjusted so that they were identical). Then discharge pipes 1 and 2 were quickly transferred from funnels k1 and k2 to k2 and k3 respectively. The bead concentration and electrical conductivity of the tailings stream were monitored until steady-state was attained. The measured operating conditions for this test were as follows:
Total volumetric feed rate: 1265 cc’min.
Volume of cell contents: 5615 cc.
Cell temperature: 24.26° C (start test), 24.28° C (end test).
Air rate: 240 cc/min.
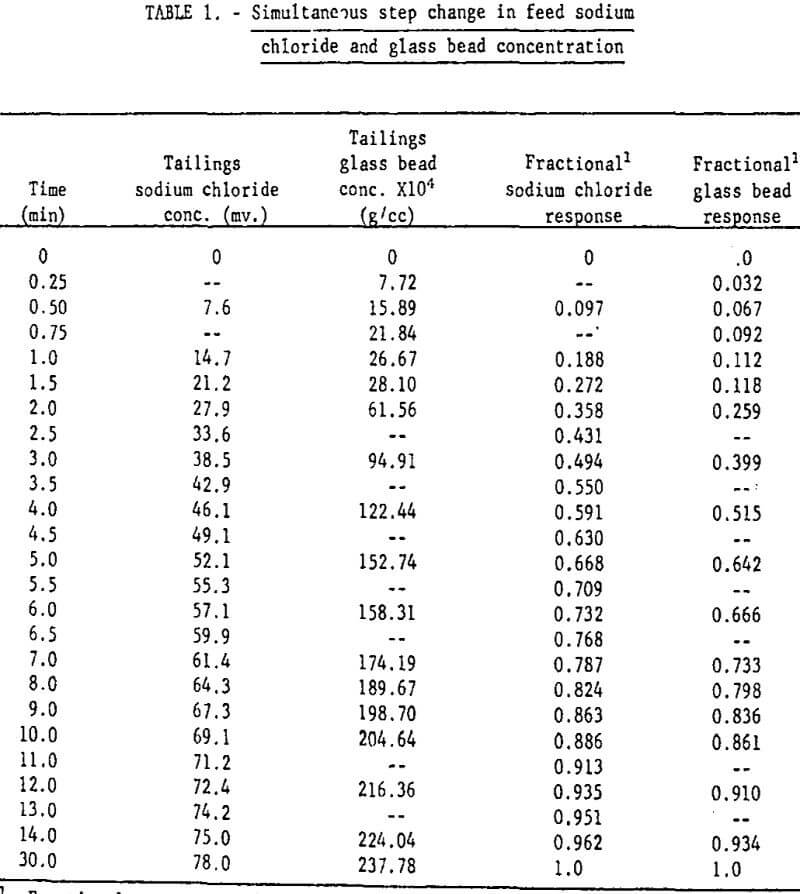
Magnitude of step increase in feed sodium chloride concentration: 78.0 mv.
Size of step increase in feed glass bead concentration: 237.78 x 10 -4 g/cc.
Table 1 gives the results of the mixing characteristics test.
Flotation Tests: Preliminary qualitative batch tests carried out in a small laboratory cell, indicated the following:
- Increasing the conditioning time to greater than about 1 sec. had no effect on glass bead recovery or flotation rate.
- The water-solids ratio had no noticeable effect on conditioning time.
- A change in-pulp pH of 0.2 to 0.3 pH units in the pit range of 8.5 to 9.5 had no noticeable effect on recovery or froth consistency.
- Temperature changes of less than a degree had negligible effect on flotation rate or recovery.
- Addition of flotation reagent to water resulted in only very small changes in water pH.
- Less than 0.1 percent of an initial charge of glass beads remains un-floated after a 20 minute period of flotation.
- For reagent levels greater than 1.0 pound of Armac T per ton of glass beads, no effect of changing reagent level (within ± 80%) on flotation rate or recovery was noticed. Some small effect on froth density was evident.
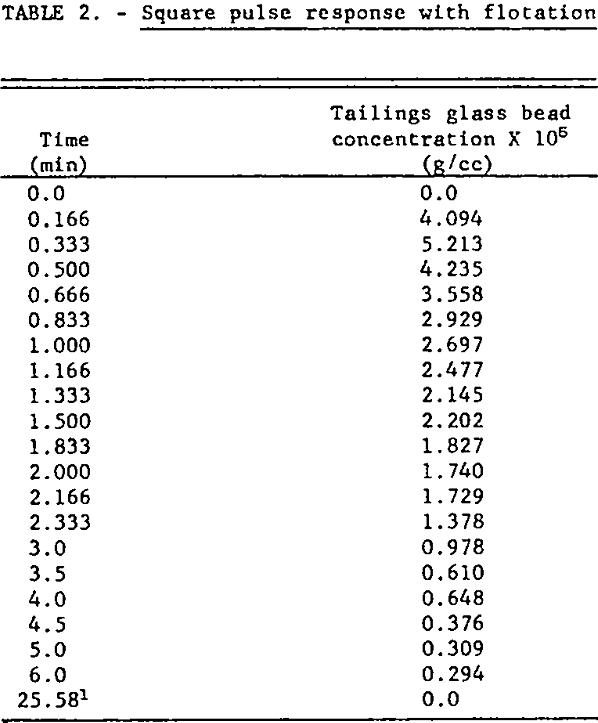
For the continuous flotation test V8 was closed, V9 was opened and reagent pumps I1 and I2 were started. When all flows and the pulp level in the flotation cell, Z, had reached steady-state and volumetric flow rates and reagent concentrations in the discharge pipes were identical, a square pulse increase in feed glass bead concentration of 10 seconds duration was generated by manipulation of the feed discharge pipes: i.e., the glass bead concentration in the feed was changed almost instantaneously from zero to 0.0226 g/cc, held at this level for 10 seconds, and then abruptly reduced to zero. Tailings grab samples were taken at timed intervals for six minutes following the input disturbance. The operating conditions for this test were:
Total volumetric feed rate: 1290 cc/min.
Volume of cell contents: 5755 cc.
Total volumetric tailings flow rate: 1250 cc/min.
Air rate: 235.0 cc/min.
Cell temperature: 24.13° C
Rate of addition of 0.15 weight percent Armac T solution: 18.6 cc/min (each discharge pipe).
Magnitude of square pulse increase in feed glass bead concentration: 226.51 x 10 -4 g/cc.
Pulse duration: 10 sec.
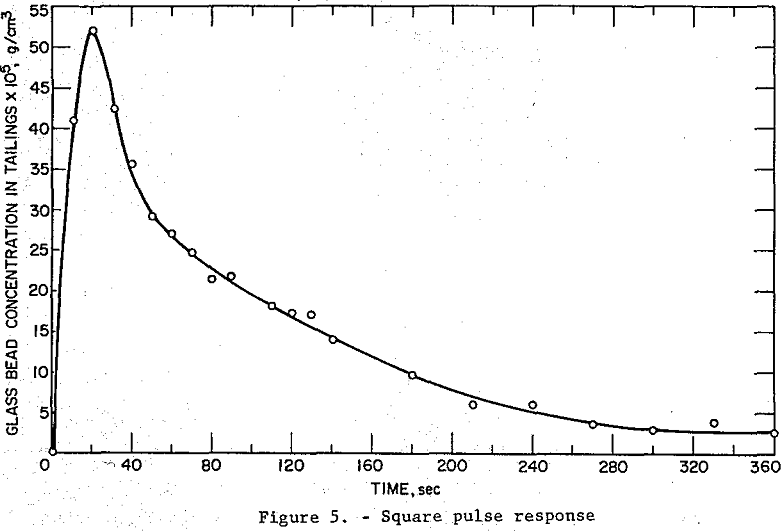
The Armac T-to-glass bead ratio for this test is calculated as 1.91 lb/ton. The experimental time response data are listed in table 2 and plotted in figure 5. The change in tailings flow rate was small since there was only a small amount of solids to be floated because of the short pulse duration.
Bubble Surface Area and Rate of Introduction: The procedure for determining the number and size distribution of bubbles present under the same cell conditions as those in the square pulse test will now be described.
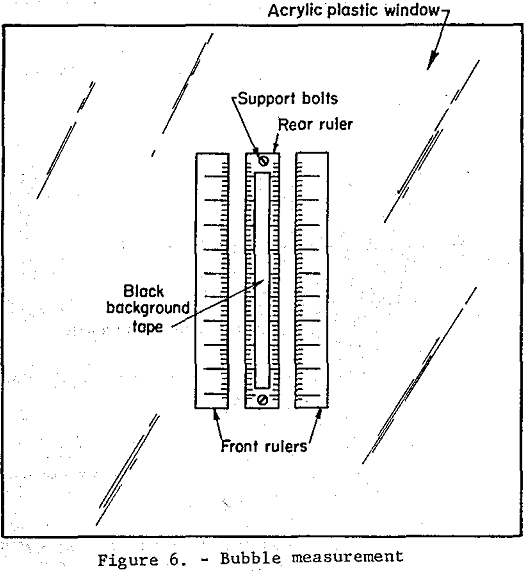
Two clear plastic millimeter rulers were taped 3.0 cm apart to the inside of the clear plastic face of the flotation cell as shown in figure 6. A third millimeter ruler was held in place between the first two rulers 5.0 cm away from the inside of the plastic face by two 1/8-inch machine screws. A strip of black plastic electrical tape 2.0 cm wide was placed on the front of the back ruler. The flotation cell conditions existing in the square pulse test were duplicated except that no beads were introduced, since they tended to cloud the liquid. Nine high-speed photographs were taken in succession, over a 5 minute period, of the area shown in figure 6 using a tripod mounted 55 mm focal length camera with a 1/1000 sec electronic flash. Developed negatives were studied using a polarizing microscope with built-in light source and mechanical stage, 6x objective and a 6x micrometer eyepiece. A 3 cm vertical section in the center of the rulers directly in front of the black tape background was selected for study. The diameters of all bubbles in this area on all nine negatives were measured using the micrometer scale.
Measurement errors due to parallax were shown to be less than 2.5 percent by measurement, in micrometer scale divisions, of the distance between scale division on the front and rear rulers.
The number and mean diameter of the bubbles in the region photographed slightly differed in each of the nine photographs taken. This was due to the surging nature of flow patterns in the cell. However, neither figure differed from the overall arithmetic average for any of the nine photographs by more than 20 percent. The actual bubble diameters ranged between 0.1 and 1.5 mm.
Bubble diameters measured in all nine photographs were used to determine the bubble size distribution. The average number of bubbles counted in the 30 cm³ volume under study in the nine photographs was used to estimate the total number of bubbles present in the cell at one time. From the size distribution, total number of bubbles, and the measured rate of air introduction, it was possible to estimate the rate of introduction of new bubble surface area, R, as 50,900 cm²/min and the holdup of bubble surface, A, as 7000 cm².
Time Delay: Sodium chloride tracer injection tests using the electrical conductivity cell with the stripchart recorder set on its most sensitive setting indicated that the time delay for the flame conditions as existed in both tests was less than 0.018 minutes and thus was negligible.
Results
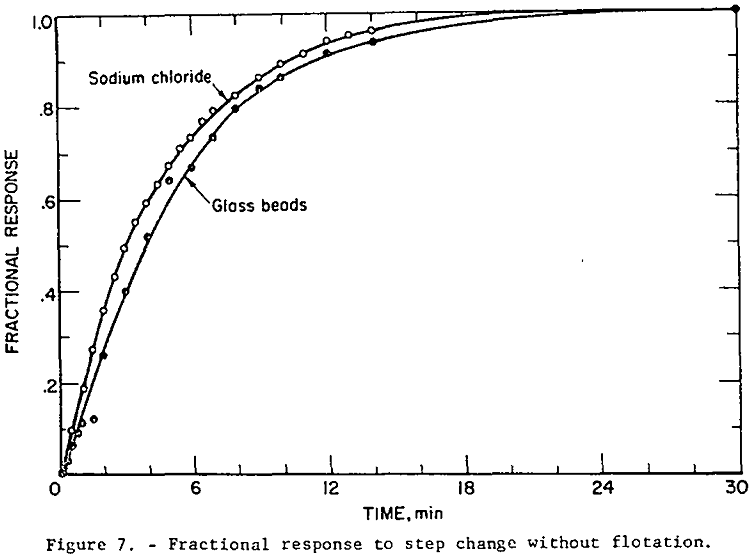
Mixing Test: Several authors including Coughanowr and Koppel present the equation relating the fractional time response (F.R.) of the outlet tracer concentration of a perfectly mixed tank to a step change in inlet concentration.
F.R. = 1 – exp (-Q/V t)…………………………………………………………(13)
The fractional response of the liquid (as determined by the NaCl tracer test) and of the solid phases given in table 1 are plotted in figure 7. The sodium chloride tracer data and the fractional response for a perfectly mixed tank (equation 13) are essentially identical, indicating perfect mixing of the liquid. The glass bead data fall close enough to the perfect mixing condition so that flotation models based on this condition are valid. The glass bead step response is slightly more “sluggish” than the liquid response as indicated by this curve’s position below the liquid curve. The mixing test results are thus generally in agreement with Jowett and Arbiter, et al.
Frequency Domain Fitting of the Square Pulse Response: In testing dynamic mathematical models when a simple mathematical equation for the forcing disturbance is not available and or when the predicted time response is not easily obtainable because of the form of the transfer function, it is often more convenient to perform the model to data fit in the frequency rather than the time domain. The TP, DRC, and BSA models (transfer functions) are sufficiently complex to warrant frequency domain fitting. A computer program written in FORTRAN for the IBM 360 by Clements was used to perform the fits. As Clements demonstrates, Parseval’s theorem guarantees that simultaneous fitting of the real and imaginary parts of the frequency response in the frequency domain gives results identically equivalent to a time domain fit.
The program function coding for all but the DRC model was straight-forward. When the gamma function, given by equation 4, is substituted for γ(k) in equation 3 we have:

Since the integral in the numerator cannot be evaluated in closed form (as appears to be the case for other “convenient” probability density functions which could be chosen for ψ(k)) numerical approximation is indicated. Thus provision was made in the fitting program for the numerical integration to be performed automatically at each frequency considered. The integrand in equation 14 was broken into real and imaginary parts by rationalizing the integrand denominator. This representation of equation 14 was coded into the program and numerical integration using Simpson’s Rule was applied separately to each part at each frequency. Small increments in k were used, and the integration was carried out until the size of further segments became negligibly small.
The frequency spectrum to which the models were fitted was truncated at ω = 12.0 min-¹, well before the frequency content of the input pulse or G(jω) reached its first zero.
Mathematical models represented by transfer functions given in equations 2, 7, 12, and 14 were fitted to the experimental square pulse disturbance data of table 2 using the frequency response technique just discussed. Values for A and R were given earlier. Table 3 gives the “best” values for the adjustable parameters, the standard error of estimate (S.E.), and multiple correlation coefficient (M.C.C.).
The new model based on the amount of available bubble surface area correlated the data well and also had the lowest standard error of estimate. The next best data fit was given by the distributed DRC model, equation 14. The NDRC model, equation 2, gave the third lowest S.E. while the TP model gave the poorest fit. In order to force parameter convergence it was necessary to set Qf equal to the difference Qo and Qi and allow Vf to become an adjustable parameter.
The fitting program invariably converged to a negative value for Vf in equation 7-a situation which is clearly physically impossible.
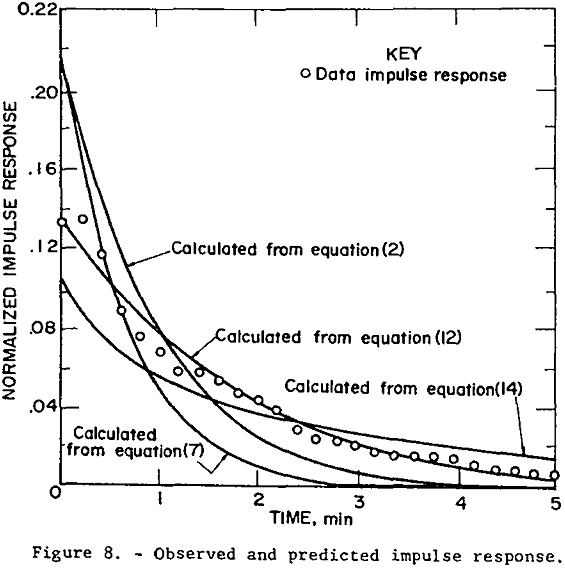
The new models given by equations 12 and 14 were thus shown to be superior to existing models in correlating this set of experimental data. Equation 2 is also judged to be acceptable, but the two-phase non-distributed rate constants model given by equation 7 is not.
The normalized impulse responses calculated by numerical inversion of the observed and predicted frequency response is plotted in figure 8. The predicted impulse response was calculated by numerical inversion of the indicated transfer functions with parameter values given in table 3. The inversion routine, another feature in the computer program by Clements, was used.
The probability density function, ψ(k), for the first-order flotation rate constants for the glass beads in the feed is plotted in figure 9. The converged values of a and g given in table 3 were used.
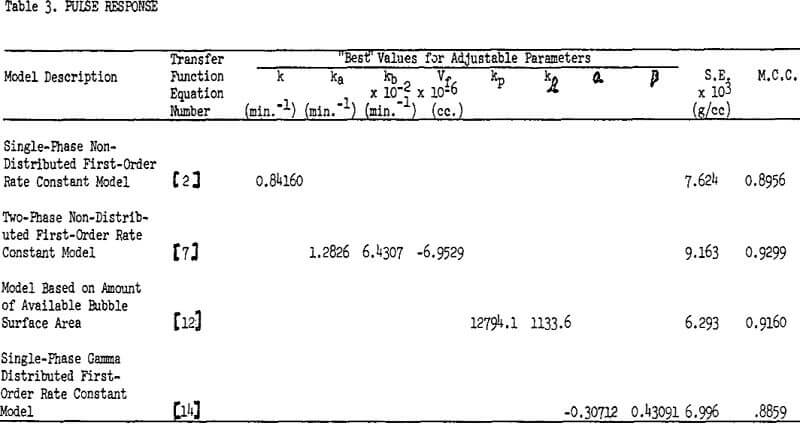
A perfect correlation between model and data would be indicated by an M.C.C. of 1. No correlation results in an M.C.C. of 0. The reader may consult almost any applied statistics textbook for more information on the standard error of estimate and multiple correlation.
