Table of Contents
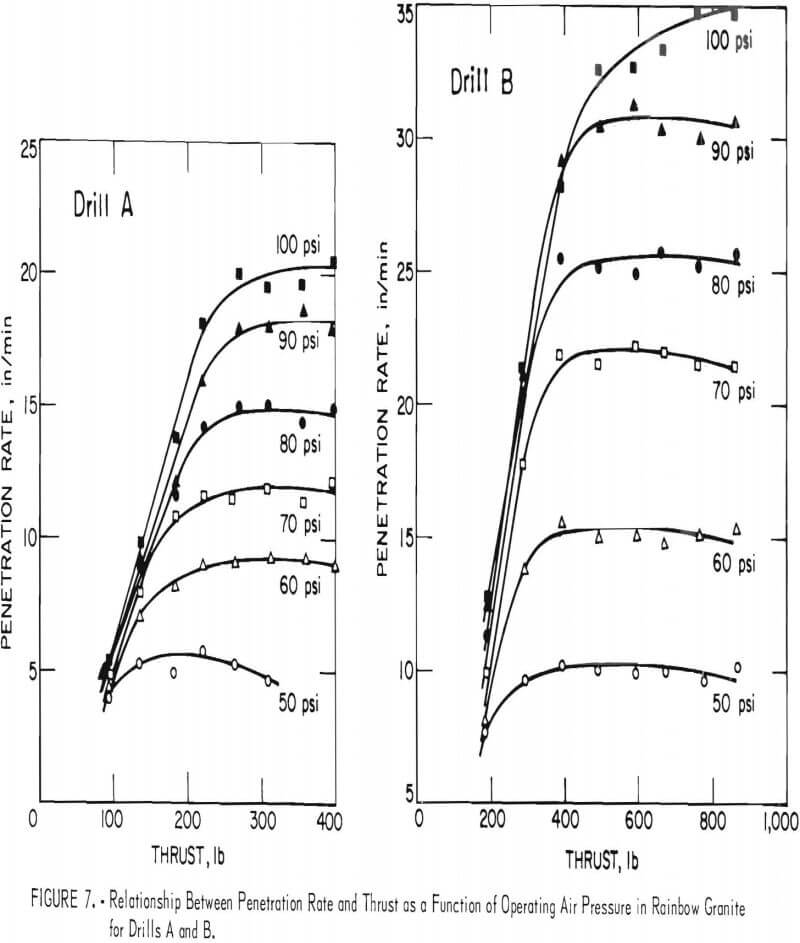
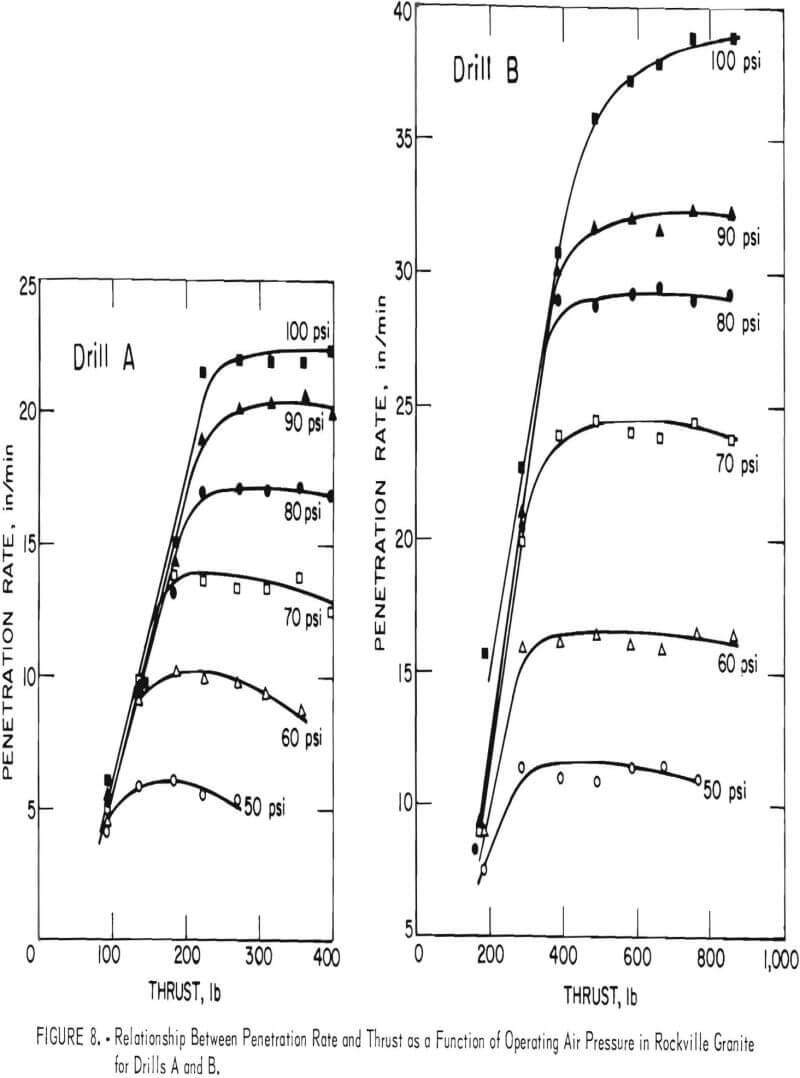
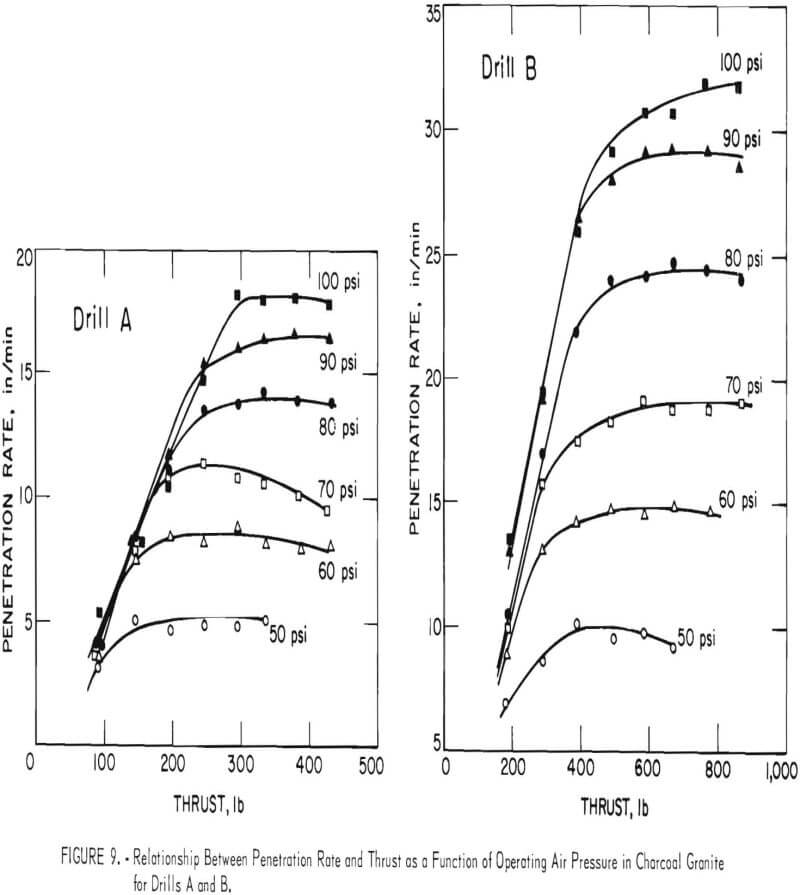
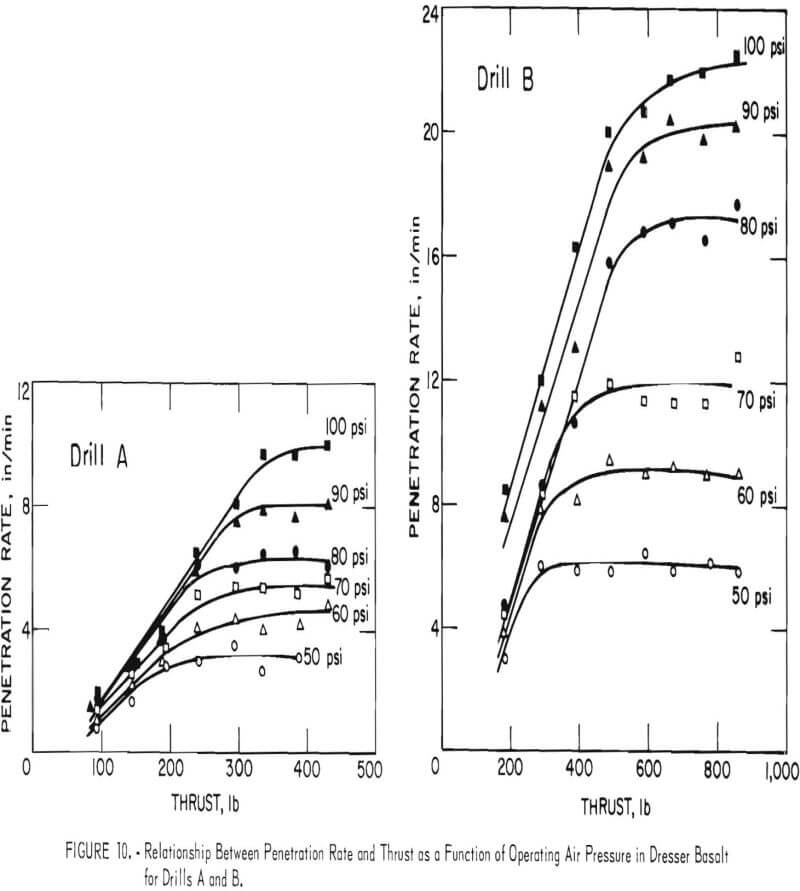
Penetration rate is increased by an increase in applied thrust up to an optimum point after which penetration decreases until the drill eventually stalls. Higher operating pressures result in increased penetration rates with the only apparent limitations being the design characteristics of the drill and bit and the ability to remove the cuttings produced.
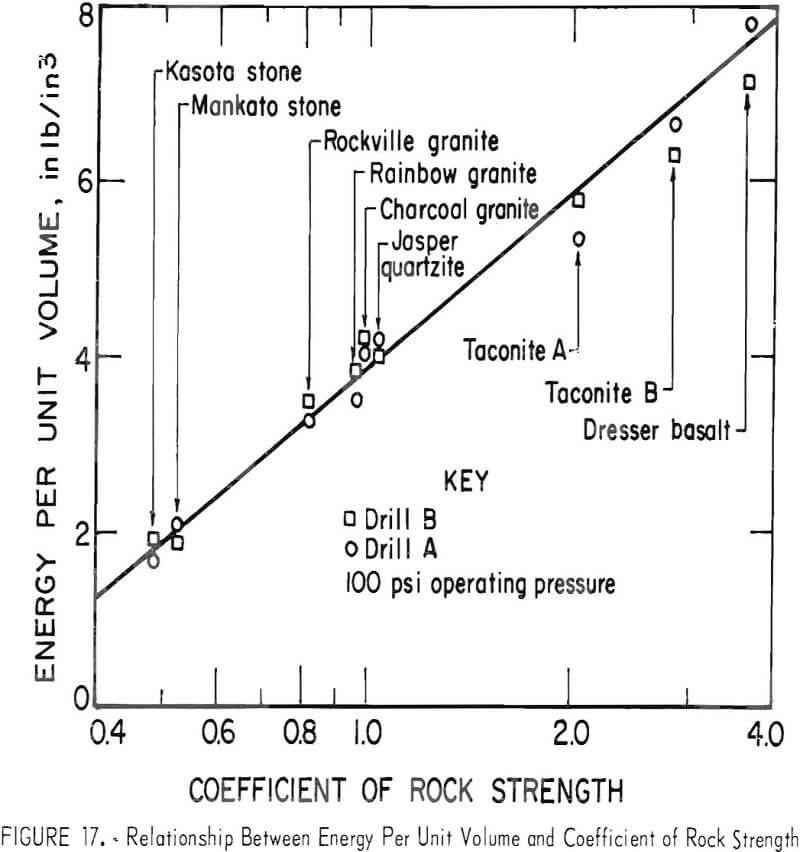
Rock physical properties are important parameters in predicting drilling rates but because of the complex nature of the failure mechanism in drilling no single property is suitable as a drillability criterion for all drilling systems. However, the coefficient of rock strength test appears to have potential usefulness in predicting percussive drilling rates. Its correlation with energy per unit volume is extremely good.
In 1961, the Bureau of Mines Twin Cities Mining Research Center began laboratory drillability studies with a full-scale diamond drill. The results indicated that certain physical properties showed good correlation with penetration rates, and that the penetration rate with a diamond bit is directly related to the drilling strength of the rock which, as a first approximation, is a multiple of the compressive strength of rock. This test series was followed up by field diamond-drilling experiments carried out in 26 rocks in Minnesota, Wisconsin, and Michigan. The data from the entire diamond drilling program were analyzed statistically and the results showed that diamond drilling rates can be predicted from the machine operating conditions, the bit type, and the physical properties of the rock drilled.
Additional work using diamond impregnated bits indicated that with such bits the strength characteristics of the rock become less important, but abrasive properties (as indicated by the percentage of quartz) become significant.
This current report is the second in a proposed sequence of reports on percussive drilling research being carried out at the Bureau’s Twin Cities Mining Research Center. The first report describes the measurement and interpretation of percussive drill performance exclusive of penetration rate determinations for two percussive drills. A proposed future report will utilize the penetration data (for the same two drills) and physical property data shown in this second report as well as the work rates presented in the first report. This proposed future report will be a statistical regression analysis relating penetration rate to the performance characteristics of the two drills used and the physical properties of the rocks drilled.
Experimental Procedure
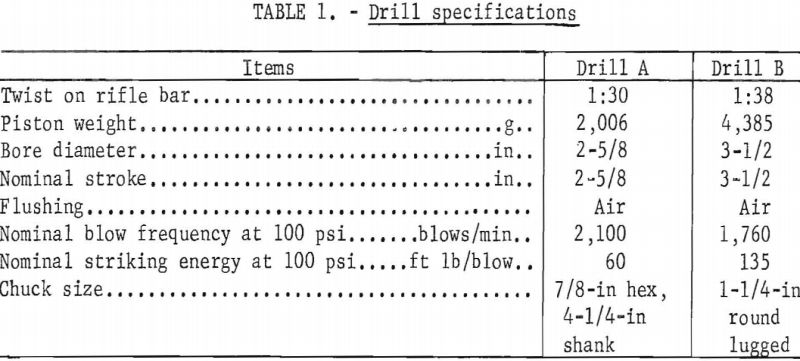
Laboratory drilling experiments were performed with two mining-type percussive drills having the specifications shown in table 1.
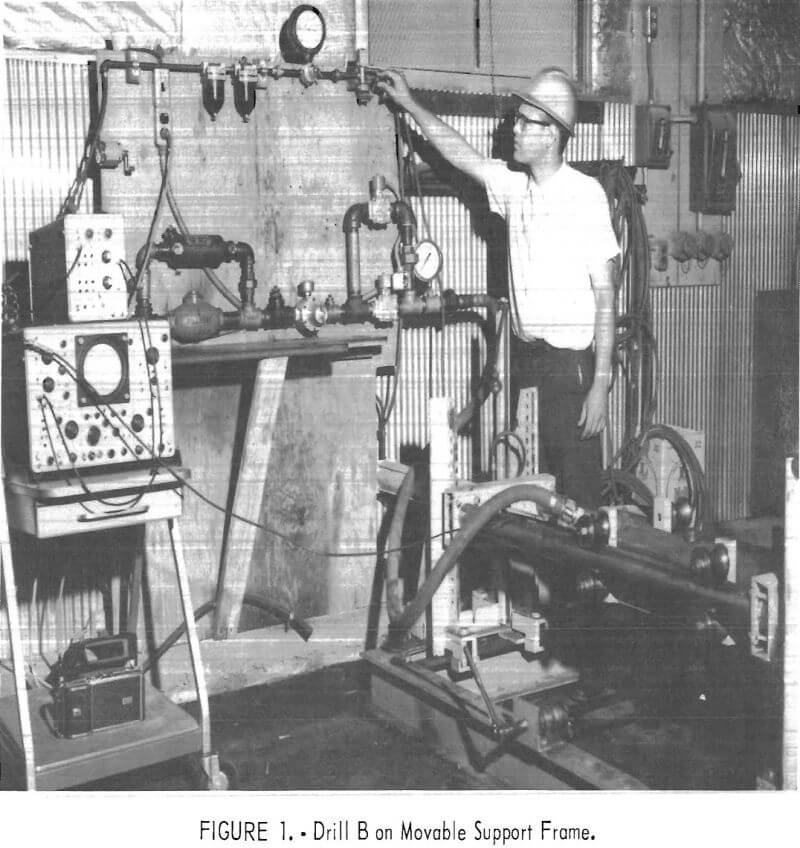
Both drills were securely mounted on a steel frame and operated in a horizontal position. The frame supporting drill A was rigidly attached to the floor while the rock to be drilled was placed on a movable steel platform. For drill B a support frame was constructed which permitted moving the drill in both vertical and horizontal directions while the rock remained immobile on a rigid steel frame (fig. 1).
On both drills an air cylinder provided the thrust, and the test conditions were varied by a pressure regulator. Bits used on both drills were 1-½-in diameter cross-type with four tungsten carbide inserts. All drill rods were 4 ft long. Both drills were calibrated to determine maximum piston velocity, blow frequency, stroke length, and work rate. Variables measured during experiments included rotational speed of the drill rod, operating air pressure, thrust, air consumption, and penetration rate.
Prior to starting a test, each hole was collared with an old bit. A new bit was then placed on the drill rod, and the operating air pressure and feed pressure (thrust) were set at predetermined values. Drilling was continued for one minute or until the drill had traveled forward to the limit of its supporting carriage, whichever occurred first.
While drilling continued, readings were taken of the air volume required for drill operation and bit rotational speed. At the end of the test the total distance drilled was measured. Each rock was drilled at operating air pressures of 50, 60, 70, 80, 90, and 100 psi. At each operating pressure, data were obtained at feed pressures of 20, 30, 40, 50, 60, 70, 80, and 90 psi.
All drilling was done with new bits or with bits maintained in a like-new condition by sharpening. In the rocks in which wear was not a problem, one bit was used for all tests. In rocks which caused rapid wear the bits were changed at the end of each test run to eliminate wear effects as much as
possible. Drilling was done dry with no flushing air other than that normally furnished by the drill itself.
Physical Properties of Rocks Drilled
The following physical property measurements were made on the nine rocks drilled: Compressive strength, tensile strength (indirect method), Shore scleroscope hardness, density, longitudinal velocity, shear velocity, bar velocity, dynamic modulus of rigidity (Shear modulus), static and dynamic Young’s modulus, and Poisson’s ratio.
Results and Discussion
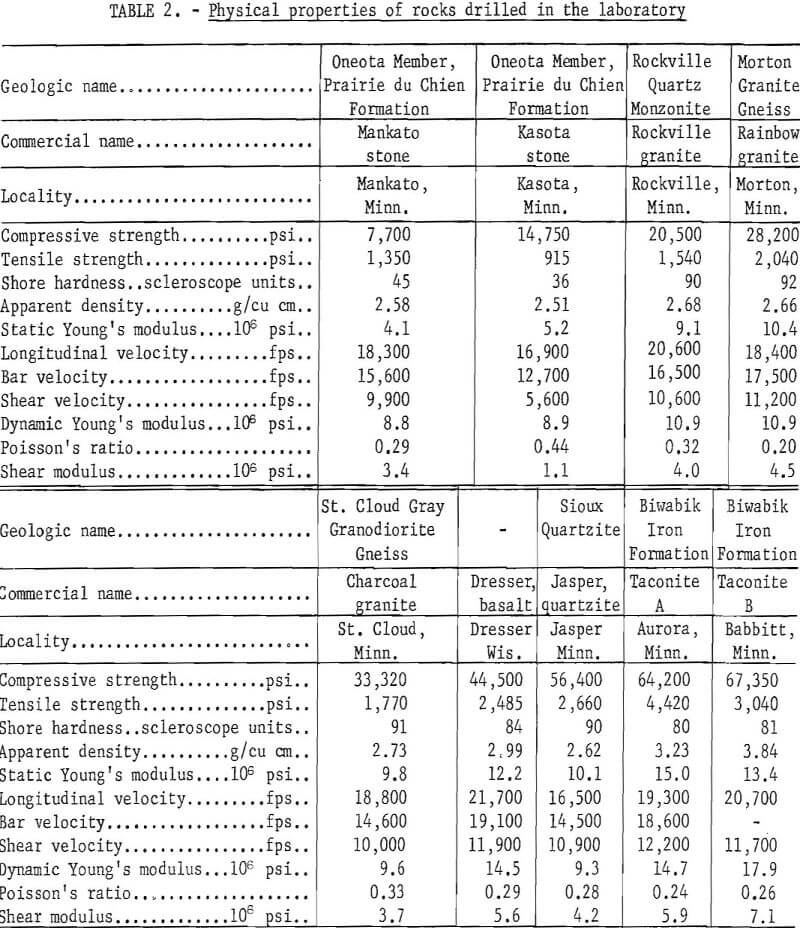
Table 2 shows the physical properties of the rocks drilled in the laboratory. While all the measured properties are given, analysis of the data showed that only certain properties related significantly to penetration rate.
Effects of Thrust on Penetration Rate
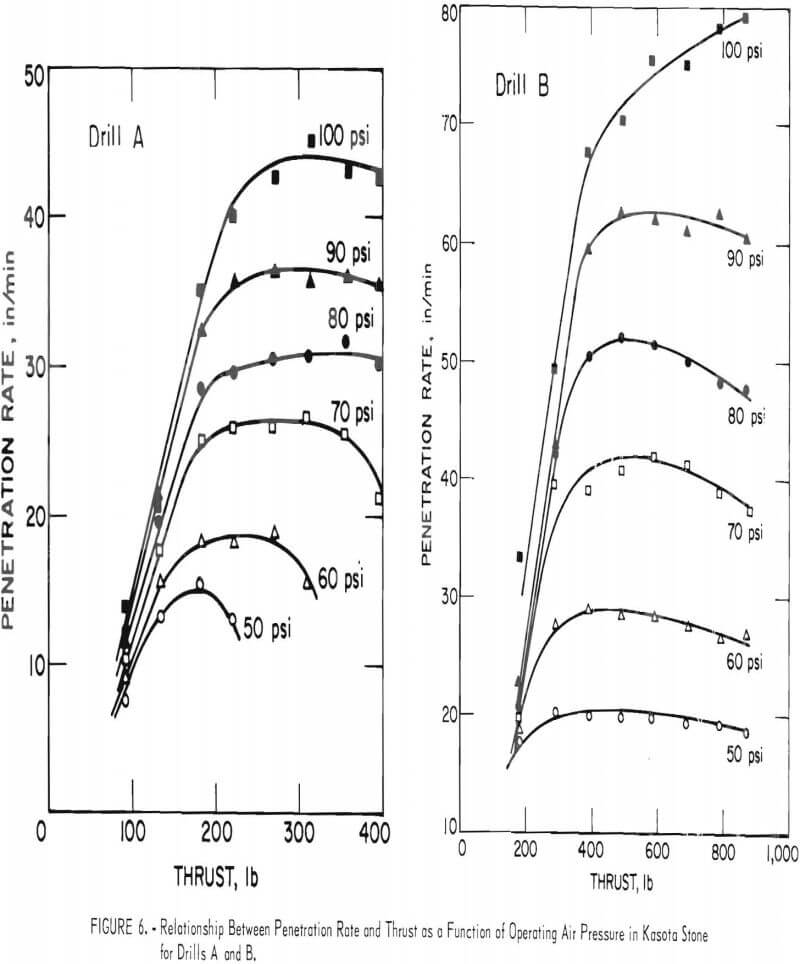
Figures 2 to 5 show the average penetration rates obtained in each rock drilled at all levels of thrust and operating pressure.
In percussive drilling, the effect of thrust on penetration rate is well known. Low thrust results in over travel or free rotation of the bit, this results in over-indexing so that the free face of the previous groove is too far away to cause a good chip to be formed. In addition, the piston may or may not contact the drill rod while the bit is on the surface of the rock. If the bit is off the hole bottom, energy applied at this time is ineffective in causing rock breakage or penetration. Higher thrusts reduce free rotation but, because rotation or indexing takes place during the up or back stroke of the piston, increased bit pressure raises the level of torque required for indexing. As thrust continues to increase, a point will be reached where the torque necessary for indexing will cause the drill to stall. Each drill will have an optimum thrust which will give maximum penetration because of favorable contact at the bit-rock interface reflecting optimum indexing distance.
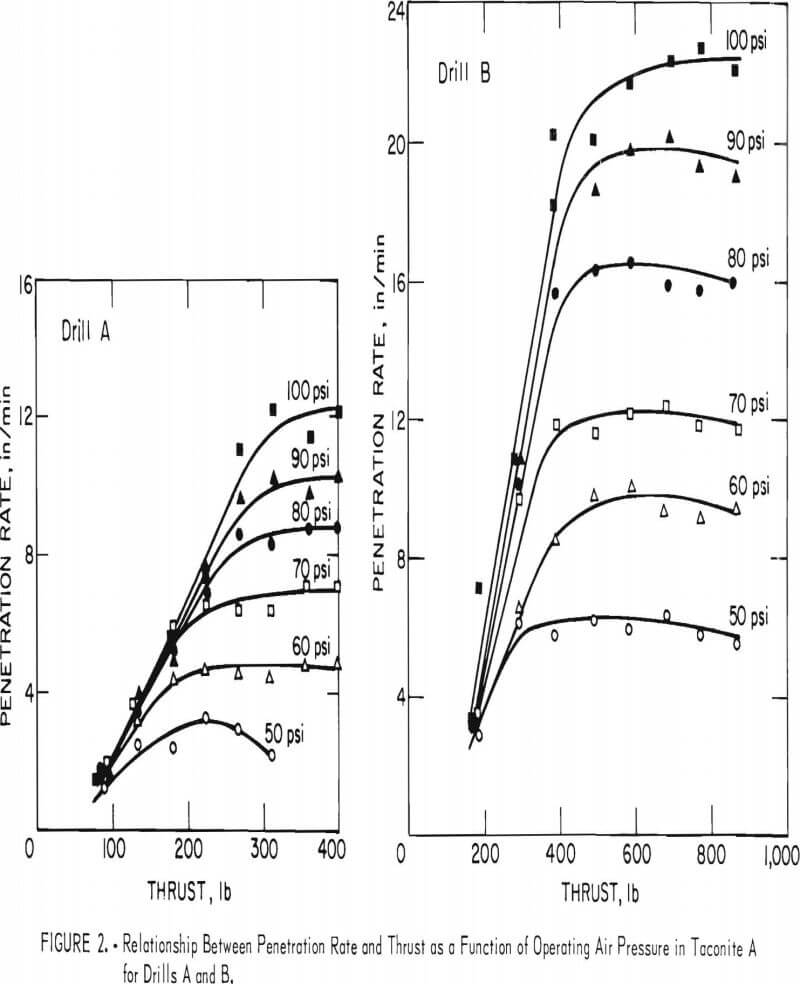
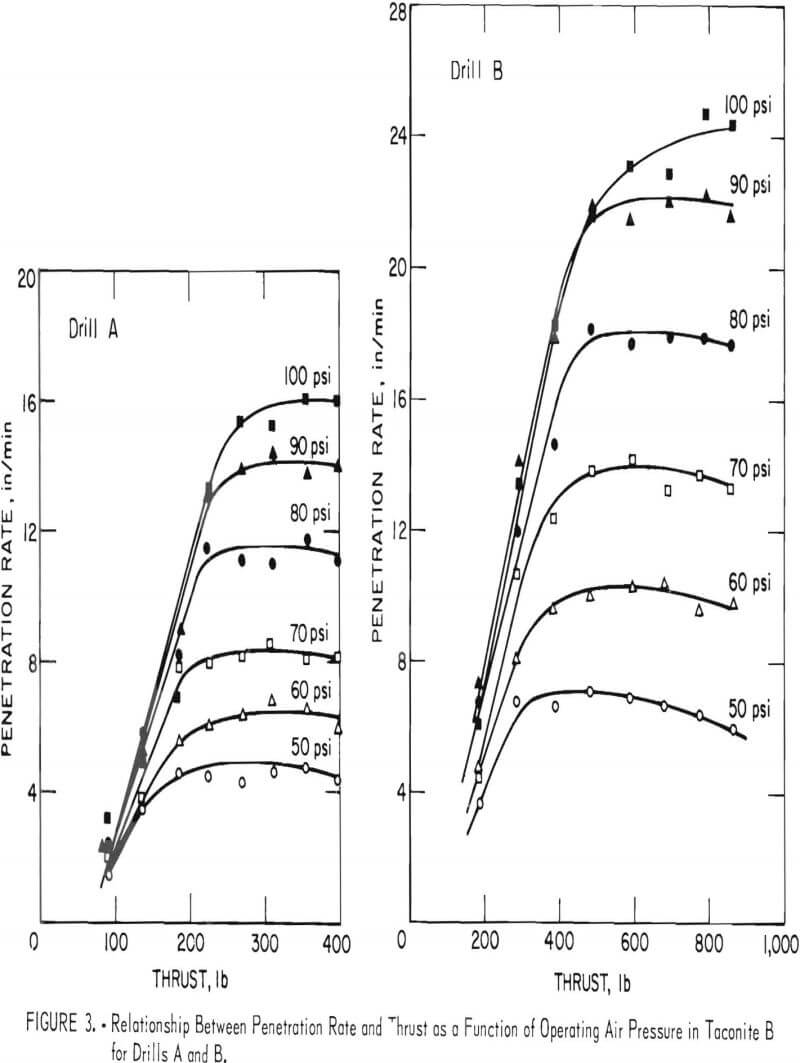
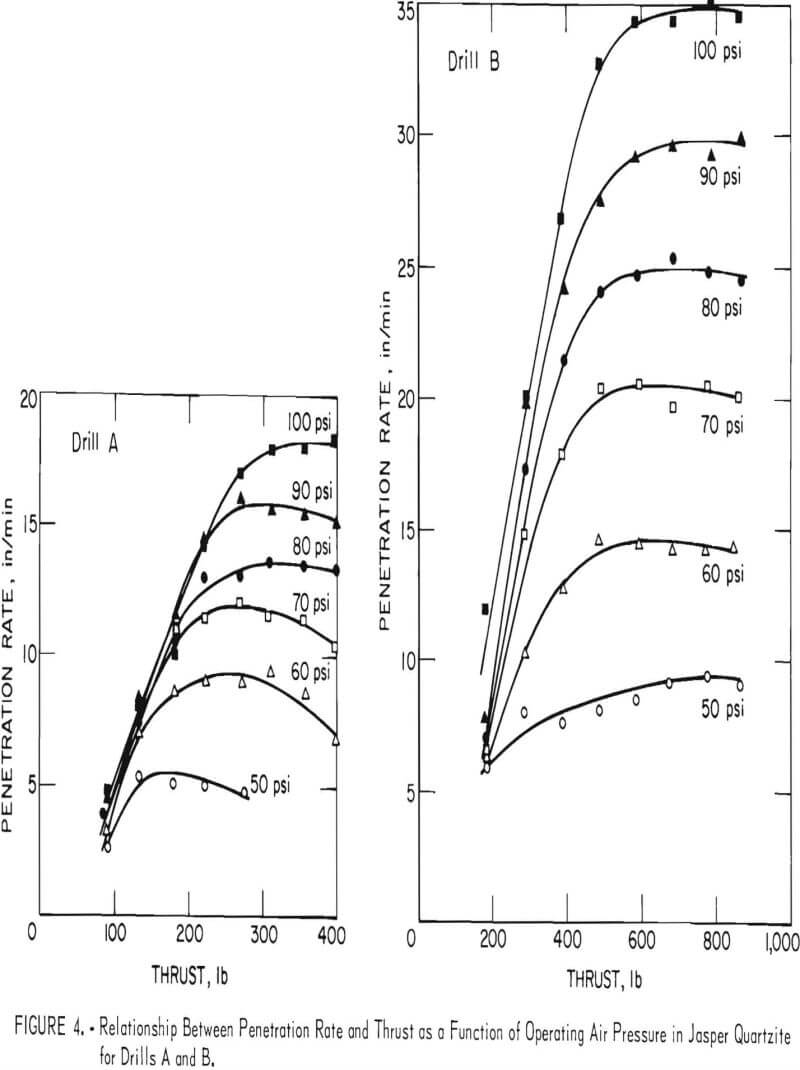
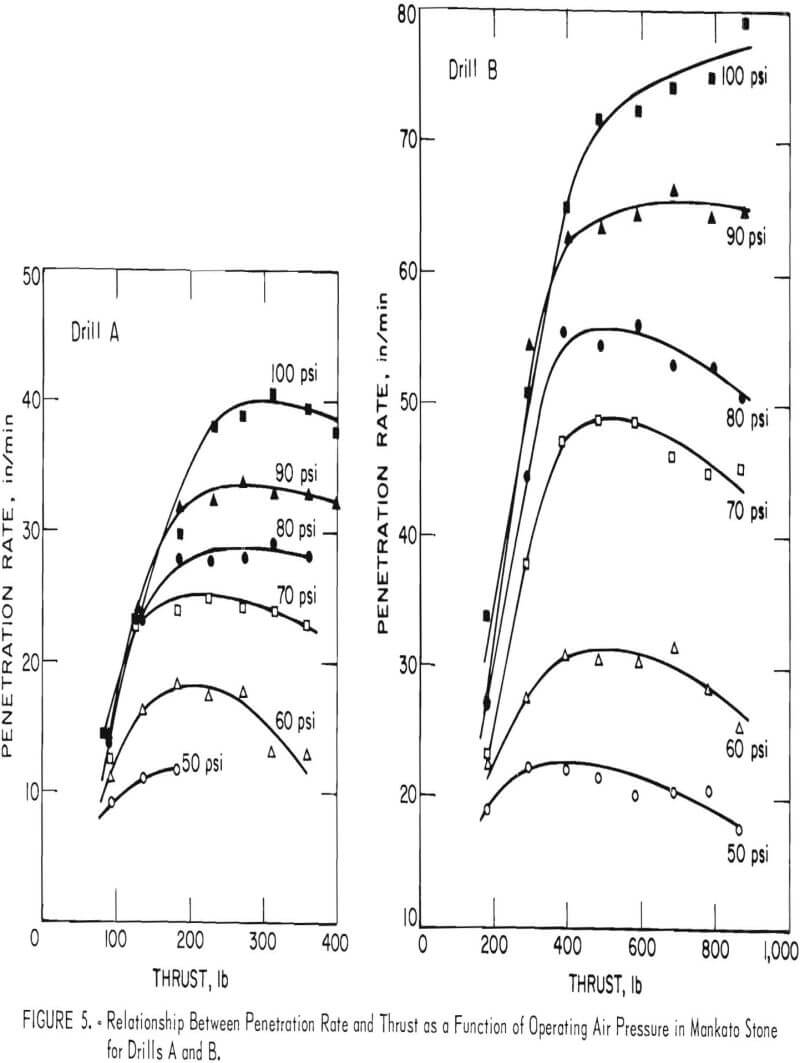
It is observed that after a certain thrust is applied, any further increase results in no significant increase in penetration rate. The optimum thrust value which should be used is just greater than that at the inflection in the penetration rate curve. The thrust value at this point will insure maximum penetration rate at minimum bit wear since the thrust or force on the bit is only sufficient to assure contact at the bit-rock interface at each blow arrival without unnecessary loss of piston energy for rotation.
Effects of Operating Air Pressure on Penetration Rate
Figures 6 through 10 also show the effect of increased operating air pressure. It is observed that penetration rate is directly related to operating pressure, and penetration rates increase with an increase in air pressure. The curves indicate that the best method of maintaining top drilling efficiency is to operate the machine at the highest operating pressure possible consistent with the manufacturer’s recommendations.
Relationship Between Physical Properties and Penetration Rate
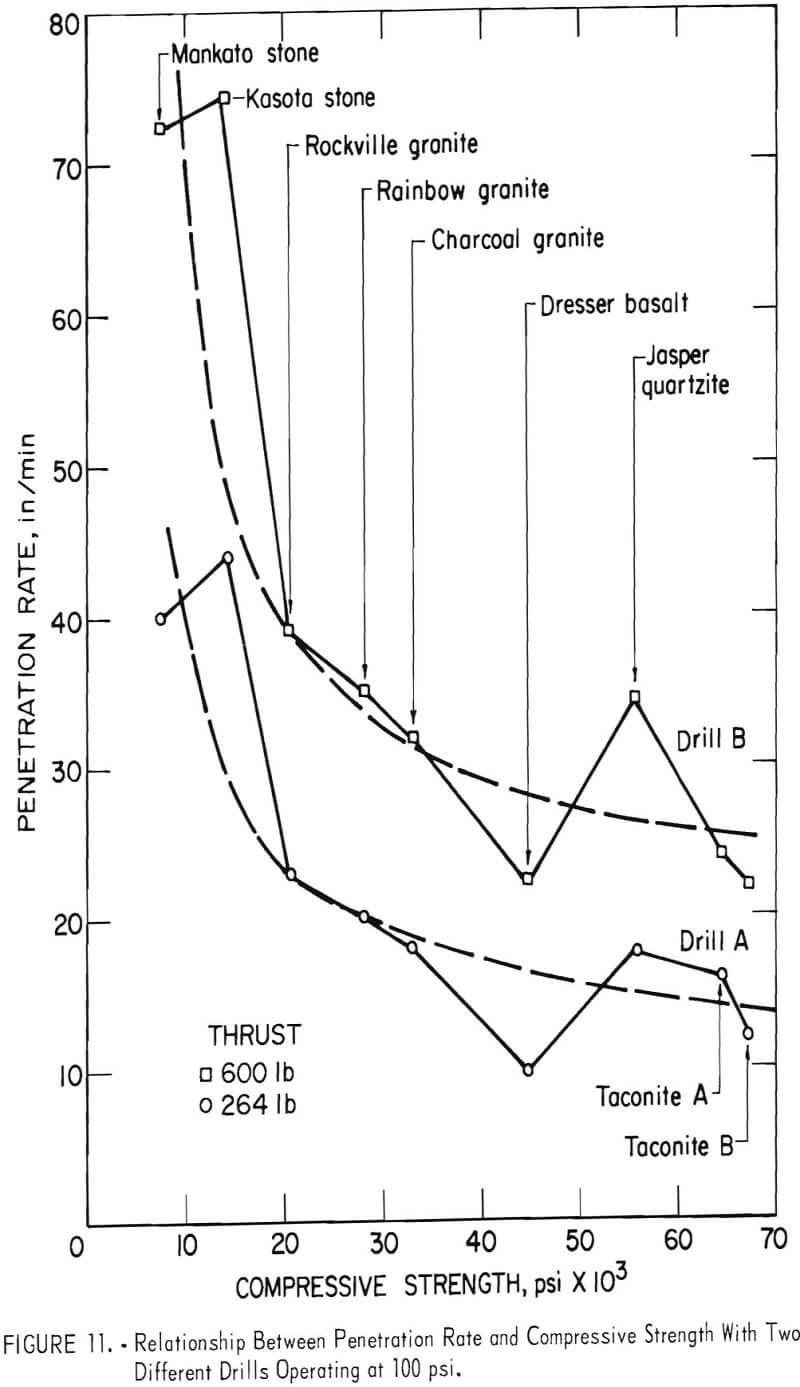
The physical properties of the rock were measured to determine their correlation with penetration rates. From previous work with surface-set diamond bits, an equation of drillability was derived with the compressive strength of the rock as a criterion. To display the relationship between drilling rates and rock strength for percussive drilling, a similar study was made. Figure 11 shows the curves for penetration rate and compressive strength resulting from the laboratory drilling tests. The trend is similar to that for laboratory tests with surface-set diamond bits. Figures 12 and 13 show the relationship between penetration rate, and tensile strength and Shore hardness, respectively.
There is a general decrease in penetration rate as rock strength increases. While this trend does exist, it is also evident that the drillability of certain rock types cannot be predicted accurately by using compressive strength as the only criterion. For example, a relatively weak dolomitic limestone, such as Mankato stone, exhibited problems in cuttings removal manifested as a tendency of the drill bit to become clogged. Therefore, even though this rock was the weakest of all those tested, it did not have the highest penetration rate. On the other hand, a relatively strong rock such as Jasper quartzite drilled at a rate higher than would be predicted from compressive strength alone. While strong, this rock has brittle characteristics that make its fragmentation compatible with the cutting action of a percussive bit. A third rock type which does not follow the compressive strength penetration rate correlation is Dresser basalt. Although this rock is also quite strong, it lacks the free quartz content and brittleness of Jasper quartzite, and drilled at a rate lower than would be predicted from its compressive strength.
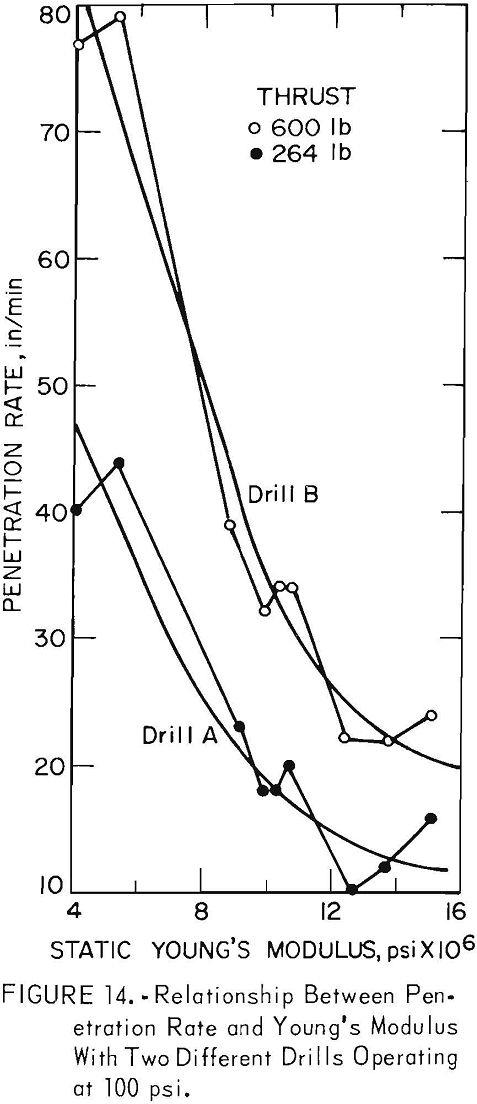
The low penetration rates in certain rocks are probably due to their resistance to fracture or their ability to absorb applied energy. A physical property which appears to take this phenomenon into account is Young’s modulus. Figure 14 shows the relationship between penetration rates and static Young’s modulus for both drills.
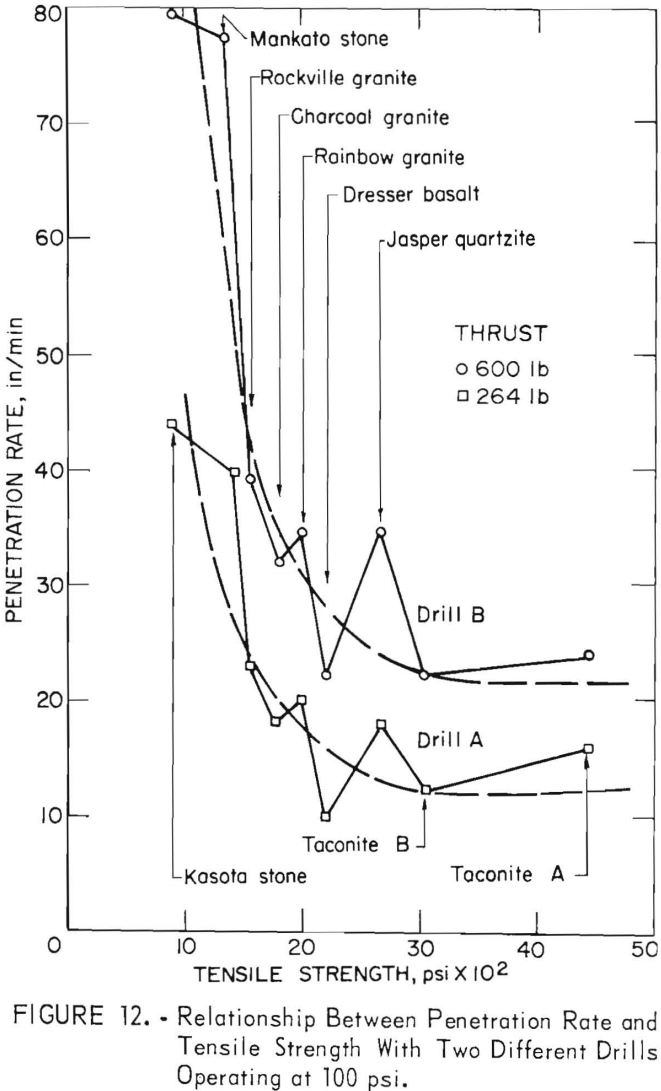
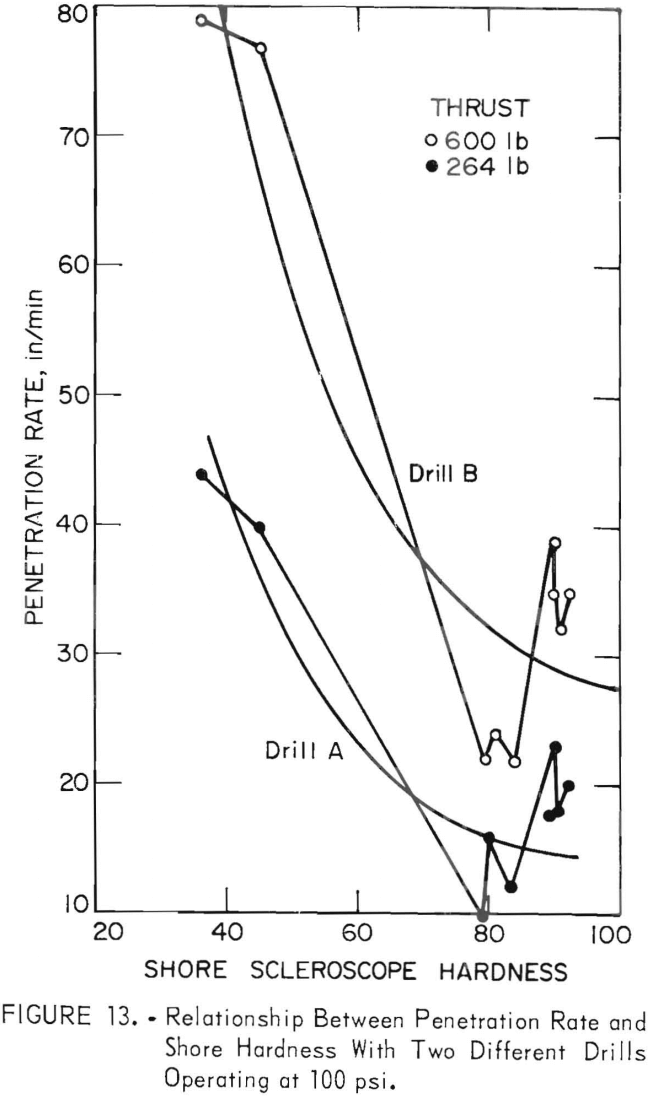
The other significant physical properties were tensile strength and Shore scleroscope hardness. Tensile strength correlates well with compressive strength and its relationship to penetration rate shows about the same trend (fig. 12). Shore scleroscope hardness is a relative value determined by the height of rebound of a diamond-tipped tool. Figure 13 indicates that this property alone is not a significant parameter in the determination of penetration rates by the percussive drilling method.
The Shore hardness test and the other property tests previously discussed do not take into consideration many factors which have importance in the fracture mechanism occurring under a percussive drill bit. Although all such characteristics as grain size, grain bonding, mineral composition, and physical structure are important, their individual significance varies from one rock type to another and, to some extent, even within a given rock type. Therefore, the optimum test for predicting rate of penetration must consider all the factors governing fragmentation at the bit-rock interface. This test should then approximate the action of a percussive bit as closely as possible.
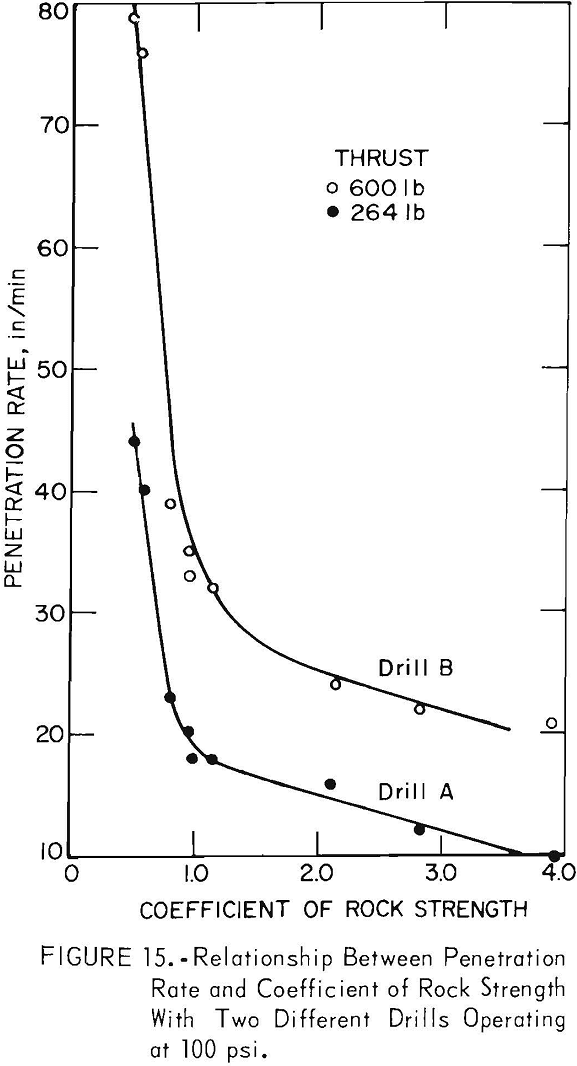
A test developed by Protodiakonov, which indicates a given rock sample’s resistance (fig. 15) to fragmentation, was modified and used on the rocks drilled in the laboratory. In this modified test, five irregularly shaped rocks are prepared, each having a volume of about 15 cu cm. The total weight in grams of the five specimens should be 75 times the specific gravity of the material, ±2 grams. Each specimen is placed on the bottom of a hollow cylindrical droptester and impacted with a 2.4-kg weight falling from a 0.6-meter height. The cross-sectional area of the cylinder is 7.30 sq. in.
The number of drops for each specimen may vary from 3 to 40, with the stronger rocks requiring more drops. The broken material for each sample is combined and shaken on a 0.5-mm (35 mesh) screen. The minus 0.5-mm material is weighed and divided by the specific gravity to determine the solid volume of the sample. The coefficient of rock strength is then determined by dividing the volume of the minus 0.5-mm material of the 5 specimens by the number of drops used. After the coefficient of rock strength is determined for one sample, a larger and smaller number of drops are tried to determine the minimum coefficient of rock strength. After a minimum number has been found, two additional determinations are made to verify the results. The results for each rock tested are shown in table 3.

The relationship of penetration rate to coefficient of rock strength is shown in figure 15. The curve indicates that this relatively simple measurement is a potentially useful indicator of penetration rate for the percussive drill system. The rough similarity between the coefficient of rock strength test and the action of the percussive bit offers a possible explanation of the good correlation with drilling rate.
The coefficient of rock strength test appears to take into consideration certain other rock characteristics which seem to be important in the drilling process, such as grain size, grain bond, and the presence of fractures or microfractures.
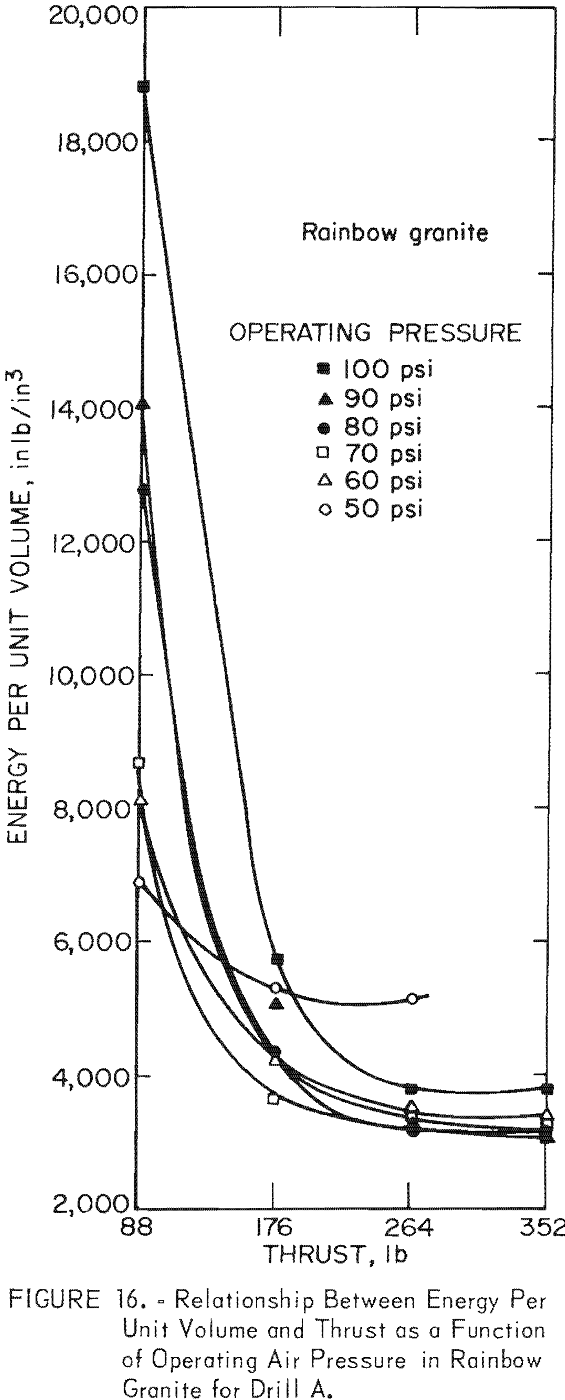
The work rate based on maximum piston energy was obtained for a range of operating pressures and thrust values in the driliability experiments. The energy required to produce a unit volume of hole in a given rock can be determined for specific operating conditions by the following equation:
Ev = 4P/ΠD²R…………………………………………………………….(1)
where E = energy per unit volume, in lb/in³
P = work rate, in lb/min,
D = bit diameter, in,
and R = penetration rate, in/min.
The energy per unit volume was calculated for each rock drill at all combinations of operating pressure and feed pressure. Since the only variable at any given set of
conditions was penetration rate, the results showed the same trend in each rock type when plotted against thrust. Figure 16 shows an example of this result in one rock. As can be seen from the curve, the lowest values for energy per unit volume occurred for operating air pressures of 80 to 90 psi. This observation would indicate that this range of operating pressure results in the most efficient drilling for this drills However, because higher pressure results in more rapid penetration, the greater efficiency at lower pressures is probably due to better cuttings removal.
The value for energy per unit volume value at optimum drilling conditions was correlated with the coefficient of rock strength for each rock type and is shown in figure 17. Since the values for each machine indicate that energy per unit volume is independent of the work rate of a given drill, a simple method of predicting penetration rates is to determine the strength coefficient of a representative rock sample. From this determination the energy per unit volume for percussive drilling at optimum conditions can be calculated. The remaining unknown, work rate, can be obtained either from the drill manufacturer or by calibration.
The penetration rate can then be predicted by the following version of equation 1:
R = 4P/πD²Ev…………………………………………………………..(2)
The research conducted in the laboratory must be extended to field testing to determine the accuracy and limitations of this method.
