Table of Contents
There has been growing concern about the adverse effects on the environment associated with high temperature processing of galena. Because of the difficulties encountered with conventional smelting, the use of hydrometallurgical techniques for lead processing has received considerable attention in the past few years. With hydrometallurgical processing, sulfur dioxide is not produced and lead-bearing particles which always exist in high temperature processing are precluded.
An early investigation of aqueous leaching of galena was conducted by Anderson et al who observed complete dissolution of 325 x 400 mesh particles in 1.2 hours when the reaction was carried out at 150°C and 5.7 atm of oxygen.
Vizsolyi et al. advanced an interesting technique for the leaching of galena which initially involves the oxidation of galena with oxygen to lead sulfate followed by dissolution with ethylenediamine.
Seraphim and Samis have shown that galena can be leached successfully with oxygen at neutral pH by forming acetate complexes and elemental sulfur at temperatures and oxygen pressures on the order of 120°C and 3 atm, respectively.
Haver et al investigated recovering lead and sulfur from galena using ferric sulfate. The leach residue was treated with an ammonium carbonate solution to change the lead to an acid soluble form and to produce ammonium sulfate.
Awakura et al presented a kinetic investigation of the dissolution of galena in hydrochloric acid and in perchloric acid solutions. Under the experimental conditions employed, dissolution rates were controlled by chemical reactions on the surface of galena.
Various research workers have studied the leaching of galena in chloride solutions. Ferric chloride leaching of galena in the presence of hydrochloric acid and sodium chloride provides an excellent means of extracting lead hydrometallurgically because soluble lead-bearing species and elemental sulfur are formed. These important attributes have been noted by a number of investigators, and work concerning this leaching aspect has moved ahead at a considerable pace.
The use of ferric nitrate as an oxidant for galena has been suggested(but detailed investigations have not been carried out.
Although the future of hydrometallurgical processing of galena is certainly promising, little information on the thermodynamics and kinetics of leaching this mineral currently exists. The objective of this investigation was to establish the equilibrium and kinetic parameters and limitations of leaching galena with ferric chloride and ferric nitrate as oxidants.
Ferric Chloride System
Equilibrium Considerations
When lead sulfide reacts with ferric chloride in solution, soluble chlorocomplexes are formed:

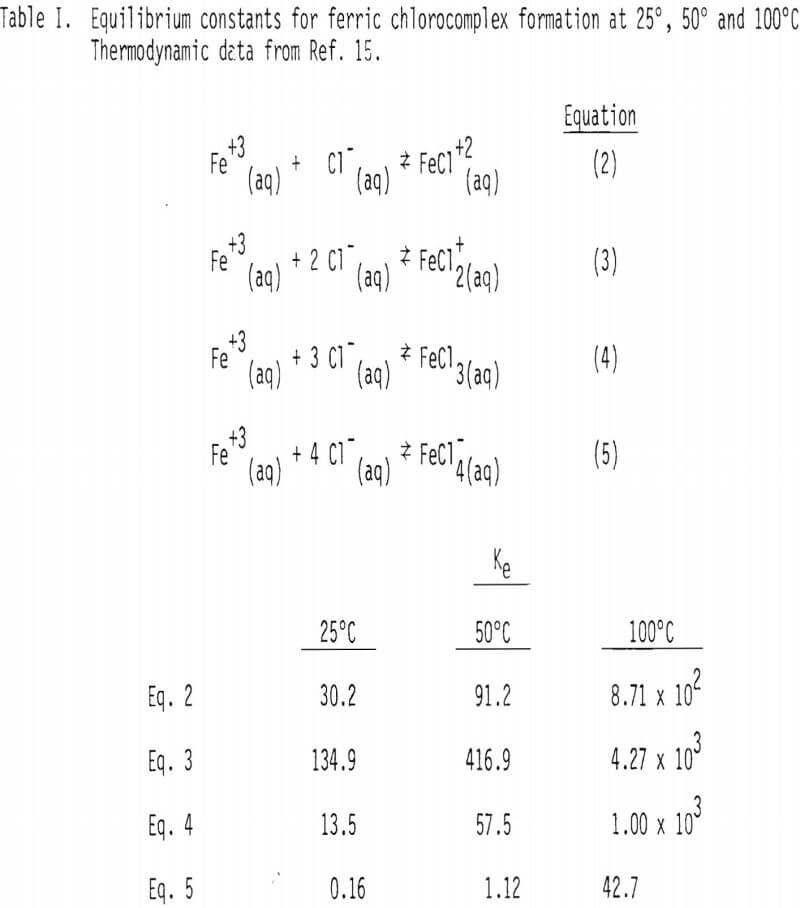
In the above stoichiometric reaction, FeCl3(aq) and PlCl4-²(aq) are shown as the reactant and product chloride species. There are a number of ferric and lead chlorocomplexes, and the distribution of different chlorocomplexes is very much dependent upon the activity of free chloride ion in the aqueous phase. Some important species and the equilibrium constants for the corresponding reactions at 25°, 50° and 100° are shown in Tables I and II.
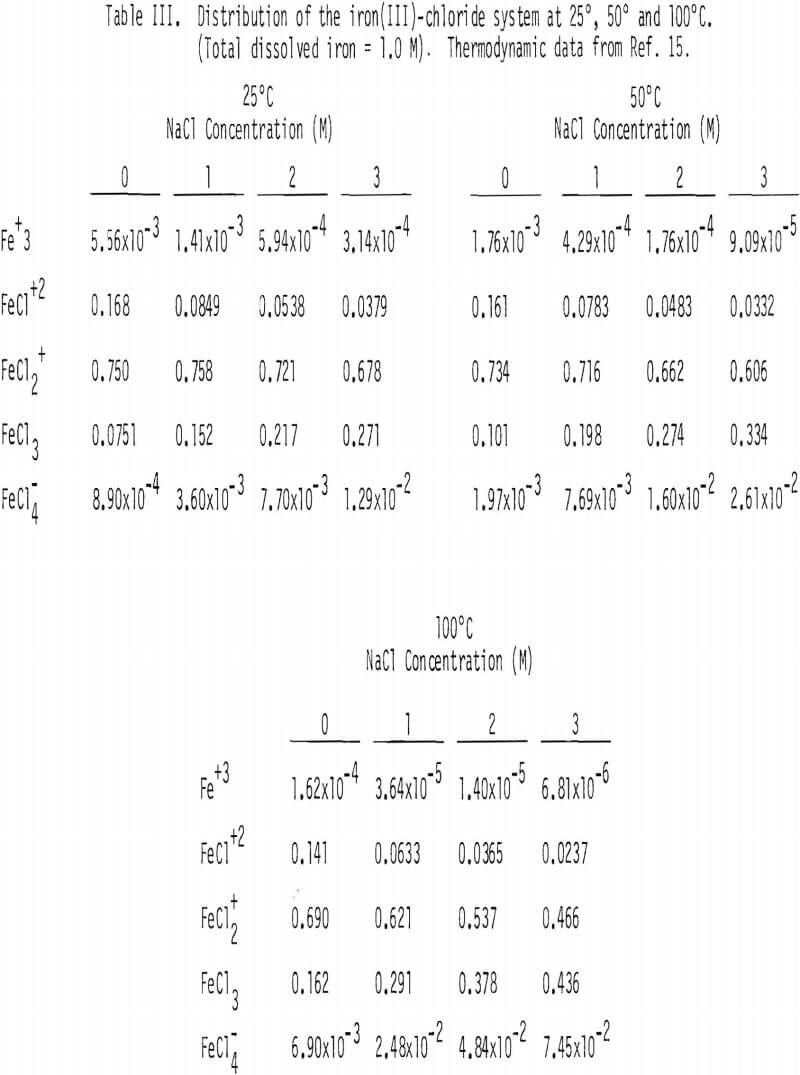
Soluble ferric chlorocomplexes were calculated as a function of sodium chloride concentration at 25°, 50° and 100°C. The results are shown in Table III. It should be noted that concentrations of FeCl3(aq) and FeCl4 increase with temperature. For example, the concentrations of FeCl3(aq) and FeCl-4 at 3M NaCl are 0.271 and 1.29 x 10-² M at 25°C, respectively, compared with 0.436 and 7.45 x 10-² M at 100°C, which corresponds to a combined enthalpy value of about 2 kcal/mol .
As can be seen from Table II, lead chlorocomplexes are also a function of free chloride ion activity in solution. Figure 1 shows a plot of the total concentration of soluble lead compounds including Pb++, PbCl+, PbCl2(aq), PbCl3-, and PbCl4= as a function of NaCl concentration. In this situation it should be noted that one limiting factor is the formation of the solid form of PbCl2, especially at low temperature, as can be seen in Table II. In the construction of these plots, total lead concentration is assumed to be 0.1 M at all times, and FeCl3 addition is 0.1 M. It should be noted that the concentration of the total soluble lead species increases substantially with increasing total chloride concentration. For example, solubility increases about 2.6, 3.2 and 4.4 times at 25°, 50° and 100°C, respectively, when the NaCl concentration is increased from 0.5 to 3 M (Figure 1). Solubility also increases with increasing temperature, that is solubility is increased about six times when the temperature is increased from 25° to 100°C.
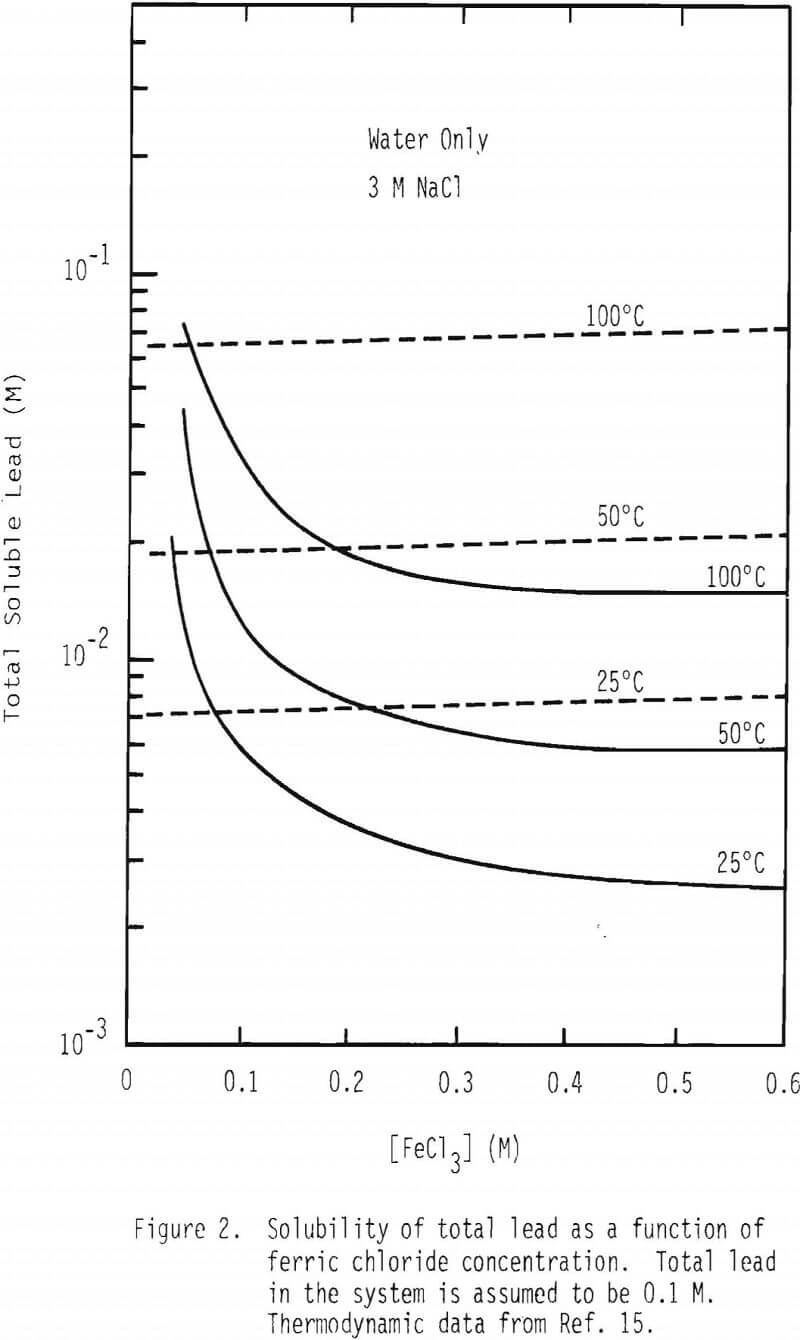
Figure 2 contains a plot of total soluble lead species at 25°, 50° and 100°C as a function of FeCl3 in the absence and presence of 3M NaCl. It is interesting to note that solubility decreases dramatically as the concentration of FeCl3 increases up to 0.2 M and stays fairly constant beyond this concentration when there is no sodium chloride present. Solubility is not affected significantly by the concentration of FeCl3 in the presence of 3M NaCl.


Kinetic Considerations
The most frequent cleavage of galena is cubic. The galena samples used in this investigation were all well defined cubes and, furthermore, the galena samples remained cubic throughout dissolution with ferric chloride.
Three distinct mechanisms may occur in leaching systems such as the galena/ferric chloride system. They are film diffusion, product layer diffusion and intrinsic chemical reaction at the solid/liquid interface. These three modes of leaching mechanism for a cubic system were developed, and the results are shown in Table IV along with the equivalent expressions for spherical geometry for comparison. The detailed derivation for the cubic system is given in the Appendix. The leaching time, t, is given as a function of fractional leaching for film diffusion, product layer diffusion and chemical reaction controlling cases. Also listed is the time of completion of the leaching reaction, denoted by tcomp, which is equivalent to t when α = 1.0, where α is fractional conversion. It should be noted that although similarity exists between cubes and spheres, the expressions of tcomp for film diffusion, product layer diffusion and chemical reaction are notably different. See Equations 12(a, b), 14(a, b) and 16(a, b) in Table IV.
When diffusion of a product through the product layer is limiting, tcomp, given by Equation 14(b), should be modified to:

Equation 18 assumes that the concentration of aqueous product at the reaction interface, CDC, is much greater than that at the solid/liquid boundary, x = L.
Two important observations should be made from these analyses with reference to two possible limiting cases, namely, diffusion of reactant or product through the product layer. If diffusion of a reaction product is limiting the overall reaction rate, the relationship of 1/tcomp versus concentration of reactant may not be linear as indicated by Equation 14(b). Furthermore, the temperature dependence on 1/tcomp would be different for these two different limiting cases. The effect of temperature on tcomp for these two situations can be represented by Equations 19 and 20.


Experimental Materials and Procedures
All of the galena samples used in this study have been obtained from the Galena Mine, Kansas. The galena samples contained 85.6% lead and 13.0% sulfur by weight. X-ray diffraction analysis of the galena sample and leached solid product showed that the galena d-spacings are almost identical to those of the ASTM values and also that the solid product formed after leaching is pure elemental sulfur. Various size fractions of galena samples were obtained by crushing, grinding and screening.
All of the chemicals used in this investigation were of reagent grade. Distilled water was used in all of the experiments.
All of the leaching studies were carried out in a two-liter reaction vessel placed in a thermostatically-controlled water bath. See Figure 3. A typical experimental procedure can be described as below:
Desired leaching solutions and galena samples were kept in separate containers and placed in the water bath to attain the desired temperature. Once the temperature was reached, solutions were transferred into the vessel containing the galena samples, and the leaching experiments were commenced. Nitrogen gas was introduced into the solution throughout the entire process to keep air from entering the solution. In most experiments, 1 gram of galena was leached in 1 liter of solution. A predetermined amount of solution was withdrawn at each interval of time, filtered, and the solution sample was diluted, if needed, before chemical analysis using an atomic absorption spectrometer.
Diffusivities of ionic species were measured with the aid of a diaphragm cell. See Figure 4. The device was separated into two cells by porous fritted glass. This system was kept in a water bath to maintain the desired temperature before starting the measurements. The cell constant for the diaphragm cell was determined utilizing


copper sulfate and the known diffusion constant of cupric ion.
Experimental Results and Discussion
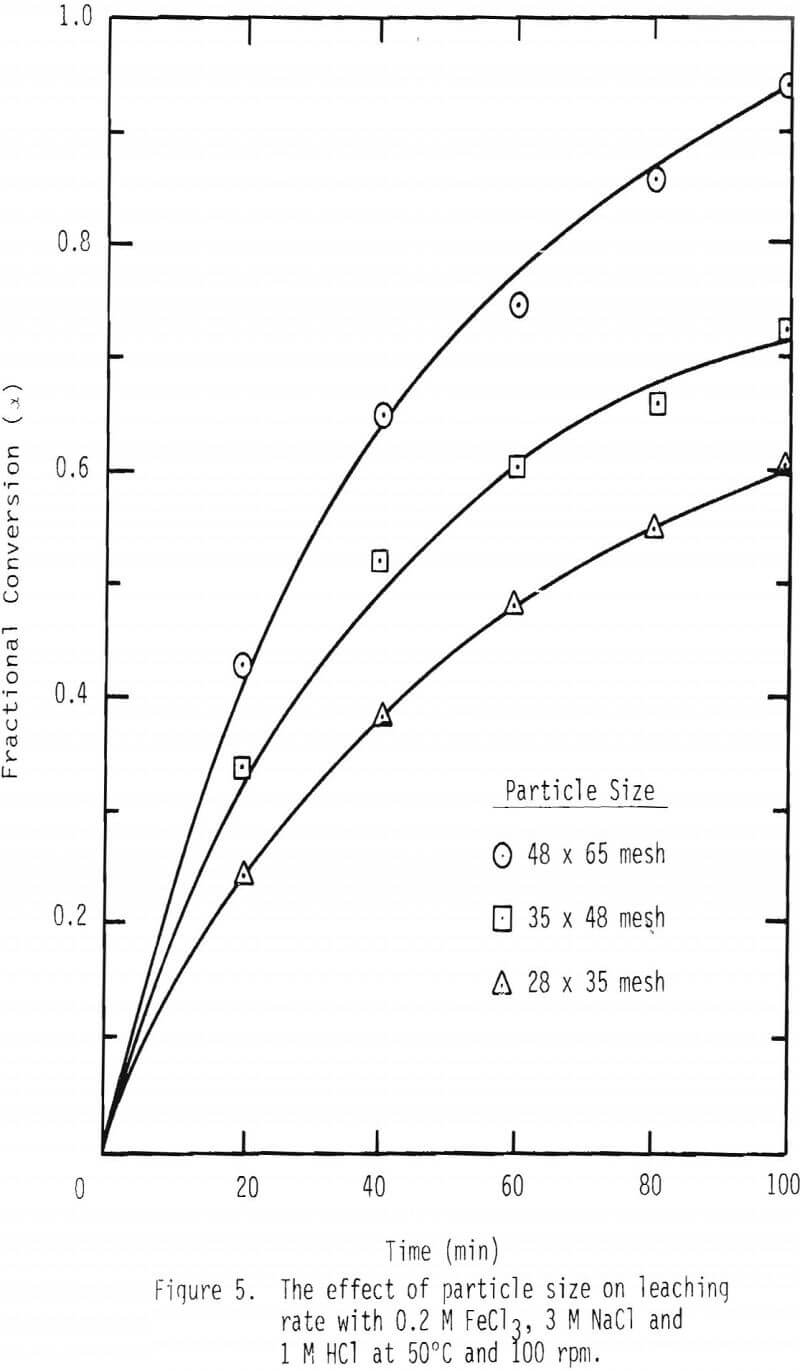
A series of leaching experiments were performed with 28 x 35, 35 x 48 and 48 x 65 mesh galena samples at 50° and 90°C in the presence of 3 M NaCl , 1 M HCl and 0.2 M FeCl3 at 50°C and 0.1 M FeCl3 at 90°C. Fractional conversions are plotted as a function of time, and the results are shown in Figures 5 and 6.
As noted from the results shown in Figures 5 and 6, it is unlikely that mass transport through the diffusion boundary layer is the controlling mechanism, in that the plot of conversion versus time would be linear if that were the case [Eq. 12(b), Table IV].
The time required for completion of the leaching reaction for the diffusion boundary layer limiting case (film diffusion) can be estimated using Equation 12(b), provided km is given. The mass transfer coefficient, km, can be estimated using the following relationship

The values of tcomp for film diffusion for the 28 x 35 mesh fraction were calculated to be about 73 and 47 minutes for 50° and 90°C, respectively. These values are compared with tcomp measured in this study to be typically 600 and 300 minutes for 50° and 90°C respectively. These values indicate that the possibility of film diffusion limiting mechanism can be ruled out.
Plots were made to see whether product layer diffusion or chemical reaction is rate limiting, and the resulting plots at 50°C are shown in Figures 7 and 8. Based on the plots shown in Figures 5, 6, 7 and 8, it can be concluded that product layer diffusion is most likely the limiting step. In another way of presenting these findings, linear regression was performed for all three possible mechanisms. It should be noted that the slope of these curves (Figures 6-8) represents the inverse of the time required for completion of the leaching reaction, tcomp (Table IV). The values of tcomp with variation at 95% confidence level were computed from regression analysis, and the results are given in Table V. As can be seen from these results, the variation of tcomp is much higher for film diffusion and chemical reaction controlling mechanisms than for product layer diffusion as the controlling mechanism.
The effective diffusivity can be evaluated by a plot of tcomp versus L². See Equation 14(b). These plots are made from the leaching results at 50° and 90°C, and the results are given in Figure 9. Linear regression lines were made and are included in the figure.


When these linear regression lines were made, tcomp = 0, L² = 0 were used as an additional data point. The values of the effective diffusivity for ferric chlorocomplex are calculated from the slopes to be 5.2 x 10 -6 (0.2 M FeCl3) and 2.1 x 10 -5 cm²/s (0.1 M FeCl3), respectively, at 50° and 90°C. It is interesting to note that these two diffusivity values correspond to an apparent activation energy of 4.1 kcal/mol .
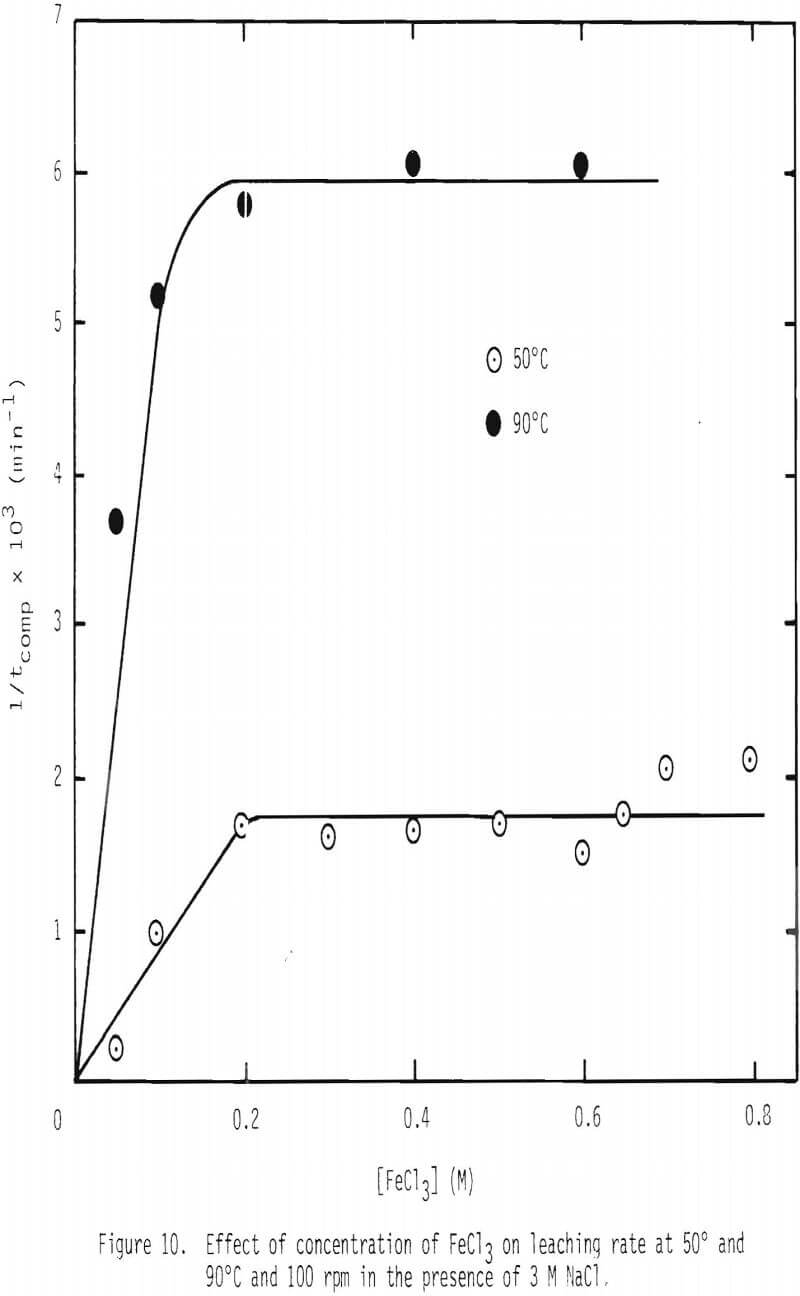
A series of leaching experiments were performed using 28 x 35 mesh galena particles in leaching solutions containing 3 M NaCl at 50° and 90°C, while the concentration of FeCl3 was varied over 0 to 0.8 M. The inverse of tcomp,1/tcomp, was calculated for various ferric chloride concentrations, and the results are given in Figure 10. 1/tcomp is the slope of the integrated rate plot, e.g., Figure 8. The results show that two linear regions are present, the first a steep increase up to 0.2 M FeCl3 and the second, a nearly horizontal region up to 0.8 M FeCl3. The linear relationship is expected in view of Equation 14(b), because 1/tcomp is directly proportional to CAb, the concentration of ferric chlorocomplex in this case. This integration assumes that the diffusivity of the diffusing species is constant. In order to examine the effect of the concentration of FeCl3 on diffusivity, two series of measurements on diffusion coefficient were made, and the results are given in Figure 11.
In Figure 11, the diffusivity values of ferric complex ions in the absence and presence of 3 M NaCl at 50°C are given. As expected from the reduction of ionic activity due to high ionic strength, the diffusivity in the presence of 3 M NaCl is about one half of that in the absence of NaCl. The diffusivity increases with the increase of FeCl3 concentration up to 0.1 M and, thereafter, remains at a constant value up to 0.25 M of FeCl3.
The diffusivity of ferric complex ions as a function of ferric ion concentration at 90°C with 3 M NaCl and 1 M HCl is given in Figure 12. The diffusivity values measured at 50°C (Figure 11) are also shown for comparison. From the values at 50° and 90°C, the apparent activation energy is calculated to be about 4 kcal/mol, which is consistent with the activation energy calculated earlier for the effective diffusivity.
When the concentration of FeCl3 exceeds 0.2 M, mass transfer of ferric chlorocomplex through the product layer is no longer limiting the overall reaction as evidenced by the results shown in Figure 10. The reason for this behavior is not clear at this stage of investigation.
Leaching studies were performed at 1 M HCl and 0.1 M FeCl3, while the concentration of NaCl was varied over the range 0 to 3 M at 50° and 90°C. The values of 1/tcomp were evaluated from the plots of 1-3(1-α)2/3 + 2(1-α) versus time, and the results are plotted in Figures 13 and 14. As can be seen from these results, a minimum rate is attained when 0.5 M NaCl is added. Rate increases with higher additions of NaCl and, in the presence of 3 M NaCl, is more than twice as fast as the minimum.


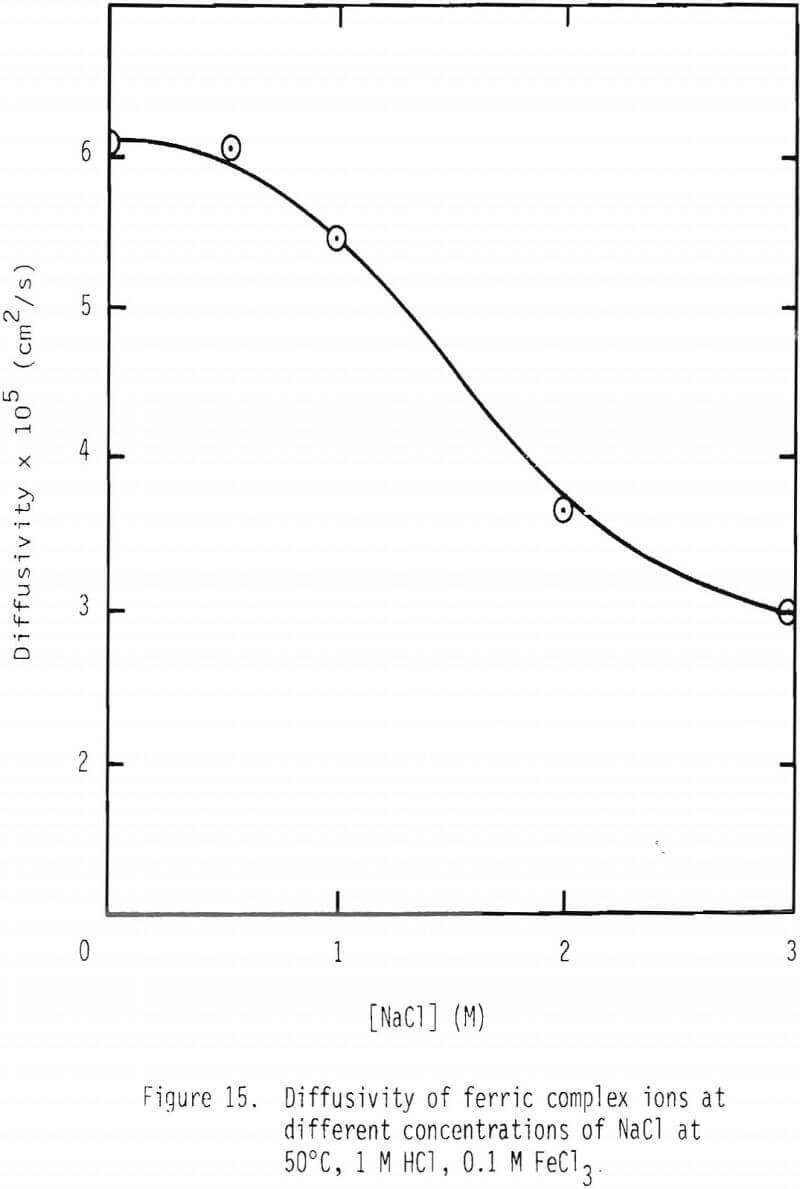
In the presence of 3 M NaCl, leaching rate is controlled by product layer diffusion. With NaCl concentrations less than 3 M, rate decreases with decreased NaCl concentration, and, thus, rate is apparently not controlled by product layer diffusion under these conditions. For product layer diffusion to be controlling in systems containing less than 3 M NaCl, the diffusivity of ferric chlorocomplexes would have to be affected in a manner similar to that of reaction rate. This is not the case (Figure 15). In fact, it is just the opposite. It is suspected that the solubility of lead chloride is low at low chloride concentration, particularly at the reaction interface inside the pores. It should be noted that under the conditions used in this study the solubility of lead chloride was not exceeded in the bulk solution.
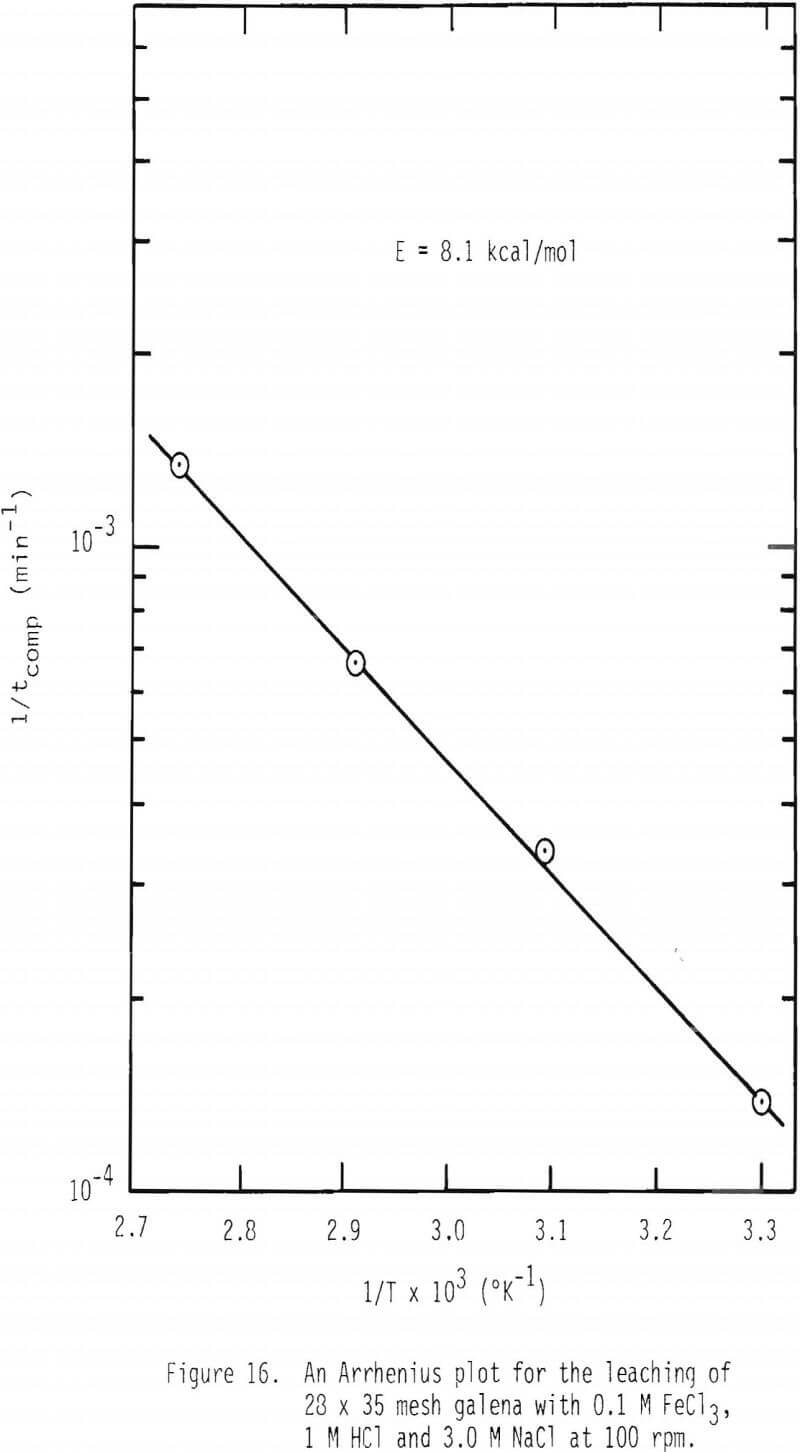
The effect of temperature on the rate of dissolution of galena was studied at 0.1 M FeCl3, 1 M HCl and 3 M NaCl and over the temperature range 30°-90°C. The values of 1/tcomp were calculated and plotted as a function of 1/T as given in Figure 16. The apparent activation energy was found to be about 8.1 kcal/mol which is more than what is expected for diffusion limiting processes. As discussed earlier, the apparent activation energy consists of two contributions, diffusion and the heat of reaction for the formation of ferric chlorocomplexes (see Equation 19). If the activation energy of diffusion, 4 kcal/mol, is combined with the heat of reaction, 3 kcal/mol, an overall activation energy of about 7 kcal/mol results. It should also be noted that if diffusion of lead chloride through the product layer were to control the overall leaching reaction, the apparent activation energy given by Equation 20 would yield a much higher value, about 11 kcal/mol. Also, if diffusion of lead chlorocomplex through the product layer is limiting, first order with respect to ferric chlorocomplex would not be observed. See Equation 1. In most cases, rate was found to be first order with respect to ferric chlorocomplexes.
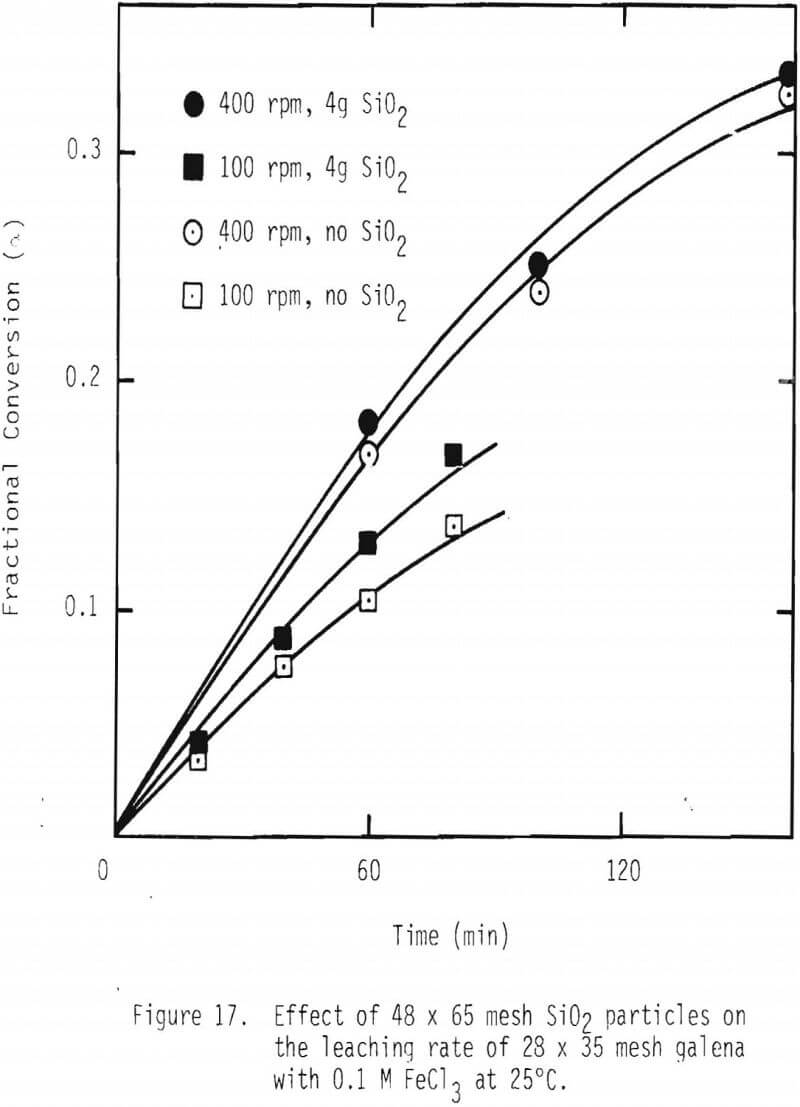
One way of improving the rate of leaching of galena would be to continuously remove the product layer, sulfur in this case. In order to examine whether removing the product layer would have a positive effect on the overall leaching rate, 1 g of galena (28 x 35 mesh) was mixed with 4 g of silica particles (48 x 65 mesh), and two stirring speeds of impeller, namely, 100 and 400 rpm, were used. See Figure 17. It is evident that the overall leaching rate is increased by attrition of the product layer. These results support the product layer diffusion control premise.
Ferric Nitrate System
Experimental Results and Discussion
Kinetic Considerations
Rate of dissolution of galena was examined first as a function of particle size. As shown in Figure 18, fractional conversion of galena increases substantially with decrease in particle size or increase in surface area. For example, after two hours of leaching, approximately 50 percent of the 14 x 28 mesh particles are dissolved, while complete dissolution of 48 x 65 mesh particles is effected.
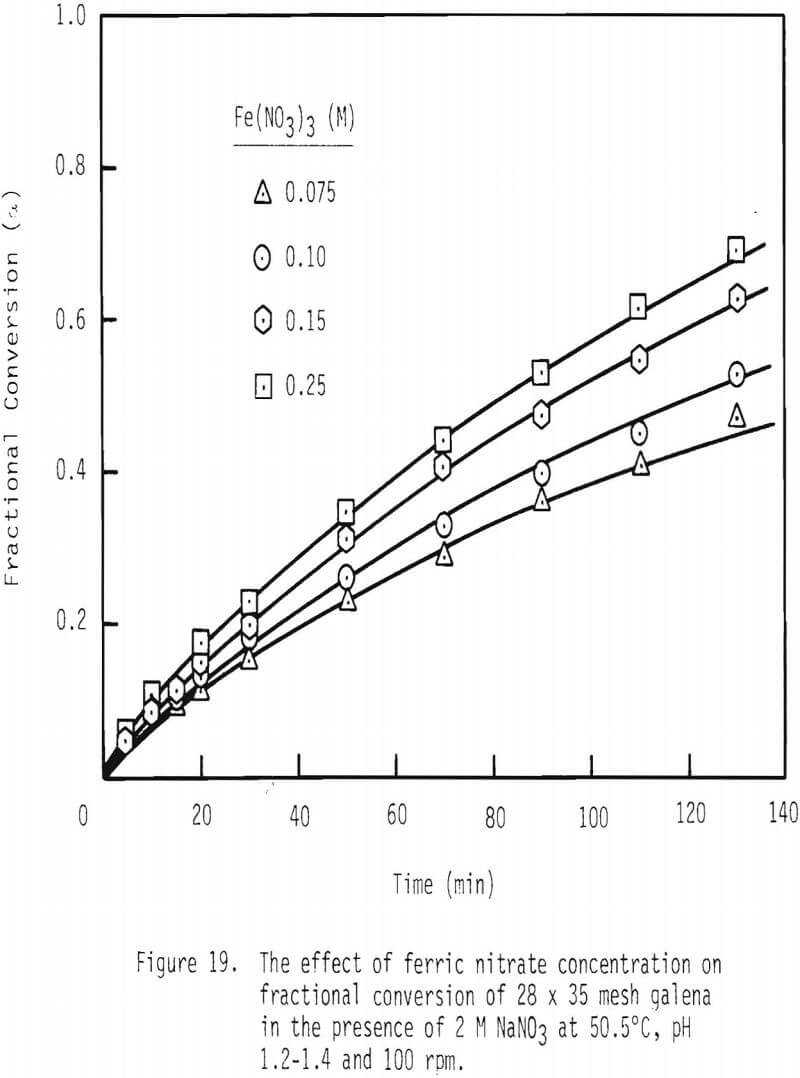
Next, fractional conversion of galena was established as a function of ferric nitrate concentration. See Figure 19. In the presence of 0.075 mole/liter ferric nitrate, fractional conversion is 0.43 after two hours of leaching. In the presence of 0.15 mole/liter ferric nitrate, fractional conversion is 0.60 after this same period of leaching.
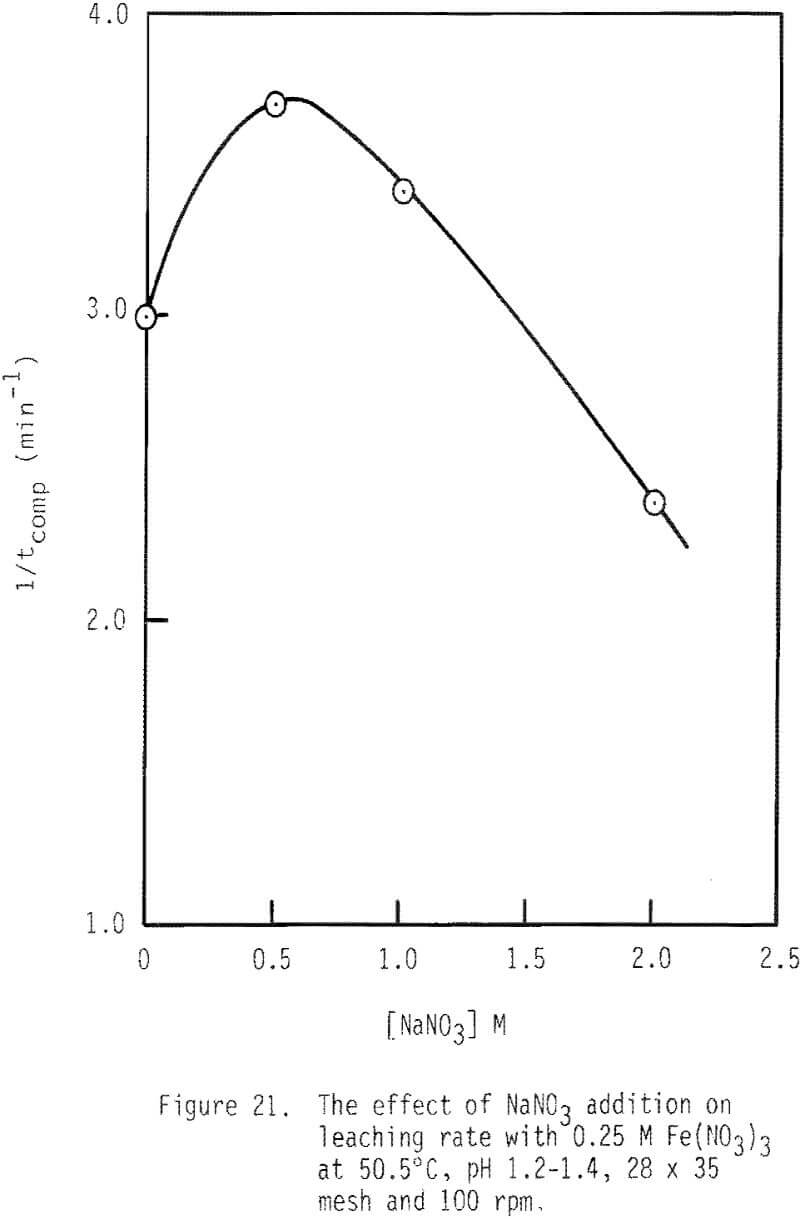
The effect of sodium nitrate on rate of leaching is presented in Figures 20 and 21. Leaching rate is increased with the addition of 0.5 M NaNO3 and then is decreased from that maximal value. After two hours of leaching, about 83 percent of galena is leached when 0.5 M NaNO3 has been added, while about 56 percent is dissolved when 2.0 M NaNO3 is added. The enhanced leaching rate observed with low additions of NaNO3 may be due to the added oxidation of galena by HNO3 under these conditions. The reduced rate of leaching with higher levels of NaNO3 may be due to the decreased activity of ferric ion associated with increased ionic strength.
Temperature of the system was also varied to examine the effect of temperature on the rate of galena dissolution. As shown in Figure 22, after two hours of leaching, about 40 percent of the galena is leached at 32.5°C, while complete dissolution is effected at 70°C.
In Table IV, three integrated rate equations for film diffusion, product layer diffusion and chemical reaction control were developed for the cubic system. The resulting equations are as follows:
for film diffusion,
t/tcomp = α………………………………………………………………(22)
for product layer diffusion,
t/tcomp = 1-3(1-α) + 1(1-α)………………………………………….(23)
for chemical reaction,
t/tcomp = 1(1-α) 1/3………………………………………………….(24)



where
α: fractional conversion
tcomp: time necessary for complete reaction
An integrated rate plot was constructed for the leaching of particles of various sizes. These results are shown in Figure 23 based on chemical reaction control. As can be seen, linear relationships are present for these particle sizes.
Another test for chemical reaction control is a plot of tcomp as an inverse function of initial particle size. If this relationship is a straight line passing through the origin, chemical reaction control is indicated. As shown in Figure 24, this phenomenon is observed.
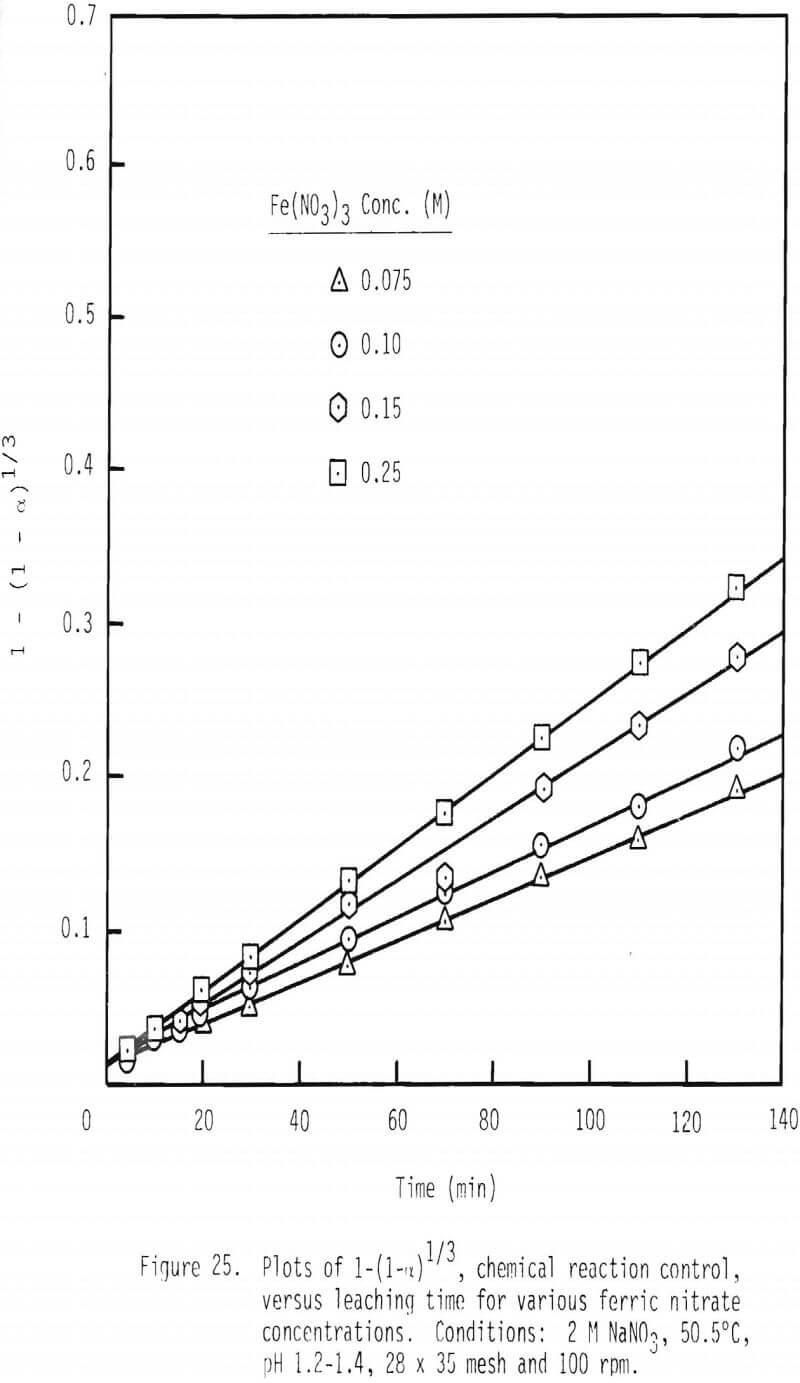
Further confirmation of this proposed mechanism is presented in the integrated rate plot for various ferric nitrate and sodium nitrate concentrations (Figures 25 and 26). Linear relationships can be noted for these additions of ferric nitrate and sodium nitrate. The fact that leaching rate decreases with increased levels of sodium nitrate, again, is probably due to a decrease in the activity of ferric ion with increased ionic strength.
When the logarithm of 1/tcomp is plotted as a function of the logarithm of ferric nitrate concentration, if pore diffusion is controlling, then a linear relationship of unit slope should be obtained. As shown in Figure 27, a linear relationship is obtained, but the slope is 0.48 as obtained by regression analysis. Pore diffusion is obviously not controlling in this system.
An integrated rate plot was constructed for the leaching of particles at various temperatures. As shown in Figure 28, linear relationships are present when the quantity 1-(1-α)1/3 is plotted as a function of leaching time.
An Arrhenius plot was made by plotting the logarithm of reaction rate constant, 1/tcomp, as a function of reciprocal temperature (Figure 29). The slope of this relationship provides the activation energy which in this case is 11.3 kcal/mol. This value is consistent with chemical reaction control.
Since electron exchange occurs at the reaction interface, the chemical reaction is electrochemical in nature. Since nitrate does not complex Fe+³, the cathodic reaction is the reduction of ferric ion to ferrous ion,
Fe+³ + e- → Fe+²………………………………………………(25)
The anodic reaction would be
PbS → Pb+² + S° + 2e-………………………………………….(26)
The dissolution of galena occurs through the establishment of




the corrosion couples shown in Equations 25 and 26 on the galena surface.
The rate model for galena dissolution can be obtained by using the Butler-Volmer equation for the anodic and cathodic half-cells in the above reactions,

Because galena is an electrical conductor, both the anodic and cathodic sites will have the same potential which is the mixed potential Em. Additionally, electrical charge conservation principles necessitate that
iaAa = -icAc………………………………………………………………..(29)
Furthermore, assuming a symmetrical energy barrier (Ba = Bc = 1/2) and that single-electron transfer (z = 1) is rate controlling, Equation 29 can be expressed as

Equation 30 can be rearranged to obtain an expression for the mixed potential

A mass balance on the total ferric concentration, [Fe(III)], requires that

where γFe+³ = activity coefficient of Fe+³. By substitution, therefore, into Equation 32,
αFe+³ = γFe+³[Fe(III)]……………………………………………..(33)
Equation 28 can therefore be written as,

The rate expression for the dissolution of galena can be derived
thus,
Rate = iaAa/NF………………………………………………………….(35)
Also,
Aa = faA
and
Ac = fcA………………………………………………………………….(36)
where fa and fc are the fractions of the total surface area which are anodic and cathodic, respectively, and A is the total surface area.
Substitutions involving Equations 27, 29, 34 and 36 yield an expression for rate,

As shown by Equation 37, rate should be proportional to the square root of ferric concentration. A value of 0.48, which is the order of reaction with respect to Fe+³, was found to be present in this system (Figure 26). This agreement provides additional evidence for chemical reaction control in this system.
Conclusions
The following conclusions can be drawn from the results of this study.
- Mass transport of ferric chlorocomplexes diffusing through the sulfur product layer on galena appears to be rate controlling when ferric chloride is added as oxidant in the presence of 3 M NaCl at 50° and 90°C. With NaCl additions less than 3 mol/liter, reaction rate appears to be limited by the solubility of lead chloride at the reaction interface.
- The effect of concentration of ferric chloride on the leaching of galena is pronounced up to about 0.2 mol/liter which is probably due to the increase of diffusivity with FeCl3 concentration. Above 0.2 M FeCl3, no increase in rate is observed at 50° and 90°C.
- The effect of NaCl on leaching rate of galena is moderate at 50°C. At 90°C, however, the effect on the leaching rate is very modest.
- The apparent activation energy of the overall leaching process with ferric chloride is 8.1 kcal/mol in which the contribution of increase in ferric chlorocomplex concentration accounts for about 2 kcal/mol.
- The apparent diffusivity of ferric chlorocomplex through the sulfur layer is calculated to be 5.2 x 10 -6 and 1.4 x 10 -5 cm²/s at 50° and 90°C, respectively.
- Chemical reaction control is observed in ferric nitrate leaching of galena.
- Electrochemical oxidation of sulfide and reduction of ferric ion occurs at the reaction interface when ferric nitrate is used as oxidant.
- The apparent activation energy in ferric nitrate leaching of galena is 11.3 kcal/mol.
- First order dependence of total ferric ion concentration is observed in ferric chloride leaching, while the order is 0.48 in ferric nitrate leaching.
