A kinetic investigation of copper cementation on iron was made to study the effects of deposited copper on the reaction rate. Both the copper deposit attached to the iron and slurried copper particles were considered. The revolving-drum reactor used in this study allowed some of the copper to remain attached to the iron and provided sufficient agitation to maintain a suspension of the abraded copper particles.
An earlier paper by the authors briefly described the effects of surface deposits, fluidized copper particles, and principal anionic species on copper cementation. This Bureau of Mines report includes a more complete presentation of an investigation of the kinetics of copper cementation carried out in a revolving drum precipitator, a description of some fundamental processes occurring during cementation, and a discussion of how the results were influenced by the deposited copper.
Theory
Cementation is the electrochemical process by which a more noble metal ion is precipitated from a solution of its salts by a metal higher in the electromotive series. The reaction for copper cementation by iron is represented by the following equation:
Cu+² + Fe° = Cu° + Fe+²……………………………………………………..(1)
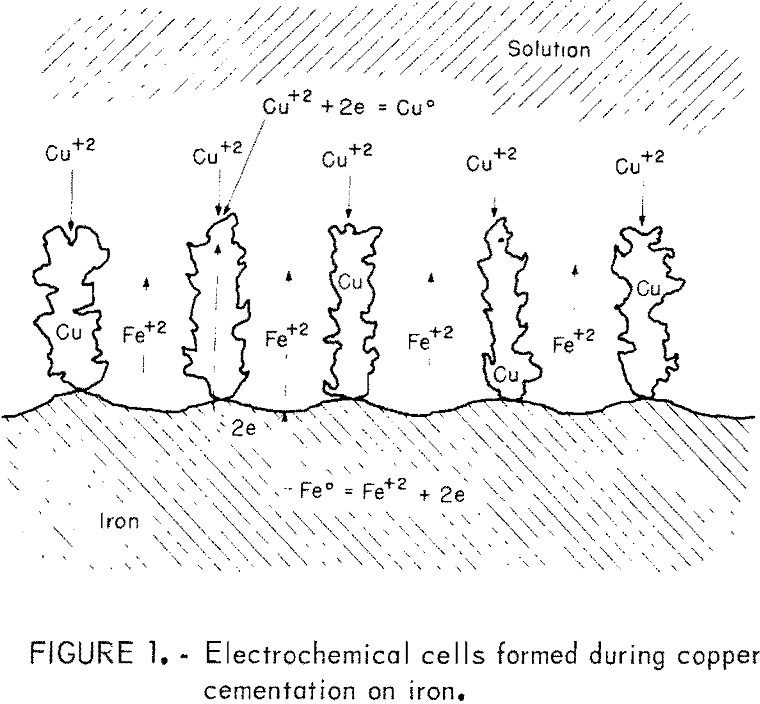
Enhancement of cementation rate has been observed in many experimental systems in which the cemented deposit has been described as loose, porous, or powdery. When a porous deposit is attached to the iron, the cementation reaction is visualized to proceed through a series of shorted electrochemical cells, as illustrated in figure 1. This view of cementation has been suggested by Rickard and Fuerstenau, Strickland and Lawson, Miller and Beckstead, and Fisher and Groves. After the initially smooth iron surface acquires a dendritic deposit, the situation pictured in figure 1 becomes operative. Cupric ions are transported to and reduced on the growing copper dendrites attached to the iron surface. The electrons required to reduce the cupric ion are transferred from the anodic site on the iron surface by conduction in the iron and deposited copper. Iron is oxidized to ferrous ions at the anodic sites, thus liberating the electrons necessary for cupric ion reduction. The solubilized iron diffuses into the bulk solution through the porous copper deposit. The growing copper deposit provides an increase in cathodic reaction area, which can amount to several times that of the originally smooth precipitant surface and which causes a proportional increase in reaction rate. Transport of cupric ions through a limiting boundary layer is thought to be the rate controlling process even in the presence of a significant deposit. This view of cementation applies to systems that produce a porous deposit. If the pores of the deposit become closed due to metal deposition, the reaction rate may be retarded instead of enhanced and the model of figure 1 will not be valid.
Strickland and Lawson have studied the effect of a deposit attached to the precipitant when copper is precipitated by zinc from a very dilute solution (5 to 20 ppm). They found that the surface remains smooth for deposit masses up to 0.3 mg/cm³ and that no rate enhancement results from such a deposit. As the deposit mass increases from 0.3 to 5 mg/cm², the apparent rate constant increases to a maximum value at 5 mg/cm³. There is no further increase in rate constant up to deposit masses of at least 12 mg/cm³. Miller and Beckstead observed similar phenomenon with copper cementation on iron and found that as they increased the initial copper concentration from 5 to 200 ppm, there was an increase in rate constant to a maximum value at 200 ppm. When the initial concentration was raised about 200 ppm, they observed a decrease in rate constant. They also observed that a smooth deposit developed in very dilute solution (5 to 10 ppm) and that no rate enhancement was apparent.
In a cementation system having high copper concentration (>500 ppm), the steady-state deposit masses observed by Strickland and Lawson and Miller and Beckstead will develop very quickly. The porous copper deposit will break away from the surface as discrete particles of copper when there is adequate agitation and/or abrasion. If cementation is carried out for a sufficiently long time, a slurry of cement copper particles will develop, which will be fluidized to a greater or lesser extent depending upon solution flow and/or agitation. As previously reported, the cement copper slurry is visualized to form a fluidized electrode surrounding the iron precipitant. A fluidized electrode is a slurry of electrically conducting particles that are fluidized around an electrode. The constantly moving particles collide with one another and with the electrode. Each time a particle contacts the electrode, electrons can be transferred from the electrode to the particle or vise versa. At the instant of contact, the particle effectively becomes part of the electrode. The large surface area provided by the slurry of fluidized particles increases the effective area of the electrode. The concept of a fluidized electrode for electrolytic reactions has been reported and has recently been applied to electrowinning copper from dilute solution.
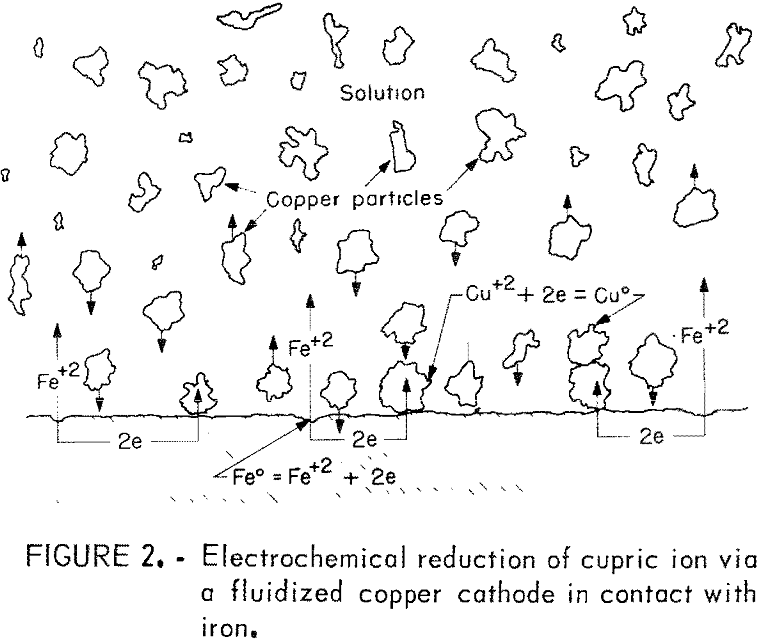
Figure 2 illustrates the essential features of the fluidized cathode condition prevailing in a copper cementation system. In this system, iron dissolves at an anodic site on the surface and one atom of dissolving iron releases two electrons. These electrons are conducted to a cathodic site on the surface and, when contacted by a fluidized copper particle, the electrons are transferred to the particle, which becomes cathodically charged. Cupric ions are then discharged at the surface of charged copper particles. The many fluidized particles in a cementation system provide a large surface for the discharge of cupric ions and the effect noted is an enhancement of the reaction rate. Also, in the extreme case with an overabundance of cathodic particles, it is conceivable that the discharge of cupric ions may not be the rate-limiting step of the reaction. The rate may be dependent on the dissolution of the iron and the release of electrons or the transfer of electrons for the copper reduction.
Back has described a commercial-scale, fluid-bed system for copper cementation in which the precipitant is particulate iron (minus 35-mesh)
fluidized by copper-bearing solution flowing up through the reactor. This system not only utilizes the effectiveness of high-specific-surface-area iron and the mixing necessary to reduce the role of diffusion, but also takes advantage of the fluidized cement copper cathode that is generated in the reactor. The fact that this system is capable of greater than 99-percent copper recovery even when only 1 percent of the original iron is left for precipitation can be explained by the fluidized cathode mechanism.
Experimental Procedure and Apparatus
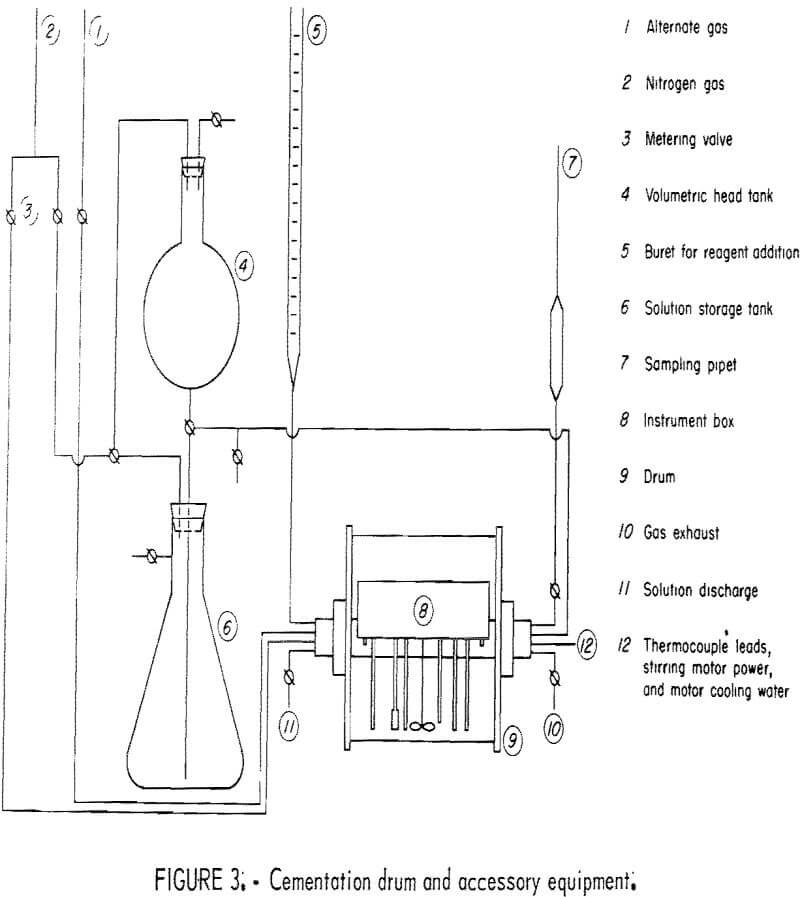
The cementation experiments were conducted in the revolving drum system illustrated in figure 3. The acrylic plastic drum was equipped with an internal instrument box containing a stirring motor, solution sampling system, gas-solution inlets and outlets, temperature sensor, pH electrodes, and a sample drop system. The instrument box, drum shaft, and other metal parts exposed to the drum atmosphere or solution were covered with a chemical-resistant paint.
The drum rotation was controlled by a variable-speed motor and could be varied from 0 to 60 rpm. The standard drum rotation was 40 rpm. Solution agitation in the drum was accomplished by a three-blade glass impeller connected to a variable-speed (0- to 3,000-rpm) stirring motor housed in the instrument box. The standard stirring agitation was 880 rpm. The temperature of the system was maintained at a constant value by partially submerging the drum in a controlled-temperature water bath. The temperature of the bath was controlled to within ±0.1° C. The standard experimental temperature was 30.0° C.
Preliminary tests in the drum reactor showed that the most suitable shape for the precipitant was a cylinder having a length several times its diameter. Since ordinary finishing nails met the shape requirement, are a low alloy steel, and are readily available in large quantities, sixpenny finishing nails were chosen as the primary iron precipitant. The standard quantity of precipitant for each test was 40 sixpenny finishing nails having a mass of 67.8 grams. When a variation from this standard was used, it is noted in the text.
The solutions used in this work were prepared from distilled water and reagent-grade chemicals. Except where specifically noted, the standard initial solution contained 0.0315 M CuSO4 (2.0 grams per liter Cu+²), 0.05 M H2SO4. and 0.0747 M Na2SO4. The ionic strength of this solution was 0.5 M. When the concentration of CuSO4 or H2SO4 was varied, the concentration of Na2SO4 was adjusted to maintain the ionic strength at 0.5 M.
Most tests were carried out using the following operating procedure:
The sixpenny finishing nails were loaded into the sample drop system inside the drum through an inspection port in the end of the drum; the drum was then sealed. The drum and test solution were brought to the desired test temperature in the water bath and were purged with nitrogen gas. The test solution was pumped to a head tank of known volume (3.25 liters) then allowed to flow by gravity into the drum. The rotational speed of the drum was adjusted to 40 rpm, the gas purge was stopped, and the internal solution agitation was adjusted to 880 rpm. The test was initiated by dropping the iron precipitant into the solution. Samples of solution were extracted from the drum at specific times with a vacuum sampling system and were analyzed for Cu+² ion using an atomic absorption spectrophotometer. Deviations from this procedure are noted in the text.
Results and Discussion
The complexity of cementation in the revolving drum made it difficult to isolate one variable for study. There were at least three closely related variables over which there was no control. The developing deposit of cement copper attached to the iron surface provided a reaction surface that increased in area during the experiment. The character of this deposit changed from one experiment to another due to the changes in solution composition and temperature. These variables created additional changes in deposit surface area (surface roughness), which were not related to the change caused by growth of the deposit mass on the surface. The fluidized cathode created by copper particles in the solution surrounding the iron precipitant produced an ever-changing cathodic area for cementation. The discrete particles also were affected by variables that changed the deposit character. These interrelated effects due to the deposit of cement copper were always present in the system. Even for a single experiment, changes in the deposit were evident; therefore, it was necessary to establish the characteristics and the extent of these effects before other system variables could be discussed. The order of data presentation reflects this need.
Experimental Precision
The experiments reported in this study required considerable preparation, relatively large quantities of stock solutions, and numerous chemical analyses. Thus, it was desirable to establish the limit of experimental precision so that duplicate or triplicate tests were necessary only occasionally to check the experimental precision. The experimental precision was established by performing three or more tests under nearly identical conditions. This was done for several sets of experimental conditions to establish a wide range for the experimental precision. The average percent probable errors from the mean was found to be 3.3, with a maximum observed percent probable error of 6.9. In the discussion that follows, the phrase “within expected experimental error” means that the deviation between experiments was less than 3.3 percent.
Pretreatment of the Iron Surface
One possible variable in any cementation system is the condition of the precipitant surface. The presence of chemical films on the surface could interfere significantly with the cementation process. In order to determine possible variations due to surface condition, the iron precipitant was cleaned by three different techniques prior to cementation. The treatments used were (1) washing with methyl alcohol for 5 minutes, followed by drying in air; (2) cleaning with 0.5 M H2SO4 for 5 minutes, washing with distilled water, washing with methyl alcohol, and drying in air; and (3) reaction with a solution containing 0.08 M CuSO4 (5 grams per liter Cu+²) and 0.25 M H2SO4 for 10 minutes, washing in distilled water, washing in methyl alcohol, and drying in air. The precipitants from these three treatments were used along with untreated nails in otherwise identical cementation tests to determine the effect of surface condition. The initial solution for these tests contained 0.0315 M CuSO4 (2 grams per liter Cu+²) and 0.05 M H2SO4. The other experimental conditions were those described for a standard test. The deviation between the results of the four tests was within expected experimental error. Therefore, this system using sixpenny finishing nails as a precipitant was assumed not to be sensitive to the condition of the iron surface. All subsequent tests were performed with nails washed with methyl alcohol and dried in air. This treatment was used as a precaution against contamination introduced during handling.
The Fluidized Cathode Effect
Preliminary experiments in a revolving-drum system similar to the one used in this study produced a cementation rate much greater than that expected for a reaction controlled by diffusion of cupric ion to the iron surface. A significant feature of this system that made it different from other experimental cementation systems (rotating disks and cylinders, stationary plates in a stirred solution, etc.) was that it contained a large amount of cement copper, which formed a fluidized slurry around the iron precipitant. The concept of a fluidized electrode was just emerging at this time for electrolytic reactions, and it offered a reasonable explanation for the unusually high cementation rates that had been observed. The cementation study reported in this paper was designed specifically to examine the effects of a fluidized copper cathode surrounding the iron precipitant and a copper deposit attached to the iron surface.
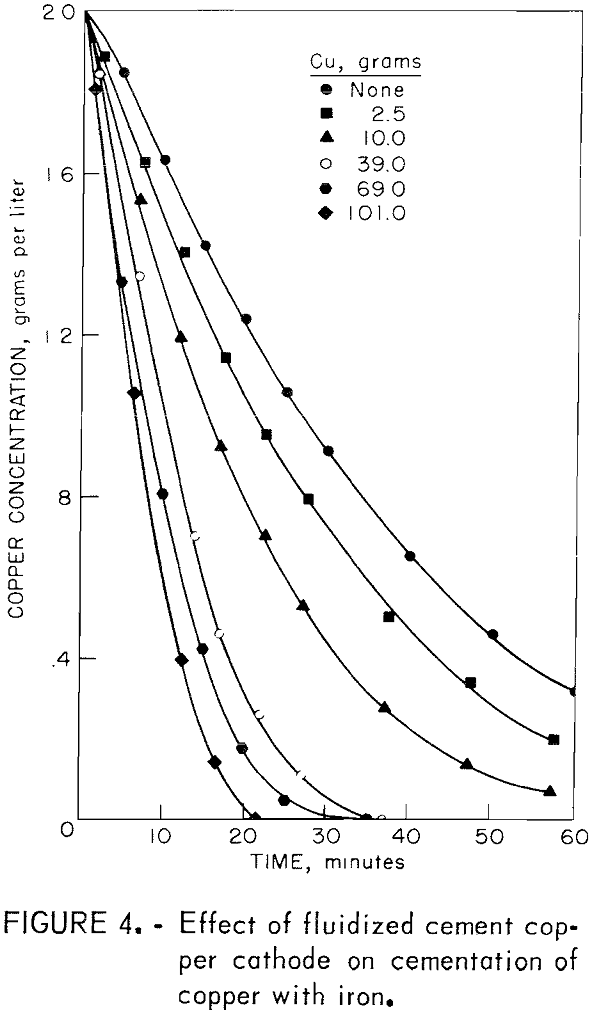
A fluidized copper cathode was produced in the cementation drum by introducing different quantities of cement copper into the drum along with the initial solution. All of the experiments in this series were performed using the standard experimental conditions except for the addition of cement copper.
The cement copper was prepared in the following manner: Commercial cement copper was upgraded by flotation, filtered, dried at 100° C, and screened through a 325-mesh screen. This material was contacted with a large volume of the solution to be used in the cementation tests. There was a significant dissolution of cement copper even in the absence of air; thus, the copper content of the solution in contact with the cement copped increased. For this reason, the cement copper was contacted repeatedly with fresh solution to achieve a solution composition close to that to be used in the cementation test. These precautions were not completely successful since the copper concentration in the drum prior to each experiment was found to be 2.1 to 2.5 grams per liter, which was significantly higher than the target value of 2.0 grams per liter. Consequently, the experimental data were adjusted so that the reported initial copper concentration was 2.0 grams per liter. This was accomplished by simply shifting each copper-concentration versus-time curve until the 2.0 gram-per-liter point of the curve coincided with the ordinate (time = 0). The required shift along the time coordinate ranged from 2.5 to 3.5 minutes.
The results of these experiments are illustrated in figure 4, which is a plot of copper concentration against time. The striking increase in cementation rate as cement copper is added to the system is attributed to the increase in cathodic reaction area, as described in the discussion of cementation theory.
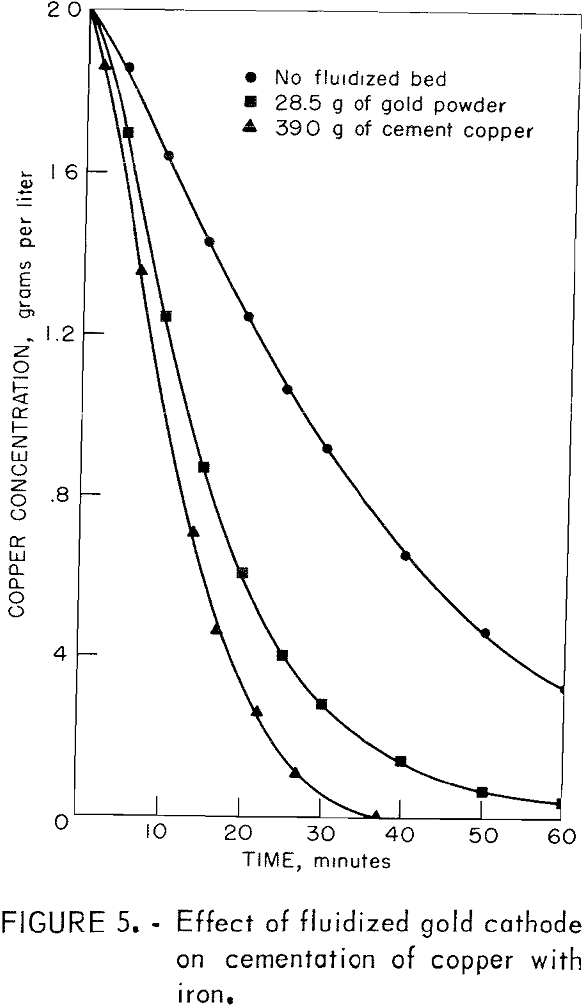
The ability of the fluidized cathode to enhance the cementation rate was further demonstrated when gold powder was substituted for the cement copper. In this system, gold remains inert; thus, the presence of a copper deposit on the gold particles would clearly indicate deposition of copper on the fluidized cathode particles. Figure 5 illustrates the result of this experiment and shows a comparison with experiments in which there were (1) no cement copper and (2) 39.0 grams of added cement copper. A comparison of the middle line with the top line shows that the fluidized gold cathode enhanced the rate of cementation. Comparison of the middle line with the bottom line shows that the rate enhancement from 28.5 grams of gold powder was not quite as great as that obtained with 39 grams of cement copper.
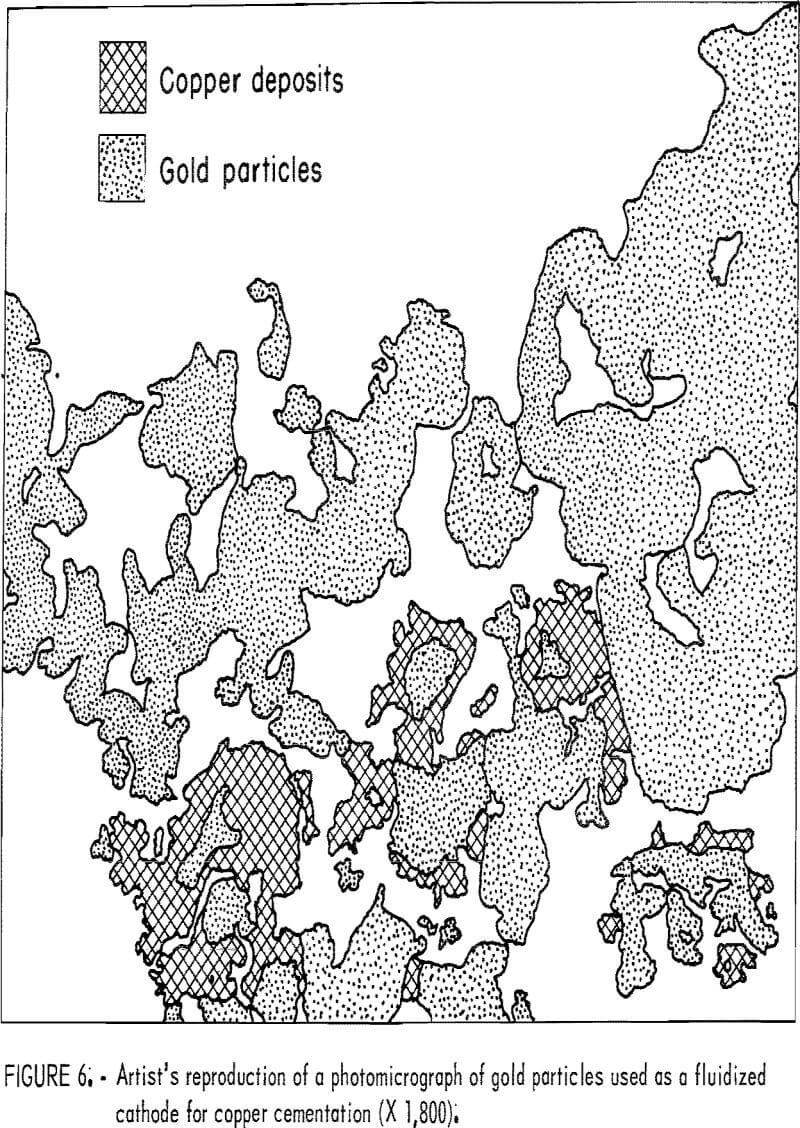
Samples of the product taken from the drum after the cementation test were copper-colored and showed no trace of gold. A portion of the product was mounted in plastic, polished, and examined under a microscope. Copper was found to be in intimate contact with the gold particles as illustrated in figure 6, which is an artist’s reproduction of a color photomicrograph of the gold particles. Such intimate contact is interpreted as electrochemical precipitation of copper on the conducting gold particles.
It was noted during the fluidized cathode experiments that as the quantity of added cement copper was increased from 0 to 101 grams, the deposit attached to the iron decreased quickly until the iron was completely free of copper. This observation suggested the possibility that the cement copper slurry was acting as an abrasive to produce a deposit-free surface and that the enhancement in cementation rate was due to reaction of the cupric ion with the “clean” iron surface rather than by the fluidized cathode mechanism. The possibility that abrasion of the deposit from the iron surface was responsible for the rate enhancement could easily be tested by purposely adding a nonconducting abrasive to the system and observing the effect.
To test this point of view, experiments were performed in which quartz sand was substituted for cement copper. Two types of sand were used for these tests. One was minus 20- plus 28-mesh natural sand, which had relatively smooth, rounded grains. The other was minus 20- plus 28-mesh crushed quartz,
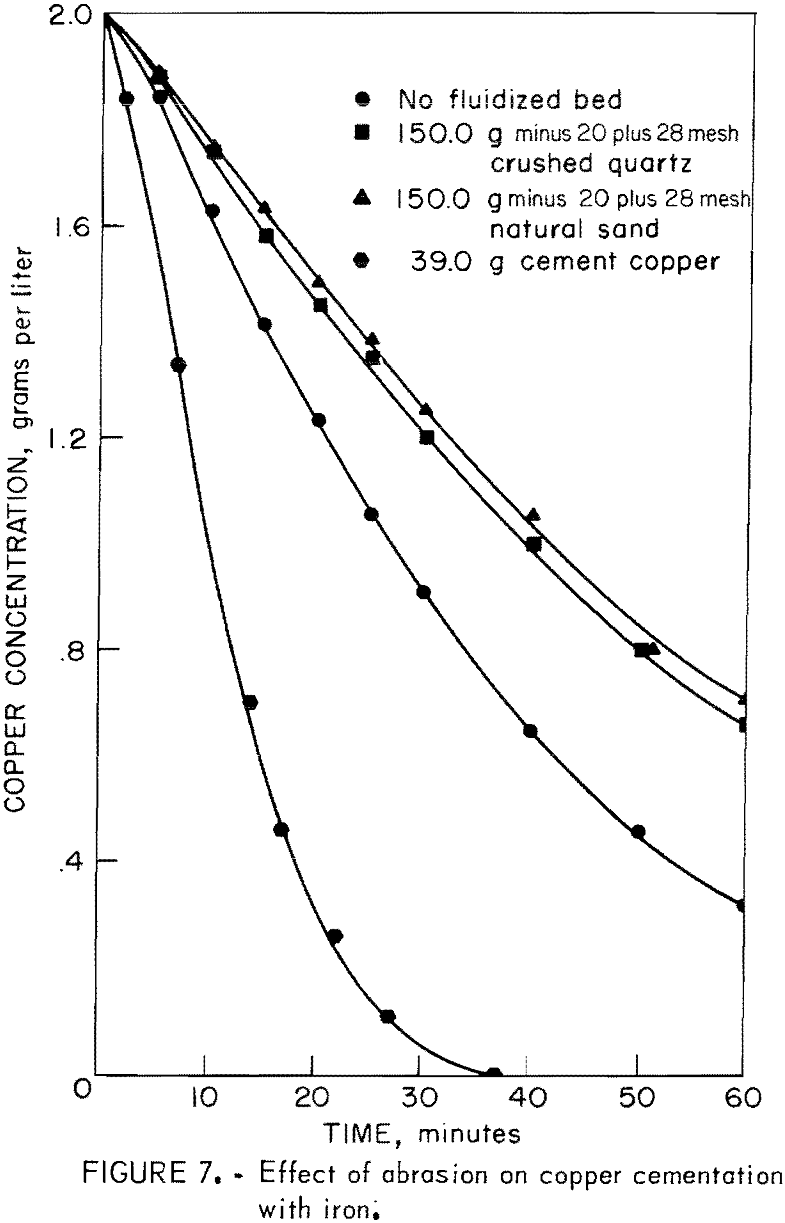
which had sharp, angular grains. Figure 7 illustrates the retardation of cementation rate caused by abrasion of copper from the iron surface. This figure includes the results of experiments in which there was no additive and 39.0 grams of cement copper added in place of quartz abrasive. Abrasion of the copper from the surface is apparently not responsible for the rate enhancement noted in the tests in which cement copper was added to the system.
This portion of the investigation showed that cement copper particles can form a fluidized cathode around the iron precipitant and cause a several fold increase in the cementation rate. The increase in cementation rate is interpreted as being due to the increase in cathodic reaction area provided by the copper particles. As shown, also, in the tests using gold powder, rate enhancement can be achieved by using other conducting particles for the fluidized cathode. The iron surface in the presence of a sufficient quantity of fluidized cathode remains free of copper deposit. Removal of the copper deposit from the iron surface by quartz abrasive was found to retard the cementation. Thus, the creation of a deposit-free surface by a fluidized cathode is not responsible for rate enhancement. The enhancement is due to the increase in cathodic reaction area.
The Effect of Initial Copper Concentration
Several investigators have observed and reported that the apparent rate constant for cementation increases as the initial copper concentration increases. This effect has been associated with the deposit of copper attached to the precipitant surface. Strickland and Lawson showed that the limiting effective deposit mass for copper cementation on zinc from a very dilute solution (20 ppm) was about 5 mg/cm². Similarly, Miller and Beckstead observed that the limiting effective deposit was achieved in their system with an initial copper concentration of 200 ppm and that higher concentrations caused a decrease in the apparent rate constant.
Preliminary experiments in this laboratory with initial copper concentration as a variable showed that the apparent rate constant continued to increase up to initial concentrations of 20 grams per liter. Additional experiments were undertaken to better define the preliminary findings. These experiments were performed by varying the initial copper concentration between about 0.10 and 10.0 grams per liter. Over the concentration range of 0.10 to 5.0 grams per liter, the ionic strength was held constant at 0.5 M by adding Na2SO4. When the initial copper concentration was greater than 5 grams per liter, no Na2SO4 was added to the solution, and the ionic strength increased above 0.5 M. No attempt was made to correct the data for variation in ionic strength. All of the solutions contained 0.05 M H2SO4. A nitrogen atmosphere was used, and the temperature was held constant at 30.0° C.
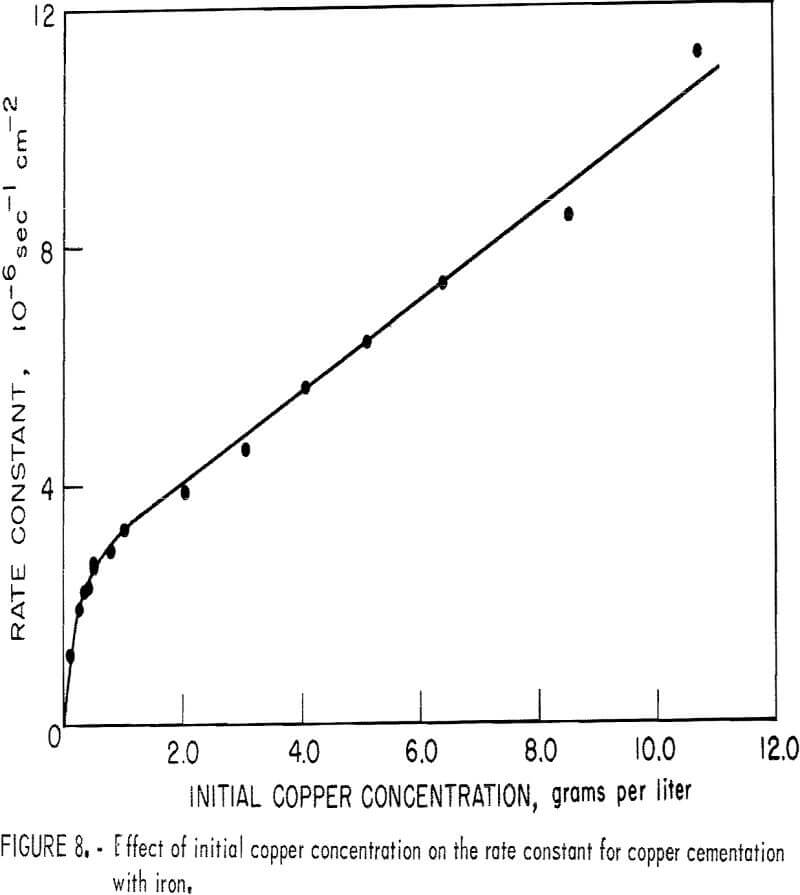
Figure 8 is a plot of the apparent rate constant (see equation 3) versus initial copper concentration. This illustration clearly shows two distinct phenomena:
- Below about 0.25 gram per liter, the increase in apparent rate constant is attributed to the increase in the mass of deposit growing on the surface. The region from 0.25 to 1.0 gram per liter is a transition region.
- Above 1.0 gram per liter the influence of the slurry of cement copper becomes significant enough to begin contributing to the increase in rate constant. As the fluidized cathode increases, less and less cement copper is observed to adhere to the iron surface.
Qualitatively, the quantity of copper adhering to the iron surface is an index for distinguishing between the fluidized cathode mechanism and the attached deposit mechanism. When the fluidized cathode mechanism is the predominant method of cementation, the surface is observed to be completely free of cement copper. In the revolving-drum system, the iron surface was free of cement copper at initial copper concentrations from 3 or 4 to 10 grams per liter.
The results of this portion of the study show that the effect of a deposit attached to the precipitant surface and a fluidized cathode of copper particles surrounding the iron cannot be ignored in interpretation of cementation results in this system. An analysis of a typical cementation test utilizing these facts should be helpful in interpreting subsequent results.
Analysis of a Typical Experiment
Cementation in the revolving-drum system is a pseudo first-order reaction that generally follows the experimental rate law illustrated by equation 2.
-d[Cu+²/dt] = k [Cu+²]…………………………………………………………………..(2)
Integration of equation 2 between the limits [Cu+²] = Ci at t = o and [Cu+2] = C at t yields equation 3, which represents a straight line passing through the origin and having a slope equal to the apparent rate constant k.
ln C/Ci = kt………………………………………………………………….(3)
If experimental data conform to the linear relationship represented by equation 3, the reaction rate is said to be first order with respect to cupric ion concentration.
The rate law illustrated by equation 2 implies that there is only one variable in the cementation system. Actually, there may be other variables, which are more or less constant during one experiment and are lumped together in the apparent rate constant. In fact, any unknown factor in the experimental study will be included in the apparent rate constant. When ln C/Ci is
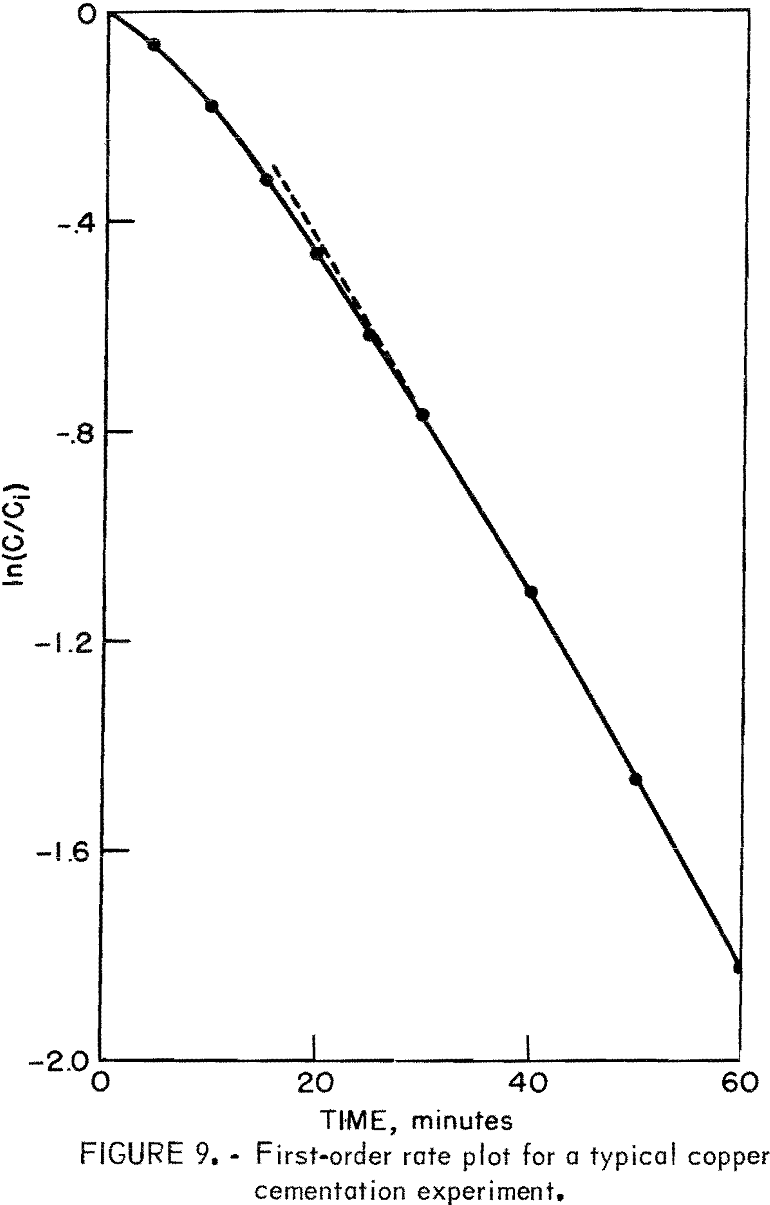
plotted against t for a cementation experiment, deviations from linearity indicate that the reaction is either not first order with respect to copper concentration or that one of the variables included in the rate constant is not constant with respect to time.
Figure 9 is a first-order plot for a typical cementation experiment at an initial copper concentration of 2 grams per liter. The slope of the curve fitted to the data points changes continuously from the beginning of the test to about 25 minutes. Linearity is only apparent for reaction times greater than about 25 minutes. The apparent rate constants = used in figures 8, 10, and 14 were determined from first-order rate plots similar to that shown in figure 9 using only the linear portion of the curves (times greater than about 25 minutes).
The shape of the curve in figure 9 can be explained by the changes with time of the copper deposit that develops on the iron surface and the fluidized cathode that forms around the iron precipitant. The discussion that follows is a combination of visual observation during an experiment and the theoretical mechanisms involving a porous deposit attached to the iron and fluidized cathode of copper particles.
As the iron first contacts the copper-bearing solution, cupric ion precipitates on the smooth, deposit-free iron surface. The initial copper deposit is smooth and has the appearance of a polished copper surface. The cementation process during this period is analogous to that described by other authors. After a very short period of reaction (3 to 5 minutes), the smooth deposit begins to break away from the surface as thin sheets of copper. The disruption of this deposit is possibly caused by the buildup of hydrogen gas under the deposit and the abrasion created by the tumbling of the nails.
The smooth deposit is rapidly replaced by a porous dendritic deposit and results in an increase in cathodic reaction area. This is apparent on the first-order plot as an increasing rate constant (steepening curve slope), which begins to be effective at about 5 minutes of reaction. The growing porous deposit now begins to be dislodged from the surface as small particles of cement copper. The amount of deposit on the surface and the porosity (roughness) of the deposit continue to change causing a continued increase in cathodic reaction area until about 20 to 25 minutes of reaction. At this point, a steady state develops between the deposit growth and the abrasion of the deposit from the surface. This is represented by the linear, first-order portion of the curve. The initial copper concentration for the experiment illustrated in figure 9 was 2 grams per liter. The fluidized cathode produced from this solution is present to a limited extent and probably has only a minor enhancing effect on the reaction rate. At initial copper concentrations above 2 grams per liter, the fluidized cathode mechanism plays an increasingly important role; above 4 to 5 grams per liter, the fluidized cathode is probably the dominant cementation mechanism.
Ionic Strength
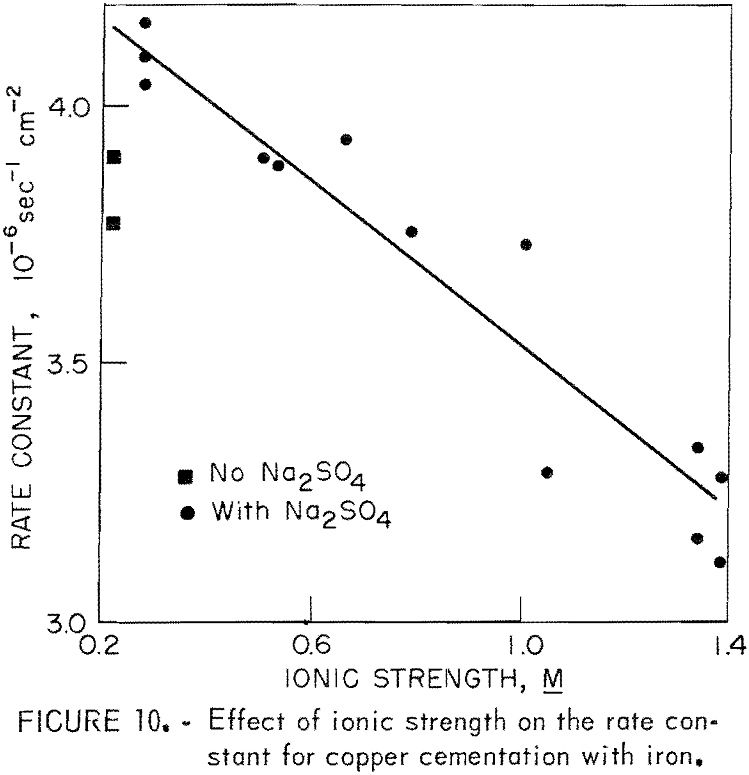
The principle difficulty encountered in reproducing cementation tests was the variation in the character of the surface deposit. This was particularly difficult when ionic strength was studied as a variable. Ionic strength was examined as a variable by adding Na2SO4 to a solution and maintaining the Cu+² and H2SO4 concentrations constant. The ionic strength was varied from 0.278 M to 1.390 M using this technique. At the lowest ionic strength, no Na2SO4 was added to the acid-CuSO4 solution. The absence of sodium was observed to cause a decrease in rate constant. This phenomenon was observed, though not explained, by other authors. Miller and Beckstead observed that deposits produced in the presence of Na2SO4 were more porous than those produced in the absence of Na2SO4. Our observations, although not as quantitative as those of Miller and Beckstead, are the same.
Figure 10 illustrates the effect of ionic strength and the decrease in rate constant caused by the absence of sodium. The solutions for this series of tests contained 0.0315 M CuSO4 (2.0 grams per liter Cu+²), 0.05 M H2SO4, and varying concentrations of Na2SO4. The other experimental conditions were the same as those for a standard test. The experimental precision in this part of the study was not as good as had been expected. The wide scattering of data is attributed to the changes in deposit character, which were beyond experimental control. Essentially, the rate constant decreases with increased ionic strength. The change in reaction rate as a function of ionic strength can be attributed to the decrease in activity of Cu+² ion as ionic strength is increased.
Surface Area and Iron Composition
The effect of iron surface area was first investigated by changing the number of nails used as the precipitant. The surface area was varied by a factor of four using this technique. With the exception of the change in quantity of precipitant, these experiments were carried out using the standard initial solution and standard test conditions. Table 1 illustrates the first-order nature that surface area exerts on cementation. The low value of rate constant at the smallest surface area is attributed to a decrease in the extent of the fluidized cathode around the iron.
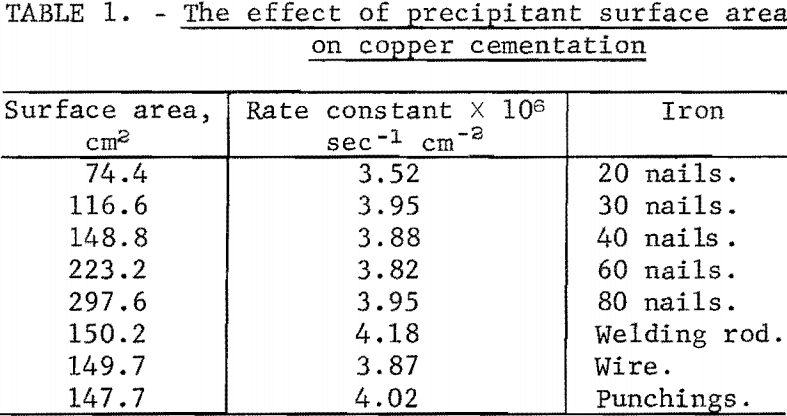
In addition, surface area was investigated by changing the iron shape and type. The precipitants used in place of nails were (1) sections of 1/8-inch- diameter mild steel welding rod 2 inches long,” (2) sections of 1/8-inch – diameter iron thermocouple wire 2 inches long, and (3) 3/8-inch-diameter punchings from ¼-inch mild steel plate. Table 1 also lists the results of these tests, which again illustrates the first-order nature of surface area.
Atmosphere
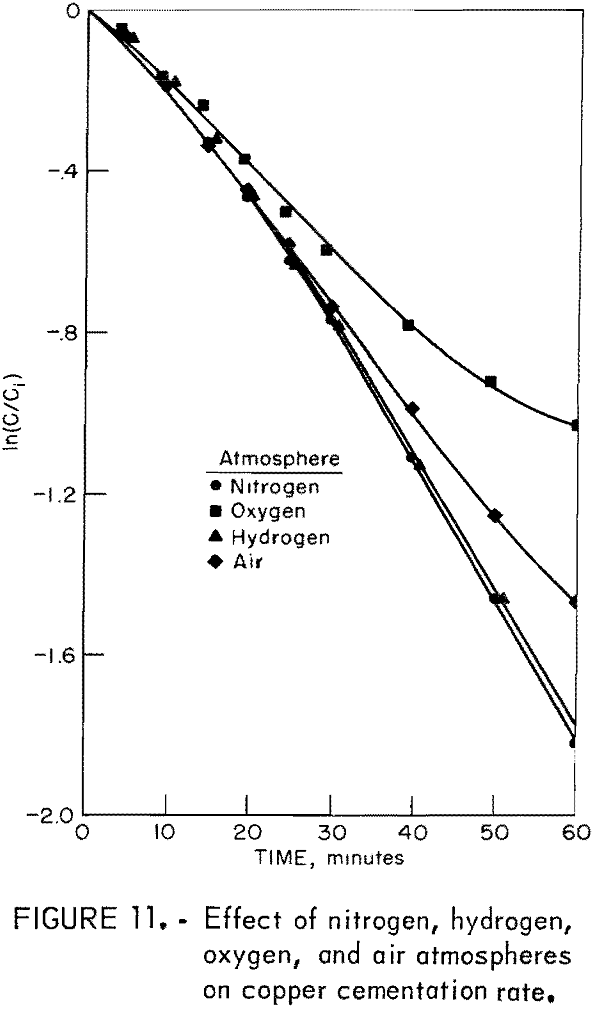
The effects of neutral, reducing, and oxidizing atmospheres were determined by using drum atmospheres of nitrogen, hydrogen, oxygen, and air. Other experimental conditions were those used in a standard test. Figure 11 illustrates the results of these experiments.
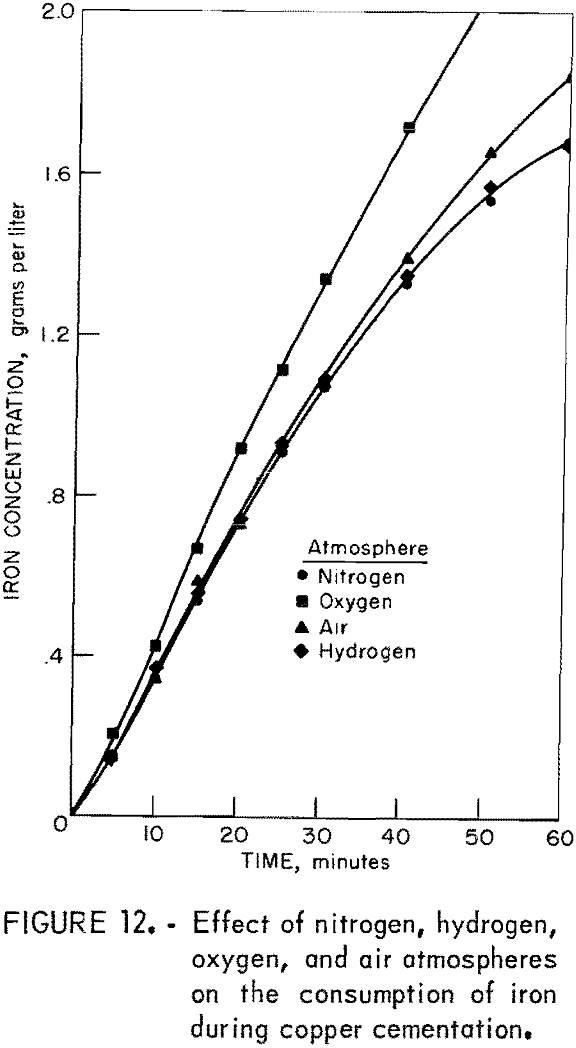
The reducing capacity of hydrogen is not utilized in this cementation system. A hydrogen atmosphere produced results similar to those obtained with a nitrogen atmosphere. Oxygen in the cementation system caused a decrease in reaction rate and an increase in iron consumption. The change in iron consumption is illustrated in figure 12.
The decrease in reaction rate attributed to oxygen and air is only an apparent decrease. Actually, the cementation rate is the same as that demonstrated by hydrogen and nitrogen atmosphere tests. Ferric ion produced by oxygen oxidation of ferrous ion reacts with cement copper to create additional cupric ion in solution. Consequently, there is more cuprice ion to
precipitate rather than a reduction in cementation rate. This situation is illustrated by reactions 4, 5, and 1:
2Fe+² + ½O2 + 2H+ = 2 Fe+³ + H2O………………………………………………….(4)
2 Fe+³ + Cu° = 2 Fe+² + Cu+²…………………………………………………………….(5)
Cu+² + Fe° = Cu° + Fe+²……………………………………………………………………(1)
The anomalous iron consumption shown by figure 12 is due to this sequence of the reactions.
This portion of the investigation clearly indicates that oxygen should be excluded from the cementation system, especially at low cupric ion concentration (low reaction rate).
The Effect of pH
Several experiments were performed to determine the effect of pH on the copper cementation system. The solutions for these tests contained 0.0315 M CuSO4 (2.0 grams per liter Cu+²), various concentrations of H2SO4, and the quantity of Na2SO4 necessary to adjust the ionic strength to 0.5 M. The other experimental conditions were the same as those for the standard test.
The hydrogen ion activity was significantly affected by the concentration of sulfate in the test solutions as evidenced by the data in table 2. Therefore, the reported pH is not a good measure of hydrogen ion concentration in this system.
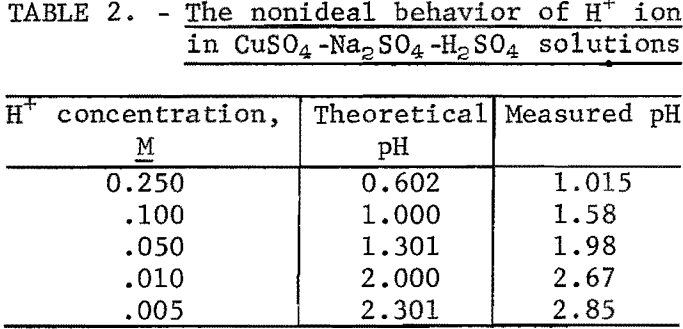
Table 3 is a comparison of rate constants at different pH values. There appears to be little variation in rate over the pH range 1.58 to 2.67. However, an increase above or a decrease below this range results in an increase in reaction rate. The same general effect was observed by Biswas and Reid.
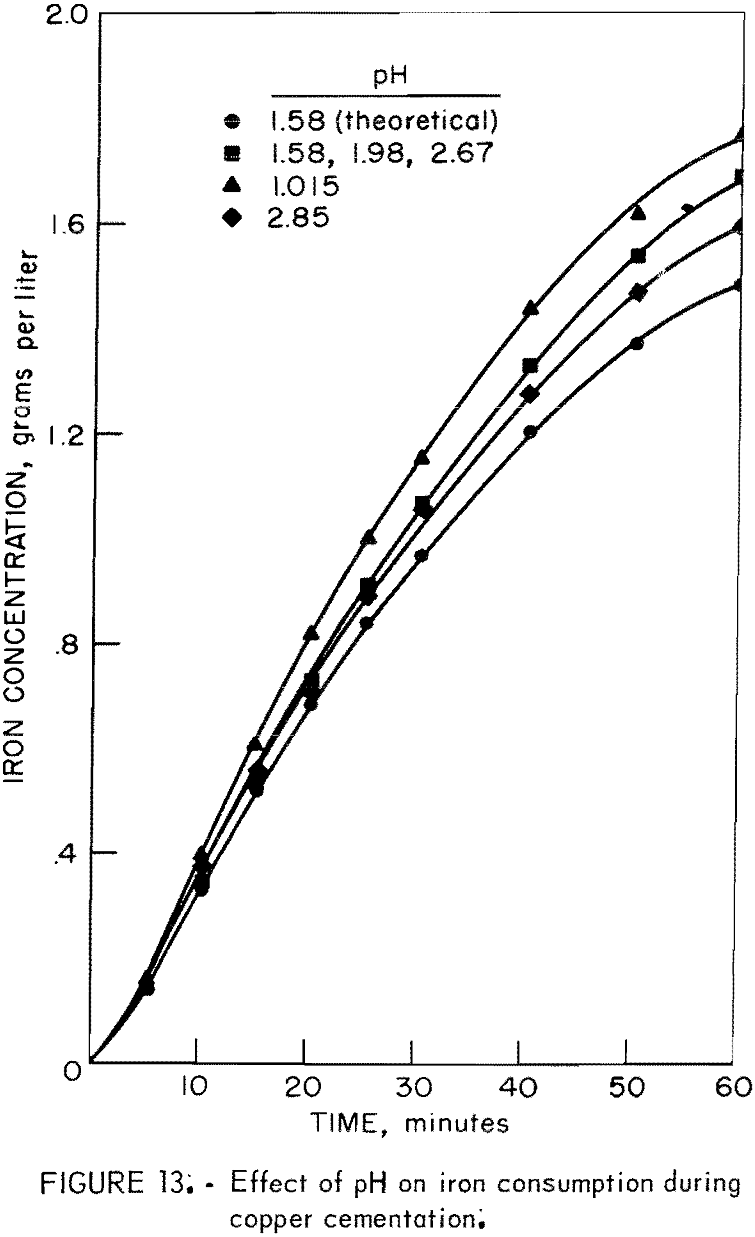
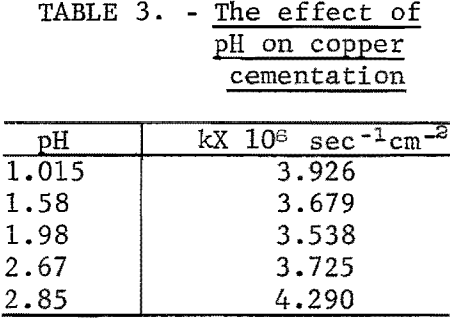
Figure 13 illustrates the experimental iron consumption at different pH values and shows, for comparison, the theoretical iron consumption for pH 1.58. The iron consumption increases as pH increases. The pH of a solution during an experiment remained relatively constant until near the end of the cementation period at which time the pH began to increase due to H+ ion displacement by iron as illustrated by equation 6.
Fe° + 2H+ = Fe+² + H2…………………………………………………………(6)
This part of the investigation shows that the highest cementation rate and lowest iron consumption are achieved at pH values in the region of 2.5 to 3.0. High acidity causes an increase in iron consumption. The solution pH should be regulated to the level needed to prevent precipitation of heavy metal oxides and hydroxides.
The Effect of Temperature
The effect of temperature was examined by varying the experimental temperature and holding all other system variables constant. With the exception of temperature, the conditions for these tests were the same as those of a standard test. The only variable that could not be controlled was the character of the deposit.
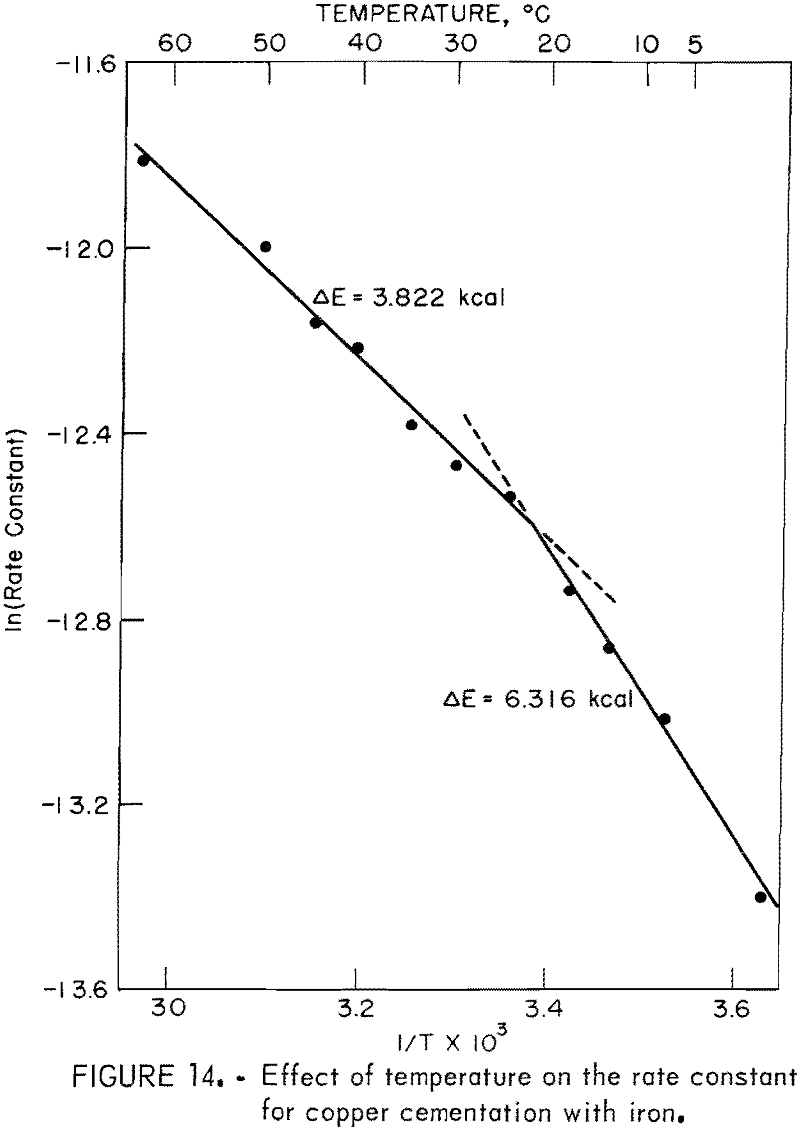
Figure 14 illustrates the effect of temperature. Clearly, there are two distinct phenomena. Below about 22° C, the activation energy for the reaction is 6.32 kilocalories. Above about 22° C, the activation energy for the reaction is 3.82 kilocalories, which is consistent with rate control by diffusion. Miller and Beckstead observed a similar temperature variation. They showed that the change in activation energy was due to a change in the deposit character as a function of temperature. Qualitative observation of the deposits developed in the revolving drum are consistent with the results reported by Miller and Beckstead. At the lowest temperature the deposit was a smooth adherent coating that had the appearance of a polished copper surface. The deposit broke away from the surface as relatively large sheets of copper. As the temperature was increased, the deposit became more dendritic and porous until at the highest temperature, it was a powder that easily broke away from the surface.
This section of the cementation investigation indicates that the mechanism of the process changes as a function of temperature. Below about 22° C, cementation occurs on a smooth, adherent deposit that affords only small rate enhancement owing to increased cathodic reaction area. Above about 22° C and up to at least 64° C, deposition occurs on a porous, slightly adherent deposit that causes significant rate enhancement owing to large deposit surface area. These results suggest that copper cementation should be carried out above about 25° C to avoid a change in deposit character that could slow the reaction rate.
Conclusions
The kinetic study of cementation in the revolving drum has led to the following conclusions:
- The cementation rate is significantly enhanced by a fluidized cathode of cement copper particles surrounding the iron precipitant. The rate of deposition is also enhanced by a fluidized cathode of gold particles. The iron precipitant in the presence of a sufficient quantity of conducting fluidized cathode is observed to be free of any attached cement copper. Removal of deposited copper from the precipitant by quartz, a nonconducting material, resulted in retardation of the cementation rate. Therefore, the enhancement of the cementation rate is attributed to the increase in cathodic reaction area provided by the fluidized copper particles.
- The cementation rate is enhanced by the porous copper deposit attached to the precipitant surface. The enhancement is caused by an increase in cathodic reaction area in contact with the precipitant.
- There is a change in the cementation mechanism as a function of temperature at about 22° C. Below 22° C, copper precipitation occurs on a smooth, adherent deposit that contributes only small rate enhancement owing to increased cathodic reaction area. Above about 22° C and up to at least 64° C, copper deposition occurs on a porous, slightly adherent deposit that causes significant rate enhancement owing to large deposit surface area. The change in cementation mechanism as a function of temperature is attributed to a change in deposit character.
- The rate of cementation decreases as ionic strength increases, which is consistent with the expected change in cupric ion activity as a function of ionic strength.
- The copper deposition rate is directly proportional to precipitant surface area.
- The cementation rate is somewhat dependent upon pH, reaching a minimum value and varying little over the pH range 1.58 to 2.67. The iron consumption increases as pH decreases.
- The presence of oxygen in the cementation system causes an apparent decrease in reaction rate and an increase in iron consumption. The presence of a hydrogen atmosphere in the cementation system appears to have no effect on the cementation process. However, hydrogen gas produced between the copper deposit and the iron precipitant probably aids in the disruption of tightly adherent deposits and influences the process.
