In a continuous thickener the downward solids velocity with respect to the thickener wall is the sum of the settling velocity of the solids by gravity alone, Vi, plus the downward velocity caused by removal of the thickener underflow, U. The rate at which solids move downward by gravity alone is expressed as the product of the concentration of the solids in a layer, Ci, and the settling velocity of the layer. The rate at which solids move downward due to withdrawal of the underflow is expressed as the product of the concentration of the layer and the downward velocity caused by removal of the thickener underflow. Therefore, the solids flux in a continuous thickener, Gi, in any concentration layer can be expressed as:
Gi = CiVi + CiU……………………………………….(1)
If the relationship between settling velocity and concentration is known, the solids flux can be calculated as a function of concentration at various underflow withdrawal rates by using Equation.
Figure 2 shows a typical flux curve at one underflow pumping rate. The procedure used to obtain the relationship between settling velocity and concentration is discussed later. Unless the underflow pumping rate is extremely high, a minimum exists in the flux curve, as shown, which limits the thickener loading rate at a given underflow concentration. If the settling velocity is a function only of the local concentration, it is theoretically true that the thickener must be operated at the limiting solids flux, GL, for this particular underflow pumping rate. Otherwise, if the thickener is loaded at a higher solids flux without a change of the underflow pumping rate, the thickener bed level will increase and eventually overflow the thickener.
In this case, the feed rate of solids exceeds the ability of the thickener to allow all of the solids to reach the bottom of the thickener. Conversely, if the thickener is loaded at a lower solids rate, the thickener bed level will decrease until it disappears.
The limiting solids flux, GL, can be expressed in terms of the limiting concentration, CL, and the limiting solids velocity, VL, as:
GL = CLVL + CLU……………………………………(2)
The limiting solids flux is also the product of the underflow pumping rate and the underflow concentration, Cu, which is easily obtained from material balance around the thickener. Thus:
GL = CuU……………………………………(3)
The predicted underflow concentration can be given graphically by intercepting the tangent at CL with the underflow pumping rate line at Cu as shown in Figure 2.
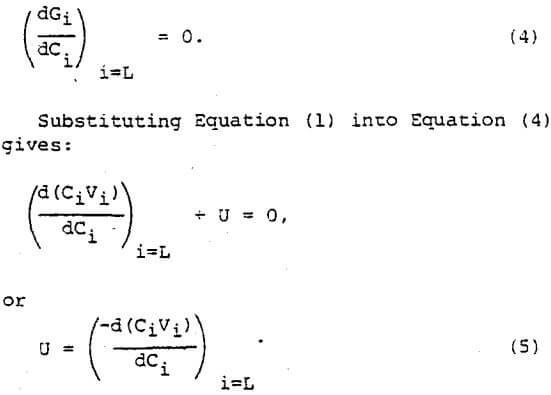
The underflow withdrawal rate can be expressed in terms of concentrations and settling velocities at the limiting conditions by taking the derivative of Equation (1) at the minimum point shown in Figure 2, or:

In order to differentiate the right-side term in Equation (5), the relationship between settling velocity and concentration must be known. A single generalized mathematical expression has not been found to define the settling velocity as a function of concentration for the entire range of concentrations attainable . A typical curve is shown in Figure 3 where the settling velocity is plotted as a function of the concentration on a log-log graph. The initial portion of this curve describes particulate settling phenomenon. In this region, the settling velocity is not a function of concentration. Each particle acts independently as described by Stokes’s Law.
Zone 2 is known as hindered or zone settling. As the concentration increases in this region, the settling velocity decreases for two basic reasons. First, the particles displace liquid which must flow upwards with respect to the particles. This relative motion between the liquid and particles resists the settling of solids. Secondly, as the concentration increases, the specific gravity of the slurry increases, which increases the buoyancy of the slurry and reduces the driving force for settling of the solids.
In this second settling zone, the relationship between settling velocity and concentration can be approximated by one or more straight lines on this log-log plot. The equation(s) of this, straight line(s) has the form:
Vi = aCi -b……………………………………(6)
The constants “a” and “b” must be determined from batch settling data, as described later. Both are influenced by particle size and shape, liquid and solids specific gravities, liquid, viscosity, attractive or repulsive forces between particles, and other factors that may influence settling phenomenon. The exponent “b” is calculated from the slope of the line(s) in Figure 3.
The third settling zone is commonly known as the “compression zone,” and is characterized by particle to particle contacts that allow slurry layers to bear or to be compressed by the weight of the solids above. A portion of the weight of the particles is transmitted to the solids of the lower layer, which results in packing of the solids. The remaining-fraction of the weight is transmitted to the liquid of the lower layer to increase the liquid pressure, which results in liquid escaping through the solids layer, that is increasing solids settling rate. The settling velocity is influenced by the compression force, caused by the weight of solids transmitted to both the solids and the liquid of the lower layer. Therefore, several lines can be obtained as shown in Figure 3, depending upon the compression force, which is related to the slurry depth and concentration of solids in the continuous thickener (and to the initial concentration of the solids and the initial height of the slurry in batch tests). In this compression zone settling velocity is a function of not only concentration, but also compression force.
The relationship between settling velocity and concentration in the compression zone can also be approximated by one or more equations of the form given in Equation (6), but it must be remembered that the values of “a” and “b” will be influenced by compression force. A more detailed discussion of the affects of this compression force is given later on in this paper.
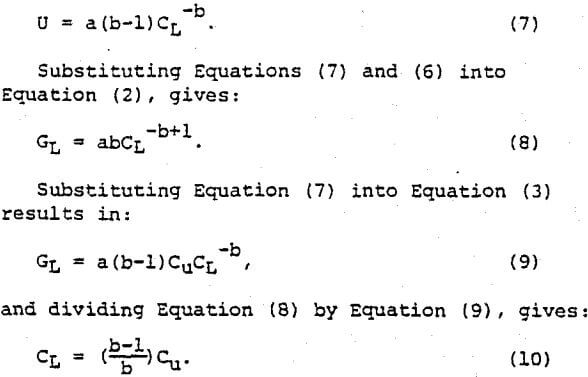
If Equation (6) is substituted into Equation (5), the result is:

Equation (10) relates the limiting concentration to the underflow concentration. Figure 4 shows a concentration profile at a certain operating condition in a continuous thickener. The uniform concentration beginning at the interface in this graph is the limiting concentration. Between the interface and the outlet of the feed-well, there appears another layer of very low concentration, which is shown in Figure 2 as the concentration at the intersection of the total flux line with the tangent through the minimum.
A drastic increase in concentration occurs at the interface. Toward the bottom of the thickener there is usually a fairly rapid increase in concentration to the underflow concentration. It is supposed that this increase occurs because the concentration in this range can handle more solids flux than the limiting concentration.
When the solids inventory in the thickener increases due to the change of the feed solids rate, the increased solids build a layer on the previous interface without changing the limiting concentration, if the change of the inventory results in negligible effect on the underflow concentration. Therefore, Equation (10) is useful in determining the limiting concentration and estimating the change in the bed depth when the feed solids rate changes.
Substituting Equation (10) into Equation (8) gives:

This expression relates the thickener loading rate to the desired underflow concentration. Since several straight lines of the form found in Equation (6) are usually required to approximate the complete relationship between settling velocity and concentration, several equations of the form of Equation (11) must be calculated for the full range of thickener loading rates.
Since most thickener manufacturers use unit area, U.A., instead of solids loading in their calculations, Equation (11) can be modified to give:

Equation (12) presents the relationship between desired underflow concentration and unit area needed for sizing thickeners, and indicates that a log-log plot of unit area versus underflow concentration should give a straight line for each straight line segment approximated in Figure 3. These lines form the operating line for the thickener. A typical operating line is shown in Figure 5 where, four line segments were used to approximate the relationship between settling velocity and concentration. The number of line segments chosen depends upon the number required to describe the relationship between concentration and settling velocity. These segments do not usually apply to the specific settling zones described earlier. They are merely a tool to quantitatively describe the relationship between settling velocity and concentration.
One method for obtaining the relationship between settling velocity and concentration is to run a series of batch tests at different initial concentrations. Initial settling rates and concentrations are recorded and plotted directly to give the desired relationship between settling velocity and concentration. This method is difficult if flocculation of the slurry is required. As the initial concentration is increased, the flocculation generally becomes less efficient, so that measurements of the initial settling rates can only be made for a narrow range of dilute concentrations. This type of testing also requires considerable time in order of obtain enough data points with the desired accuracy.
An alternative method for measuring the relationship between settling velocity and concentration is to use a single batch settling curve as developed by Kynch. He analyxed the batch settling phenomenon under the assumption that settling velocity is a function of only the local concentration, and described mathematically the propogation of uniform concentration layers upward at a constant rate from the bottom of the test cylinder until they reach the slurry-liquid interface.
If the interface height is plotted as a function of time, a curve such as that shown in Figure 6 is obtained. Kynch showed that tangents to the batch curve can be used to relate settling velocity and concentration. The slope of the tangent expresses the settling velocity of the slurry layer existing just below the interface, whose concentration can be determined at the intersection of the tangent with the vertical axis as shown in Figure 6. The settling velocities are calculated from the slopes of the tangent and the concentrations are given by:

Where C0 is the initial concentration of solids; Ci is the concentration just below the interface; Hi is the intercept of tangent with vertical or height axis; and H0 is the initial height of the slurry.
Equation (13) and the slopes of the tangent provide the relationship between the settling velocity and the concentration or the constants “a” and “b”. This relationship is based upon the assumption that the settling rate is a function of solids concentration only. At higher concentrations the settling rate is also influenced by the compressive force created by the depth and concentration of solids, as described earlier. Since this enhanced settling rate is part of the characteristic of the full-scale thickener due to the compressive force, it is desirable to have this same influence in the batch settling tests. It is, therefore, desirable to run the batch settling tests at similar slurry depths and concentrations to those expected in a full-scale thickener.
