Table of Contents
Flotation Column Cells can only ‘carry’ or recovery so much froth/concentrate for any given diameter. Unlike a mechanical cell on which you can just turn-on more air to recover more metal, column cells with not respond that way. A column cell can only carry so much froth to the concentrate launder. Their concentrate production is ‘Maxed-Out’ by design. Flotation Column Cell have a limited froth Carrying Capacity.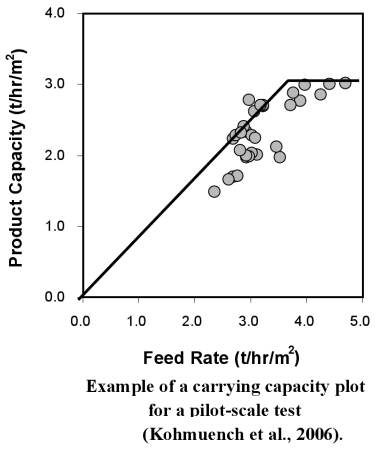
50 mm Columns vs Mechanical Cells.
Since the sized behaviour of the 50 mm column is being used as a baseline for the plant columns, it is necessary to explain how it compares with mechanical cells. The 50 mm column was compared with mechanical pilot plant cells at least once, in four different cases during the Hilton pilot plant testwork (prior to the commissioning of the Hilton Concentrator). Each pilot plant circuit was made-up of three closed-circuit cleaning stages using mechanical cells. Also the 50 mm column was compared with the lead and zinc cleaner block feed at the Mount Isa Lead/Zinc Concentrator. Each one is made-up of three closed-circuit stages of cleaning using mechanical cells. In all cases the column and the mechanical cells were run in parallel.
The main points from these comparisons were:
- For four of the six circuits tested the size behaviour between the two units was similar in all fractions.
- For two of the circuits (lead cleaner feed for Hilton hanging wall ore in the pilot plant and zinc cleaner feed in the Lead/Zinc Concentrator) the mechanical cells had a better rejection of the coarse particles and high recovery of fines.
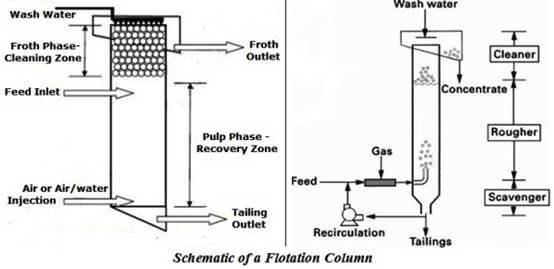
The inconsistent sized behaviour of the 50 mm column on the two last stream was caused by operating this unit at bias rates higher than 0.3 cm/s, i.e. 0.4 to 0.6 cm/s. For a similar behaviour between the 50 mm column and the mechanical cells, it is recommended to operate the 50 mm at bias rates from 0.0 to 0.3 cm/s.
Flotation Column Cell SCALE-UP Example
The procedure used to scale-up the five column circuits has been explained in detail in other publications (Espinosa-Gomez, R. Johnson N.W. and Finch, J.A. 1989; Espinosa-Gomez, R and Johnson N.W. 1989). The scale-up procedure has four steps.
- Determine mineral rate constants, k, using the 50 mm column.
- Estimate from theory expected mixing conditions for chosen column dimensions and throughput.
- Predict expected number of columns from (1) and (2).
- Check if the predicted discharge rate of solids in concentrate in (3) exceeds a maximum production rate and, if necessary, limit the discharge rate to the maximum allowable.
This procedure was followed in a conservative manner to give some extra capacity which could minimise decreases in recovery due to fluctuations in the throughput to the circuit. One example of this is the extra capacity that was built-in to the design during the calculation of the rate constants. The rate constants were calculated using the nominal residence time (i.e. without subtracting the gas volume). This gave about 20% extra capacity.
For the last two circuits commissioned, i.e. lead and zinc columns at Hilton, the maximum production rate (i.e. carrying capacity, CA, Espinosa-Gomez et al, 1988) was calculated more conservatively, using carrying capacity values measured in the bulk lead-zinc column no. 1. For the first three circuits, ca, expressed in g/(min x cm2).
Was calculated as Ca = 0.068 x d80 x sc (1) and for the two Hilton circuits as Ca = 0.035 x d80 x sc (2)
Basically, for design purposes the equation with the parameter 0.035 is the one to use. The one with the parameter 0.068 was generated from data base of smaller columns and does not work with big columns. This is with a positive bias. With a negative bias, presumably there is no significative restriction.
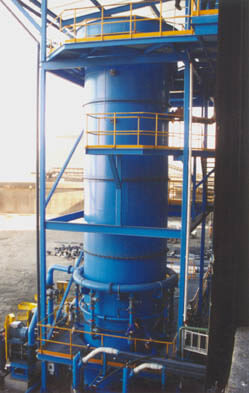 Where d80 and sc are the 80% passing size in the concentrate (microns), and concentrate solids density (g/cm3). New data on Ca from the Hilton columns also support the use of equation 2. Equation 1 was derived from columns of less than 1.1 m diameter, and particularly from 50 mm diameter columns.
In all column circuits this procedure has been successful. However, due to its infancy, it is acknowledged that the procedure can be improved by including new observations. These new observations come from experiences in running the five column circuits and analysing there behaviour in detail. This section explains these new observations.
Lower Flotation Rate Constant in Plant Columns
The rate constant (k) for the valuable mineral is a key parameter for a proper scale-up, and ideally the value measured in the 50 mm column should be the k value likely to exist in the future plant column. However, the values in the plant columns are lower, at similar air addition and bias rates. Therefore, the 50 mm column must be run at conditions which generate constant values as close as possible to the values in a plant column installation. There are also some operating problems which can contribute to a rate constant which is unnecessarily low.

SGS
Recent Advances in Mineral Processing Plant Design
Rodolfo Espinosa Gomez
Froth Transport
Another key consideration in the design and operation of a column flotation cell is the amount of bubble surface area available to carry particles through the froth phase. Recent data reported by Espinosa-Gomez et al. (1988) suggest that the maximum flow rate of product solids per unit of column cross-sectional area is directly proportional to the size and density of the floated particles. These data, which were obtained for mineral systems, are reproduced in Figure 3 along with additional experimental data obtained for various coal flotation columns. The data clearly suggest a maximum limit on column capacity, although there is a considerable degree of scatter in the experimental data.
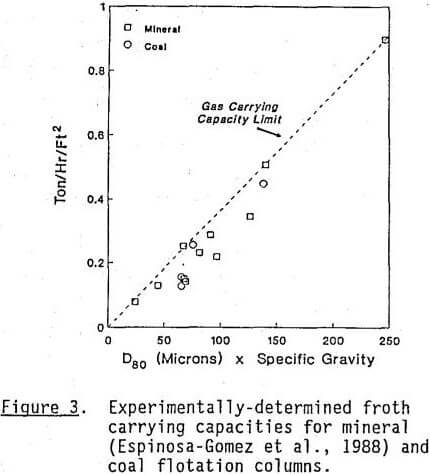
From a simple theoretical analysis, it can be shown that the flow rate of solids (C) to the product stream is given by:

air, Dp the particle diameter in the froth phase, p the particle density, β a particle packing factor, and Df the bubble diameter in the froth phase. This expression clearly indicates a linear relationship between the column capacity and particle size and density. However, Equation [11] also suggests that gas flow rate and the size of bubbles in the froth may also play a significant role in determining the maximum product flow rate.
Effect of Hydrophobicity
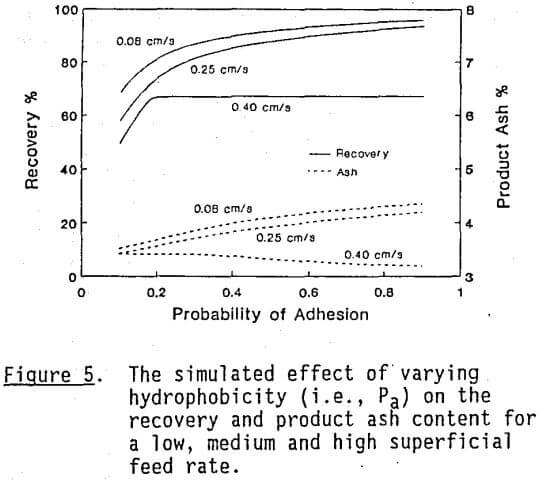
For given bubble and particle sizes, an increase in particle hydrophobicity results in an increase in Pa. The effect of increasing Pa on recovery and product grade is shown in Figure 5. For low feed rates, an increase in hydrophobicity produces a corresponding increase in recovery. Since additional middlings particles are recovered under these conditions, an increase in product ash content is also produced.
As the feed rate is increased beyond 0.25 cm/s, the column begins to become carrying-capacity-limited in the froth phase, as indicated by the flattening of the recovery curve. This occurs for Pa values greater than approximately 0.18. As Pa, is raised beyond 0.18, the circulating load (£) between the pulp and froth phases defined by Equation [12] begins to increase. Under these conditions, the fast-floating particles begin to be concentrated in the froth phase. The net effect of this action is to produce an overall improvement in product quality, i.e., a decrease in product ash content, at a relatively fixed level of recovery.
Continuous flotation experiments were carried out in our 0.076 m x 3.55 m pilot flotation column. The column was fitted with six accuracy pressure transmitters (Cole-Palmer H-68971 series) at varying axial locations.
The output from these sensors were fed to a computer. The desired hydrostatic head in the column (measure of the liquid level) was set using the pressure sensor located at the bottom of the column. By regulating the tailings pump using an icon-based control program (COLUMNCT.VI), the hydrostatic head was maintained at the set value.
The flotation experiments were carried out using – 100 mesh Lower Kittaning seam coal. The ash and sulfur contents of the feed coal were 9.4% and 0.78% respectively. 100 liters of the coal slurry was prepared for each run. The required amount of frother was added directly to the slurry in the reservoir. Except where indicated, the frother used was methyl-iso-butyl-carbinol, MIBC, and the feed solid concentration was 5 wt. %. The feed was introduced into the column at the desired flowrate with the air turned off. When the desired hydrostatic head in the column was attained, aeration was turned on. Collection of timed froth and tailings samples were initiated the moment the froth overflowed the cell lip. For the froth samples, collection was over 30 sec intervals for the first minute and 1 min. intervals for the remainder of the experimental run.
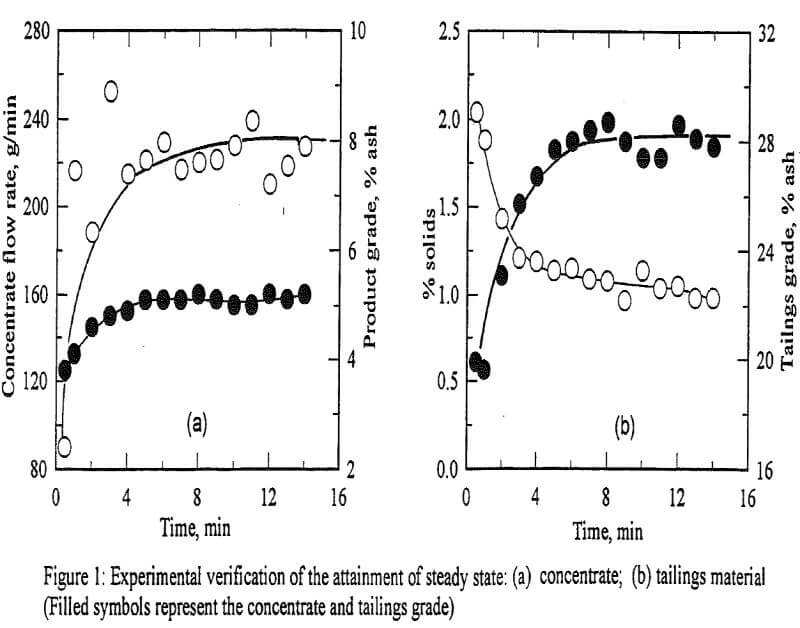
In preliminary experiments, it was observed that froth removal would present a significant bottleneck in the accurate determination of the concentrate flowrate. This problem was overcome with the installation of a water ring spray on the outer periphery of the cell lip. For all the experiments reported here, the wash water addition rate was fixed at 1.2 liters per minute. Figure 1 shows the variation of concentrate flow rate, percent solids in the tailings, concentrate and tailings grade with flotation time. The results clearly show that steady state conditions are achieved in about 3 min. Subsequently, this mode of operation was adopted for all the flotation runs reported here.
The initial studies were carried out with the column equipped with a Mott porous gas sparger (average pore size of 2 µm). In some of these experiments, the slurry feed was introduced into the column at varying inlet positions which ranged from 0.43 m – 2.37 m from the gas distributor. From these experiments, the effect of recovery zone height on concentrate production rate was determined. Additional experiments were also carried out at varying feed slurry concentrations (2.5% – 10%) and air flowrate (1.5 liters/min – 6 liters/min).
In order to determine the effectiveness of a novel bubble generator which is currently under evaluation at Penn State, additional flotation experiments were carried out with the column equipped with the Vortactor turbulent contactor. In these experiments, the slurry feed and air were brought into intimate contact in the vortactor chamber where the pressure was set at 138 kPa. The slurry-air mixture was also introduced into the column at two axial locations to provide a preliminary evaluation of the effect of recovery zone height. A detailed description of the Vortactor turbulent contactor and its operation can be found elsewhere.
The froth and tailings samples were filtered, dried and weighed. For the tailings samples, the amount of water was also measured in order to determine the tailings flow rate at any given time interval, and the per cent solids in the tailings stream. All of these values were used to determine the attainment of steady state in our experiments (see Figure 1).
The particle size distribution of the feed and tailings samples were carried out. Approximately 50 g of the coal sample was placed in a beaker containing tap water. A small amount of Calgon and a few drops of Coal Master were added. The beaker was placed in a sonicating bath for 2-3 min to break the agglomerates. The sonicated coal slurry was wet sieved through a 400 mesh screen. The two fractions were dried and weighed.
The +400 mesh sample was dry screened. Approximately 1 g of the -400 mesh sample was dispersed in 100 ml of distilled water. After the addition of 0.1% Calgon solution and Coal Master, the particle size distribution was determined using a Leeds and Northrop SPA MicroTrac. This procedure was repeated for the feed material.
The static pressure measurements along the column height were used to compute the average gas hold-up in the recovery zone. Using the drift flux approach, the average bubble size was estimated. With this information, the ratio of the projected particle surface area per unit bubble surface area were calculated for the different experimental runs.