Table of Contents
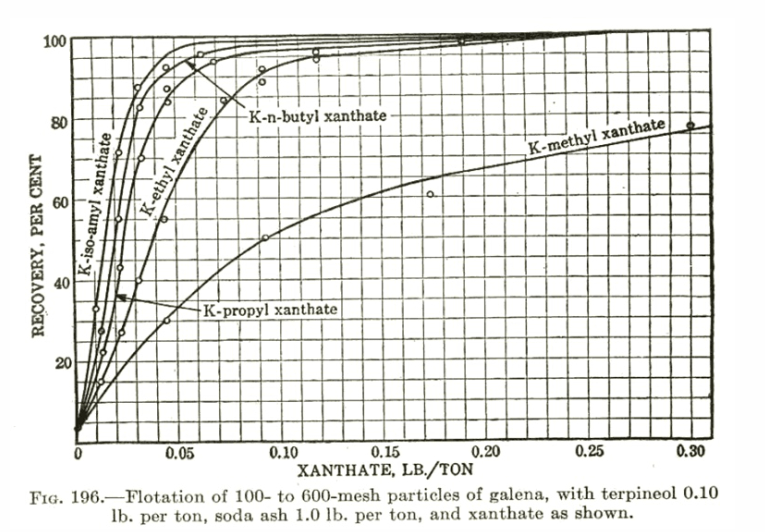
A little about collector strength and Xanthates: Some call it selectivity, I call it “how much do you put on”. Even the most selective collector can be rendered un-selective it you add enough.
In reverse order of strength (strongest to weakest):
- PAX
- SIBX
- SIPX
- SEX
- Methyl Xanthate (uncommon)
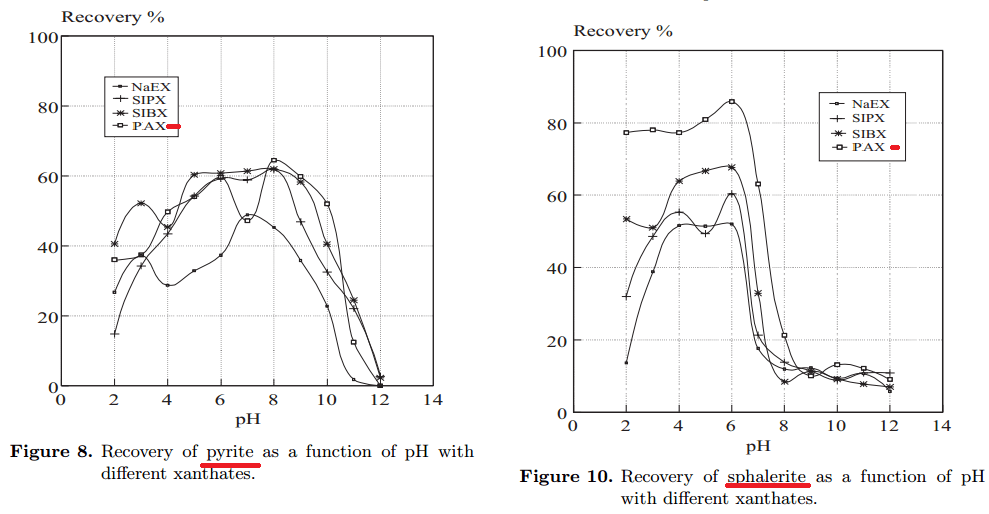
More about the collecting power of xanthate and the Effect of pH on Pulp Potential and Sulphide Mineral Flotation at https://www.scribd.com/doc/174126698/Effect-of-pH-on-Flotation or https://journals.tubitak.gov.tr/engineering/issues/muh-02-26-4/muh-26-4-2-0103-22.pdf
The decision about which xanthate to use is typically based on dosage and cost. We tend to observed similar metallurgical performance using any of the xanthates, you just need a lower dosage as you go up in strength. What will change performance is switching the family of reagent. i.e. dithiophosphinates (3418A) or carbimates (5100) etc. These are more selective collectors and will exhibit different performance regardless of dosage in our experience.
TYPES OF XANTHATES
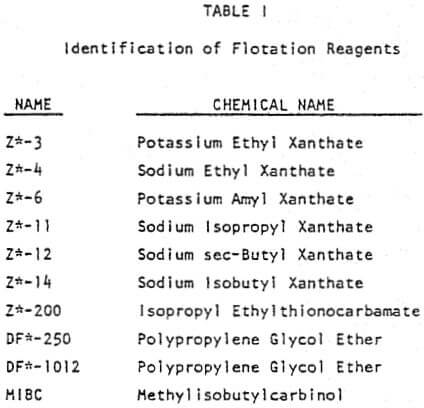
Most zinc circuits use SIPX. In the lab, we need the weaker xanthate as PAX is too strong and the dosages have to be so low that we have trouble accurately adding it.
There may be some minor differences in performance with different xanthates, but they’re pretty minimal in our experience once you take out the effect of dosage.
There are two surface chemistry interactions taking place between particle, xanthate molecule and the air bubble.
1. Particle surface – xanthate charged end
2. Xanthate molecule polar end – bubble surface
First interaction gets stronger as the mineral charge on the particle surface gets stronger (if metallic mineral is more exposed – liberation – or if mineral surface is influenced by properties of the pulp such as pH). OR/ AND if the xanthate ionic/ charged end is more charged – e.g. stabilized by K+ vs. Na+ or when the structure of the polar end is shorter and more branched, then hydrocarbon chains will create stronger charge on the ionic end.
E.g. here is the theoretical order of affinity of xanthate molecule to the same mineral surface from strongest to weakest: amyl > isobutyl > ethyl > propyl > butyl xanthate.
In case of the second interaction between xanthate and the air bubble surface, there are two main factors at play – the stability or rigidity of the bubble surface (depends on the frother used and its amounts). And the length of the hydrocarbon chain of the xanthate: the longer or the more branched is the chain, better xanthate molecule will stick to the air bubble surface. Order from strongest to weakest interaction between xanthate molecule and air bubble is theoretically: butyl > propyl > isobutyl > ethyl > amyl.
The longer chain xanthates can present good recoveries with well liberated particles, because they will be able to attach pretty much anything to the air bubble. Selectivity of long chain xanthates is usually poorer than with the shorter chain xanthates and thus their consumption is relatively higher (up to 20-30% compared to one degree shorter hydrocarbons). In case particles size is increased (liberation decreased), and there are not enough of metallic species in the ore, recoveries with longer chain xanthates will be most vulnerable. For rougher recovery of particles with high content of pyrite, pyrrhotite and other abundant species longer chain xanthates indeed do show better recoveries.
The Evaluation of Collectors in Sulfide Ore Flotation
The influence of pH on collector efficiency as related to recovery is veil known. However, the effect of pH on K can be equally important with increasing pH causing an increase in K even in pH ranges where R is dropping in value. Figure V demonstrates this type of pH interaction on two widely different copper sulfide ores using constant dosages of DF-1012 and Z-200. The R curves for both copper and gangue have rather pronounced maxima with the K curves increasingly monotonically with pH. It is interesting to note that with different ore types the differences in K can be significantly greater in influencing over-all plant performance than the differences corresponding to the maximum R values achievable by proper pH control. This is consistent with observed history of testing flotation reagents such as the Xanthates at many sulfide flotation plants. Lab evaluations of these historical trials based on classical one time point recovery tests (e.g. R alone) has simply not been enough to provide accurate lab predictions of plant performance.
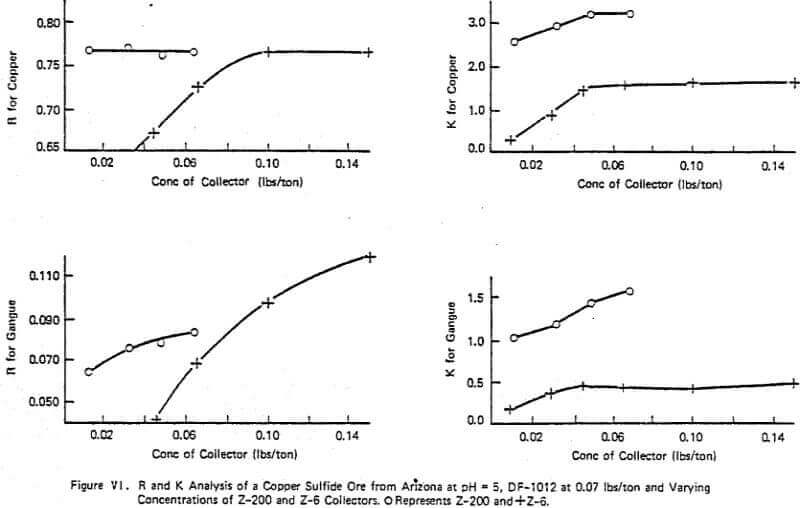
Figure VI summarizes a typical lab study of evaluating several collectors (Z-6 and Z-200) on a given ore holding the frother (DF-1012) and pH constant. The effect of concentration between the two collectors is obvious with the maximum ultimate copper recovery, R, achievable being about the same with either reagent. However, the rate effect of the two reagents is significantly different which was shown to be important in later plant scale testing as the plant was in a region of rate control. The use of Z-200 over Z-6 gave increased plant recoveries of 2-3% with constant DF-1012 dosage. The critical lab K was found to be 3.5. The pattern of R and K changes for both copper and gangue are similar although use of high dosages of Z-6 lowered the grade compared to Z-200 as indicated by the R trends of the gangue as shown in Figure VI. This is one of several examples indicating the importance of optimizing flotation not only for R but also K. In this example, without knowledge of the rate characteristics associated with the two chemical systems, the prediction of plant performance from lab data would be strictly trial and error.
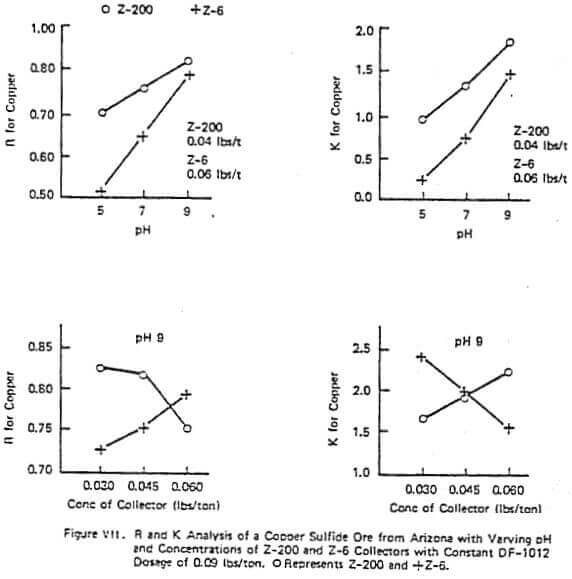
Figure VII shows a similar test to those just discussed but on a different ore. This figure demonstrates that with some ores adding too much of some reagents can be harmful on either R or K (e.g. the effect of 0.06 lb/ton of Z-200 at a pH of 9). The collector Z-200 is particularly sensitive to pH with many ores and often requires a pH of 9 or lower to be economic. Also in this figure, at a given pH and frother concentration the R and X trends with different reagents can be exactly the opposite. In this data set, increasing collector concentration of Z-200 lowers R and increases K while increasing Z-6 increases R and lowers K. This reverse pattern with different reagents was demonstrated in the plant.
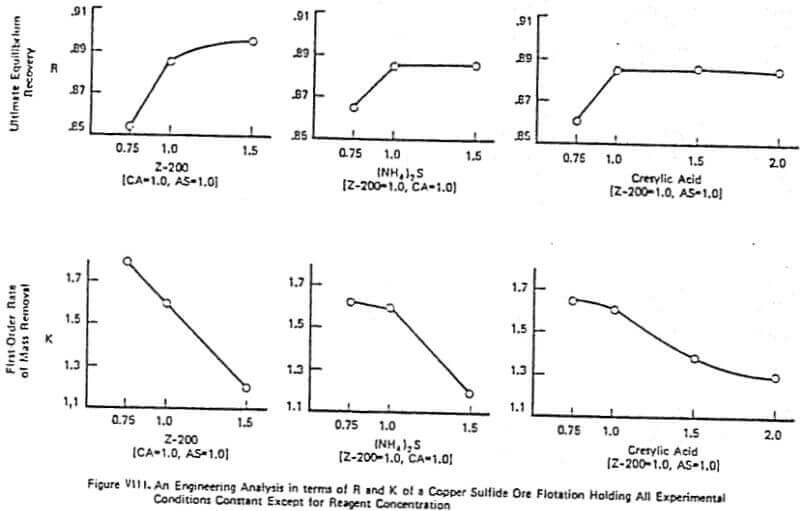
Figure VIII gives an example of a detailed lab analysis on a copper sulfide ore utilizing cresylic acid, Z-200, and ammonium sulfide. This example is very typical of why a good lab test can go bad in the plant trial. A simple factorial experiment on reagent concentration was run with the concentration of each reagent being normalized so that 1.0 part cresylic acid (CA), 1.0 part Z-200 collector, and 1.0 part of (NH4)2S (AS) represents the optimal lab reagent combination. Inspection of Figure VIII shows why the 1.0, 1.0, 1.0 combination was chosen.
The increase in the ultimate equilibrium recovery, R, with reagent addition is obvious with the greatest increase being, in all cases, from a concentration of 0.75 to 1.0. One goal of the plant trial was to achieve the 2% increase in R using increased Z-200 dosage from 1.0 to 1.5. As is often the case, however, this increase in recovery due to increased reagent dosage is accompanied by a decrease in the K or rate of removal of mass from the cell. With this ore, the rate decrease generally becomes more significant as reagent addition increases. This was exactly what was observed in the plant as plant recovery fell when the Z-200 dosage was increased from 1.0 to 1.5 – contrary to what the classical lab tests indicated. Thus, having the information on the K’s clearly pointed to the potential for trouble in the plant with increased collector dosage. Therefore, the selection of optimal reagent combinations should be based on maximizing the ultimate recovery R while minimizing the loss in the rate of mass removal from the cell (it was found that maintaining a lab K value of 1.5 was critical in the above test). The importance of maintaining a sufficiently large value of K or R depends on the plant economics, the mineral value, the flotation circuit configuration, and the over-all cell capacity that exists in the plant. For example, if the rate of mass removal from the cell is not limiting the observed recovery in the plant, then a loss in X is not as important as maintaining or increasing R.
The Evaluation of Xanthate Collectors
The examples presented to this point have emphasized the differences in R and K that various reagent changes can cause. However, with some sulfide ores a rather amazing insensitivity to changing collector type exists (especially with Xanthates). Figure IX shows such a study on a copper ore run with a wide range of Xanthates utilizing MIBC frother and a constant pH of 10.5. The implications of the data presented in this figure as well as those of data collected from other tests with Xanthates on different ores are important and somewhat unexpected. It is well known that the chemical structure differences exhibited by the various Xanthates do exhibit differences in the equilibrium recovery of a given ore that can be achieved with constant dosages of active material. However, it has been found using the R-K analyses of this article that when it is possible to adjust the concentrations of different Xanthates on a given ore to give approximately the same target equilibrium recovery (hence the same R), the rate character (the K value) associated with this target R is nearly always the same regardless of the Xanthate used.
This is quite important for several reasons: first, the obvious chemical implication that the structural differences between Xanthates do not significantly affect K (unlike, for example, Z- 200, a carbamate, versus Z-6, a Xanthate, in Figures VI and VII) and second, the obvious, engineering implication that sometimes none of the Xanthates are effective in improving a flotation that is under rate control as the Xanthates are very often relatively poor in rate performance and indistinguishable from one another with regard to rate. If one increases the target value of R desired by adjusting any of the Xanthate concentrations, the associated K will automatically drop in value (e.g. note Z-6 in Figure IX). Thus, it is important, when using any of the Xanthates on sulfide ores with a plant operation that potentially could be in rate control, to be aware of the possible need to improve the rate character of the flotation by some means other than increased amounts of Xanthate. In a few cases, this can be done mechanically but most often is best done by using a frother capable of high rates of mass removal (e.g. the glycol ethers which will be shown in the next section) or by blending appropriate collectors (e.g. a Xanthate and Z- 200 which is sometimes done in practice). If the plant can be shown to definitely not be in rate control, the implication is to use the collector (e.g. Xanthate) which gives the target R and grade with the lowest over-all cost.
