Table of Contents
Purpose
In the past several model studies of the behavior under load of both randomly (4) and regularly jointed rock masses have been published. The studies of regularly jointed masses involved block models composed of a large number of blocks of equal shape, such as square, hexagonal and parallelepipedal, both with continuous and discontinuous joints. In most cases, the surfaces of individual blocks were relatively smooth, with the exception of, where the blocks were produced by tensile splitting.
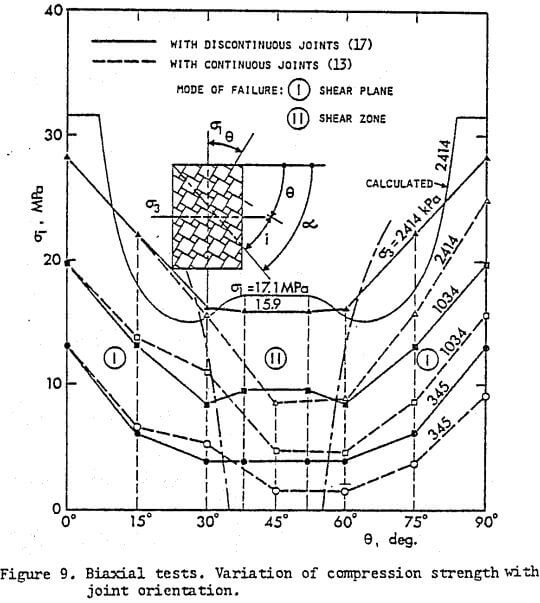
The study described in this paper involves biaxial tests on blocks models composed of two sizes of blocks of square cross-section, piled up in such, a pattern that aid the joints were discontinuous (Figure 9). The study, which was also carried out within the Open Pit Slope Project, is considered to be an opposite case to the previous one in which all the joints were through-going and which showed a tendency to kink band formation at failure
The rock-like material selected for the tests was the same as in the case of previously described direct shear tests, i.e., the compressed concrete bricks, available commercially.
Geometry of the model and the unit blocks
The biaxial tests were carried out on rectangular block models 50 cm wide, 100 cm high and 15 cm thick, composed of about 1500 unit blocks, each 15 cm long. The blocks had a square cross-section, but were of two different sizes, i.e., 2.5 x 2.5 cm and 1.25 x 1.25 cm. For any given orientation of joints, the blocks were manually piled up in a regular well-interlocked pattern with no through going joints, as shown in Figure 9. In order to prevent tensile splitting of the blocks normally to their longitudinal axis, thin metal strips were inserted between certain rods to serve as a tensile reinforcement.
Testing set-up
The block models were loaded in a loading frame containing a system of eight 540 kN capacity hydraulic jacks, Figure 5, of which four served for applying the major principal stress vertically to the top of the model through a rigid steel bar. The confining pressure was applied by the remaining four jacks, two on each side of the model, acting through a flexible stress distribution system. The lateral loading system, composed of eight independent plates on each side, was intended to furnish a uniform distribution of lateral pressure on the model and to enable any kind of lateral deformation or failure to freely develop in the model.
The applied loads were measured by pressure cells and the displacements by a system of potentiometers and dial gages, installed vertically, horizontally, and normally to the expected failure plane. All measurements were electronically recorded on a single chart using a flipflap system. In addition, during each test, pictures of the model were taken at regular intervals and identified with the corresponding points on the stress-strain curves.
Results of biaxial tests
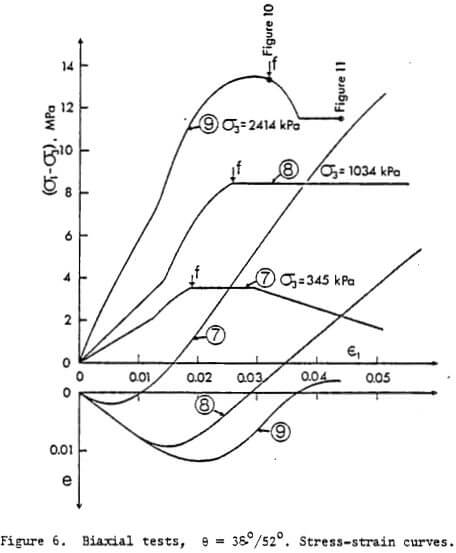
Altogether 9 successful biaxial compression tests of this type were carried out under three different confining pressures (345, 1034 and 2414 kPa) and with two discontinuous joint sets dipping at three different angles (15°/75° ; 30°/60°, and 38°/52°). The main results of the tests are compiled in Table 1, and are shown graphically in Figures 6 to 9- In addition, Figures 10 and 11 show two successive stages of test No. 9 from which the mode of failure in the test can be clearly seen. The stage of test at which each picture was taken is indicated on the stress-strain curve, Figure 6.
Discussion of results
(a) Stress-strain behaviour: Figure 6 contains two related plots: the upper one represents the stress-difference vs axial-strain curves, and the lower one the volume strain e = ε1 + ε3 in terms of axial strain ε1 which is a conventional manner of representing the results of such tests in the geotechnical field. The figure shows the results of only 3 of 9 tests, but can be considered as a typical result.
The stress-strain curves show, as expected, that with an increasing confining pressure σ3, there is an increase not only in the peak strength but also in the slope of the stress-strain curves and in the amount of volumetric compression. A particular aspect of the curves worth mentioning is the fact that they are mostly flat-topped, i.e., they did not show a typical brittle behaviour. This seems surprising at first sight since the failure occurred mostly by shearing of solid bridges. It is thought that a progressive failure mechanism may have contributed to this particular behaviour.
Since the slopes of the stress-strain curves seemed proportional to their peak values, an attempt was made to see if there was a proportionality between the deformation modulus E and either the confining pressure σ3 or the stress difference at failure (σ1 – σ3)f. The last three columns of Table 1 show the values of E calculated from the curves, as well as the ratios E/σ3 and E/(σ1 – σ3)f. It will be seen that the former ratio shows a much wider variation than the latter. For the latter, a good average value is E = 50(σ1 – σ3)f. While this is obviously not a general relationship, this result shows that in a fractured rock mass this kind of correlation may be found quite useful.
The same finding obviously implies that in the tests failure occured at a nearly constant axial strain of about 2 to 3 per cent with no particular respect to the confining pressure and the joint orientation. This may give some idea of the order of magnitude of the deformation necessary to bring to failure a slope in a well interlocked blocky rock mass.
As far as the volume changes are concerned, the lower set of curves show a volume strain behaviour very similar to that of a very dense granular mass. With increasing confining pressure, the volume compression component is increased and the dilation rate at failure is gradually suppressed. It should be noted that the curves show only average volume dilations. The true dilations were actually higher and concentrated in limited shear bands or areas within the samples.
Among the pictures taken during the tests, only two of which are shown here, there were several ones taken at the point of failure (indicated by “f” on the stress-strain curves). They show that, with the exception of the tests with joint orientation of 38°/52°, where a shear zone formed at failure, all the other tests failed by shear along a discontinuous joint after shearing off the solid blocks. All the tests showed very little loosening before failure. After failure, zones of loosened mass developed in several tests, but this fact did not produce as much loss of strength as one would expect.
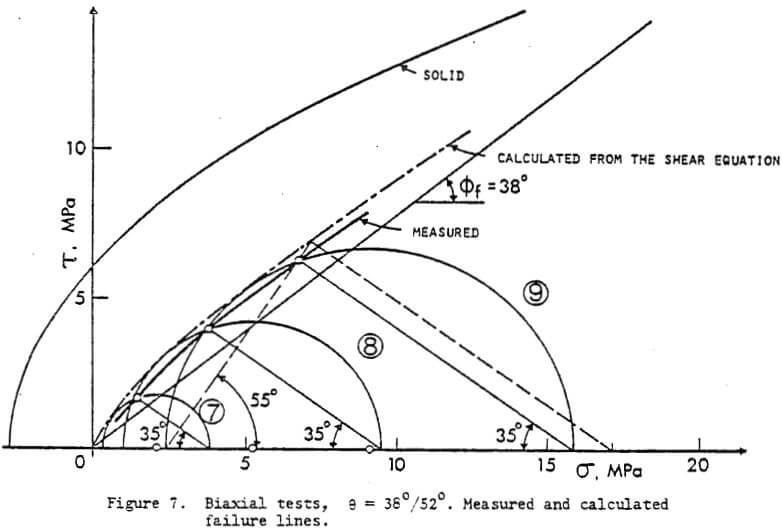
(b) Failure lines in the Mohr slot: Figure 7 shows for tests 7, 8 and 9, a set of-Mohr circles at failure and the corresponding failure points obtained by respecting the anisotropic character of failure of such a mass, i.e., the points represent the stresses in the failure planes actually observed in the tests. The values of angle (90-a) between these observed planes and the directions of σ1 are given in Table 1 for all the tests.
From Figure 6 it will be seen that the failure line is curved and tends to the origin, in spite of the presence of solid bridges. The result, found also in all other tests (17) is thought to be due to a progressive type of failure in which the solid bridges are progressively eliminated and replaced by friction. A similar conclusion can be made from Figure 8, which shows all the observed failure lines in a principal stress plot. Again, all the lines for sloping joints point to the origin, indicating that an unconfined compression strength much higher than zero may be expected only when the block orientation is parallel and normal to the applied major principal stress, as found by Ladanyi and Archambault (1972) (dotted line in Figure 8).
(c) Variation of strength with inclination of joints: Figure 9 shows the variation of the major principal stress at failure with the inclination of joints for three confining pressures, σ3 = 345, 1034 and 2414 kPa. The curves are symmetric with respect to θ = 45° because of the regular joint pattern used in the tests.
For comparison, the curves obtained earlier by Ladanyi and Archambault in biaxial tests on blocky material with continuous joints are also shown in Figure 9.
It will be seen that the two sets of curves coincide only in the region of θ = 0 to 30°. For all other joint inclinations, the strength of models with continuous joints was much smaller.
This is thought to be mainly due to the different modes of failure occuring in the two types of models. In fact, while in the models with continuous joints, kink bands formed in the region of 40° < θ < 80°, this mode of failure, associated usually with the lowest strength, was completely absent in the present models with discontinuous joints. In the latter, only two modes of failure were actually observed: I. Failure along a well-defined shear plane, and II. Failure involving a shear zone. The regions I and II involving the two types of failure are indicated in Figure 9.
Possibility of predicting the strength in biaxial tests
An attempt to predict the strength observed in the biaxial tests was made for σ3 = 2.4 MPa on the following assumptions:
- The upper level of strength was calculated from the compression strength of the solid model material. From the parabolic envelope of the material, one gets for σ3 = 2.4 MPa, a value of σ3 = 31.6 MPa. This is seen to exceed by about 3.5 MPa the measured strength, and the difference gets larger for lower confining pressures. It is obvious that a correct failure line for this upper level is, in fact, the line θ = 0°/90° shown in fig. 8, which has been found experimentally for a jointed rock mass but can also be calculated by using the shear equation.
- In the region I of θ = 7 to 30°, failure is assured to coincide with the joint direction, as observed in the tests. The strength variation for such a case can be calculated by assuring an ordinary planar anisotropy, i.e. at failure:
 The resulting calculated curve is shown in Figure 9. Its minimum is located at θ = 26° and is equal to σ1 = 15.1 MPa.
3. In the region II (θ = 35 to 55°), where a shear zone mode of failure was observed, the strength was calculated by using the proposed shear equation and by taking into account that the deviation angle of joints with respect to the shear zone direction was i = α – θ = 55° – 38° = 17°. The other data were: Co = 24.8 MPa, n = 9, ∅f = 38°. The parameters v and as were calculated by using the formulas for the shear zone proposed by Ladanyi and Archambault, i.e.,

The calculation of T at failure was trade for 3 different normal pressures: σ = 2.76, 6.90 and 11.0 MPa (giving T = 3.39, 6.68 and 9.66 MPa) and the resulting failure line is shown in Figure 7. From the latter, the corresponding value of σ1 = 17.1 MPa at failure was found graphically for the failure zone inclination of α = 55°, and for σ3 = 2.41 MPa. It is found that it agrees reasonably well with the observed strength in this region (15.9 MPa).

